ICT Fair Value Gap [LM]Hello traders,
I would like to present you ICT Fair Value Gap script. The idea is the same as in my other script to look form imbalances. I have improved the previous script from teaching of ICT and created this script to train the eye to see those gaps. Shrinking option also shows if the gap has been already filled and also in case gap is filled you can get alert in case you will set it up .
The script has two settings:
general settings - definition of volatility condition for middle candle
box settings - setting for boxes, box colors, shrinking
I hope you enjoy it,
Lukas
Cerca negli script per "gaps"

AbdulLibraryLibrary "AbdulLibrary"
The library consists of three sections:
Technical Analysis Functions - A collection of tools commonly used by day traders
Trading Setup Filters Functions - A number of filters that help day traders to screen trading signals
Candlestick Pattern Detection Functions - To detect different candlestick patterns that are used in day trading setups
Note that this would have been possible without the help of @ZenAndTheArtOfTrading as I build-up this library after completing his pine script mastery course so big thanks to him
The content of the library are:-
fibLevels(preDayClose, preDayHigh, preDayLow) Calculates Daily Pivot Point and Fibonacci Key Levels
Parameters:
preDayClose : The previous day candle close
preDayHigh : The previous day candle high
preDayLow : The previous day candle low
Returns: Returns Daily Pivot Point and Fibonacci Key Levels as a tuple
bullishFib(canHigh, canLow, fibLevel) Calculates Fibonacci Levels in Bullish move
Parameters:
canHigh : The high of the move
canLow : The low of the move
fibLevel : The Fib level as % you want to calculate
Returns: Returns The Fib level for the Bullish move
bearishFib(canHigh, canLow, fibLevel) Calculates Fibonacci Levels in Bearish move
Parameters:
canHigh : The high of the move
canLow : The low of the move
fibLevel : The Fib level as % you want to calculate
Returns: Returns The Fib level for the Bearish move
getCandleSize() Calculates the size of candle (high - low) in points
Returns: Returns candle size in points
getCandleBodySize() Calculates the size of candle (close - open) in points
Returns: Returns candle body size in points
getHighWickSize() Calculates the high wick size of candle in points
Returns: Returns The high wick size of candle in points
getLowWickSize() Calculates the low wick size of candle in points
Returns: Returns The low wick size of candle in points
getBodyPercentage() Calculates the candle body size as % of overall candle size
Returns: Returns The candle body size as % of overall candle size
isSwingHigh(period) Checks if the price has created new swing high over a period of time
Parameters:
period : The lookback time we want to check for swing high
Returns: Returns True if the current candle or the previous candle is a swing high
isSwingLow(period) Checks if the price has created new swing low over a period of time
Parameters:
period : The lookback time we want to check for swing low
Returns: Returns True if the current candle or the previous candle is a swing low
isDojiSwingHigh(period) Checks if a doji is a swing high over a period of time
Parameters:
period : The lookback time we want to check for swing high
Returns: Returns True if the doji is a swing high
isDojiSwingLow(period) Checks if a doji is a swing low over a period of time
Parameters:
period : The lookback time we want to check for swing low
Returns: Returns True if the doji is a swing low
isBigBody(atrFilter, atr, candleBodySize, multiplier) Checks if a candle has big body compared to ATR
Parameters:
atrFilter : Check if user wants to use ATR to filter candle-setup signals
atr : The ATR value to be used to compare candle body size
candleBodySize : The candle body size
multiplier : The multiplier to be used to compare candle body size
Returns: Returns Boolean true if the candle setup is big
isSmallBody(atrFilter, atr, candleBodySize, multiplier) Checks if a candle has small body compared to ATR
Parameters:
atrFilter : Check if user wants to use ATR to filter candle-setup signals
atr : The ATR value to be used to compare candle body size
candleBodySize : The candle body size
multiplier : The multiplier to be used to compare candle body size
Returns: Returns Boolean true if the candle setup is small
isHammer(fibLevel, colorMatch) Checks if a candle is a hammer based on user input parameters and candle conditions
Parameters:
fibLevel : Fib level to base candle body on
colorMatch : Checks if user needs for the candel to be green
Returns: Returns Boolean - True if the candle setup is hammer
isShootingStar(fibLevel, colorMatch) Checks if a candle is a shooting star based on user input parameters and candle conditions
Parameters:
fibLevel : Fib level to base candle body on
colorMatch : Checks if user needs for the candel to be red
Returns: Returns Boolean - True if the candle setup is star
isBullEngCan(allowance, period) Check if a candle is a bullish engulfing candle
Parameters:
allowance : How many points the candle open is allowed to be off (To allow for gaps)
period : The lookback period for swing low check
Returns: Boolean - True only if the candle is a bullish engulfing candle
isBearEngCan(allowance, period) Check if a candle is a bearish engulfing candle
Parameters:
allowance : How many points the candle open is allowed to be off (To allow for gaps)
period : The lookback period for swing high check
Returns: Boolean - True only if the candle is a bearish engulfing candle
isBullDoji(maxSize, wickLimit, colorFilter) Check if a candle is a bullish doji candle
Parameters:
maxSize : Maximum candle body size as % of total candle size to be considered as doji
wickLimit : Maximum wick size of one wick compared to the other wick
colorFilter : Checks if the doji is green
Returns: Boolean - True if the candle is a bullish doji
isBearDoji(maxSize, wickLimit, colorFilter) Check if a candle is a bearish doji candle
Parameters:
maxSize : Maximum candle body size as % of total candle size to be considered as doji
wickLimit : Maximum wick size of one wick compared to the other wick
colorFilter : Checks if the doji is red
Returns: Boolean - True if the candle is a bearish doji
isBullOutBar() Check if a candle is a bullish outside bar
Returns: Boolean - True if the candle is a bullish outside bar
isInsideBar() Check if a candle is an inside bar
Returns: Returns Boolean - True if a candle is an inside bar

BE_CustomFx_LibraryLibrary "BE_CustomFx_Library"
A handful collection of regular functions, Custom Tools & Utility Functions could be used in regular Scripts. hope these functions can be understood by a non programmer like me too.
G_TextValOfNumber(ValueToConvert, RequiredDecimalPlaces, BeginingChar, EndChar) Function to return the String Value of Number with decimal precision with the prefix and suffix characters provided
Parameters:
ValueToConvert : = Number to Convert
RequiredDecimalPlaces : = No of Decimal values Required. supports to a max of 5 decimals else defaults to 2
BeginingChar : = Prefix character which is needed.
EndChar : = Suffix character which is needed.
Returns: Returns Out put with formated value of Given Number for the specified deicimal values with Prefix and suffix string
G_TradableValue(ValueToConvert, NeedCustomization, RequiredDecimalPlaces) Function to return the Tradable Value of Number
Parameters:
ValueToConvert : = Number to Convert
NeedCustomization : = set to 1 if you want to customize the decimal percision values. default is No customization needed, which provides output equalent to round_to_mintick
RequiredDecimalPlaces : = if NeedCustomization is set to 1 mention the decimal percision value required. max supported decimal is 5 else defaults to 2
Returns: Returns Out put with formated value of Given Number
G_TxtSizeForLables(SizeValue) Function to Get size Value for text values used in Lables
Parameters:
SizeValue : = auto, tiny, small, normal, large, huge. specify either of these values or default value Normal will be displayed as output
Returns: Returns Respective Text size
G_Reg_LineType(LineType) Function to Get Line Style Value for text values used in Lines
Parameters:
LineType : = 'solid (─)', 'dotted (┈)', 'dashed (╌)', 'arrow left (←)', 'arrow right (→)', 'arrows both (↔)' or default line style 'dotted (┈)' will be the output
Returns: Returns Respective Line style
G_ShapeTypeForLables(ShapeType) Function to Get Shape Style Value for text values used in plot shapes
Parameters:
ShapeType : = 'XCross', 'Cross', 'Triangle Up', 'Triangle Down', 'Flag', 'Circle','Arrow Up', 'Arrow Down','Lable Up', 'Lable Down' or default shpae style Triangle Up will be the output
Returns: Returns Respective Shape style
G_Indicator_Val(string, float, int, int) Gets Output of the technical analyis indicator which has length Parameter. RSI, ATR, EMA, SMA, HMA, WMA, VWMA, 'CMO', 'MOM', 'ROC','VWAP'
Parameters:
string : IndicatorName to be specified
float : SrcVal for the TA indicator default is close
int : Length for the TA indicator
int : DecimalValue optional to specify if required formatted output with decimal percision
Returns: Value with the given parameters
G_CandleInfo(string, bool, float, bool) function to get Candle Informarion such as both wicksize, top wick size , bottom wick size, full candle size and body size in default points
Parameters:
string : WhatCandleInfo, string input with either of these options "Wick" , "TWick" , "BWick" , "Candle", "Body" , "BearfbVal", "BullfbVal" , "CandleOpen" ,"CandleClose", "CandleHigh" , "CandleLow", "BodyPct"
bool : RepaintingVersion, set to true if required data on the realtime bar else default is set to false
float : FibValueOfCandle, set the fibo value to extract fibvalue of the candle else default is set to 38.2%
bool : AccountforGaps, set to true if required data on considering the gap between previous and current bar else default is set to false
Returns: Returns Respective values for the candles
G_BullBearBarCount(int, int) Counts how many green & red bars have printed recently (ie. pullback count)
Parameters:
int : HowManyCandlesToCheck The lookback period to look back over
int : BullBear The color of the bar to count (1 = Bull, -1 = Bear), Open = close candles are ignored
Returns: The bar count of how many candles have retraced over the given lookback with specific candles
BarToStartYourCalculation(Int) function to get candle co-ordinate in order to use it further for calculating your analysis work . "Heart full Thanks to 3 Pine motivators (LonesomeTheBlue, Myank & Sriki) who helped me cracking this logic"
Parameters:
Int : SelectedCandleNumber (default=450) How many candles you would need to anlysie in your script from the right.
Returns: A boolean - output is returned to say the starting point and continue to diplay true for the future candles
isHammer(float, bool, bool) Checks if the current bar is a hammer candle based on the given parameters
Parameters:
float : fib (default=0.382) The fib to base candle body on
bool : colorMatch (default=false) Does the candle need to be green? (true/false)
bool : NeedRepainting (default=false) Specify True if you need them to calculate on the realtime bars
Returns: A boolean - true if the current bar matches the requirements of a hammer candle
isStar(float, bool, bool) Checks if the current bar is a shooting star candle based on the given parameters
Parameters:
float : fib (default=0.382) The fib to base candle body on
bool : colorMatch (default=false) Does the candle need to be red? (true/false)
bool : NeedRepainting (default=false) Specify True if you need them to calculate on the realtime bars
Returns: A boolean - true if the current bar matches the requirements of a shooting star candle
isDoji(float, float, bool) Checks if the current bar is a doji candle based on the given parameters
Parameters:
float : _wickSize (default=1.5 times) The maximum allowed times can be top wick size compared to the bottom (and vice versa)
float : _bodySize (default= 5 percent to be mentioned as 0.05) The maximum body size as a percentage compared to the entire candle size
bool : NeedRepainting (default=false) Specify true if you need them to calculate on the realtime bars
Returns: A boolean - true if the current bar matches the requirements of a doji candle
isBullishEC(float, float, bool, bool) Checks if the current bar is a bullish engulfing candle
Parameters:
float : _allowance (default=0) How many POINTS to allow the open to be off by (useful for markets with micro gaps)
float : _rejectionWickSize (default=disabled) The maximum rejection wick size compared to the body as a percentage
bool : _engulfWick (default=false) Does the engulfing candle require the wick to be engulfed as well?
bool : NeedRepainting (default=false) Specify True if you need them to calculate on the realtime bars
Returns: A boolean - true if the current bar matches the requirements of a bullish engulfing candle
isBearishEC(float, float, bool, bool) Checks if the current bar is a bearish engulfing candle
Parameters:
float : _allowance (default=0) How many POINTS to allow the open to be off by (useful for markets with micro gaps)
float : _rejectionWickSize (default=disabled) The maximum rejection wick size compared to the body as a percentage
bool : _engulfWick (default=false) Does the engulfing candle require the wick to be engulfed as well?
bool : NeedRepainting (default=false) Specify True if you need them to calculate on the realtime bars
Returns: A boolean - true if the current bar matches the requirements of a bearish engulfing candle
Plot_TrendLineAtDegree(float, float, int, string, bool) helps you to plot the Trendlines based on the specified angle at the defined price to bar ratio
Parameters:
float : Degree (default=14) angle at which Trendline to be plot
float : price2bar_ratio (default=1e-10) The maximum rejection wick size compared to the body as a percentage
int : Bars2Plot (default=6) Does the engulfing candle require the wick to be engulfed as well?
string : LineStyle = 'solid (─)', 'dotted (┈)', 'dashed (╌)', 'arrow left (←)', 'arrow right (→)', 'arrows both (↔)' or default line style 'dotted (┈)' will be the output
bool : PlotOnOpen_Close (default=false) Specify True if you need them to calculate on the Open\Close Values
Returns: plot the Trendlines based on the specified angle at the defined price to bar ratio
Gap Absorption StrategyLike the nature, markets don't like the void, and this is something we can take advantage of by trading gaps on some markets.
This technique is well known, so I wanted to write a tiny script based on this strategy to get a bit more comfortable with it.
IMPORTANT: Default parameters wont give you good trades on every markets, you need to modify these parameters to see which proportions correspond to the stock you're trading.
This script triggers signals on predefined variation of a stock price after a gap, and allows its user to configure TP and SL prices corresponding to a specific percentage of this gap movement.
Note: We can observe that opening gaps are often the most interesting.
Options
Trigger: the price variation you want to trigger on (in % of the price)
Stop Loss : in % of the gap
Take profit : in % of the gap
A small table is displayed in the top right corner of the chart to give you TP/SL/Signal prices for each opportunity
SL (red line) and TP (green line) are also displayed on the chart when a signal is triggered
Information concerning the current opportunity is given at the bottom of the chart
Note: This script is based on the Gap-Size-Indicator that I published a few weeks ago.

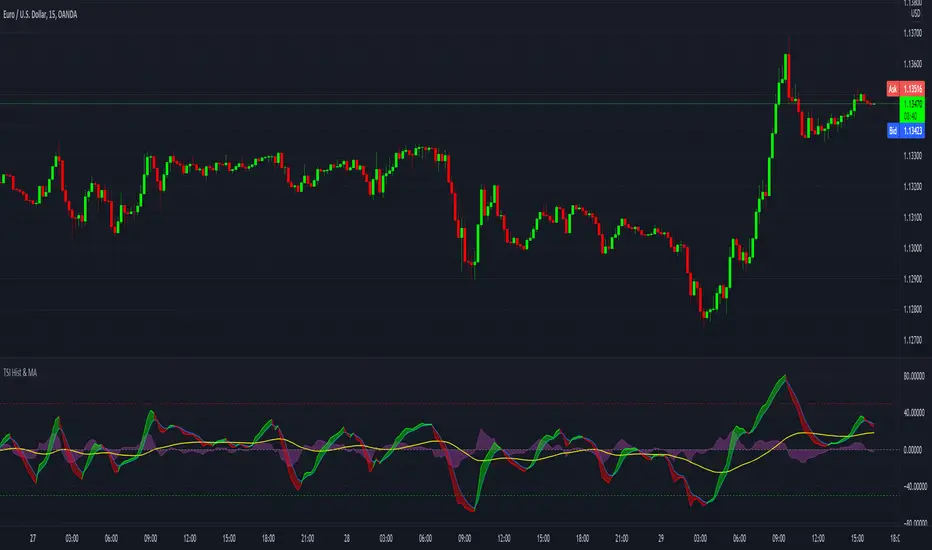
TSI with histogram and MA - SamXThis is an enhanced TSI. The others I've found on here have generally lacked sufficient settings context and/or alert definitions, so I made this version to address those gaps. In addition to that, I also added a way to plot a user-customizable moving average line of the TSI to better help identify trending conditions across TSI swings.
LeoLibraryLibrary "LeoLibrary"
A collection of custom tools & utility functions commonly used with my scripts
getDecimals() Calculates how many decimals are on the quote price of the current market
Returns: The current decimal places on the market quote price
truncate(float, float) Truncates (cuts) excess decimal places
Parameters:
float : _number The number to truncate
float : _decimalPlaces (default=2) The number of decimal places to truncate to
Returns: The given _number truncated to the given _decimalPlaces
toWhole(float) Converts pips into whole numbers
Parameters:
float : _number The pip number to convert into a whole number
Returns: The converted number
toPips(float) Converts whole numbers back into pips
Parameters:
float : _number The whole number to convert into pips
Returns: The converted number
av_getPositionSize(float, float, float, float) Calculates OANDA forex position size for AutoView based on the given parameters
Parameters:
float : _balance The account balance to use
float : _risk The risk percentage amount (as a whole number - eg. 1 = 1% risk)
float : _stopPoints The stop loss distance in POINTS (not pips)
float : _conversionRate The conversion rate of our account balance currency
Returns: The calculated position size (in units - only compatible with OANDA)
getMA(int, string) Gets a Moving Average based on type
Parameters:
int : _length The MA period
string : _maType The type of MA
Returns: A moving average with the given parameters
getEAP(float) Performs EAP stop loss size calculation (eg. ATR >= 20.0 and ATR < 30, returns 20)
Parameters:
float : _atr The given ATR to base the EAP SL calculation on
Returns: The EAP SL converted ATR size
barsAboveMA(int, float) Counts how many candles are above the MA
Parameters:
int : _lookback The lookback period to look back over
float : _ma The moving average to check
Returns: The bar count of how many recent bars are above the MA
barsBelowMA(int, float) Counts how many candles are below the MA
Parameters:
int : _lookback The lookback period to look back over
float : _ma The moving average to reference
Returns: The bar count of how many recent bars are below the EMA
barsCrossedMA(int, float) Counts how many times the EMA was crossed recently
Parameters:
int : _lookback The lookback period to look back over
float : _ma The moving average to reference
Returns: The bar count of how many times price recently crossed the EMA
getPullbackBarCount(int, int) Counts how many green & red bars have printed recently (ie. pullback count)
Parameters:
int : _lookback The lookback period to look back over
int : _direction The color of the bar to count (1 = Green, -1 = Red)
Returns: The bar count of how many candles have retraced over the given lookback & direction
getBodySize() Gets the current candle's body size (in POINTS, divide by 10 to get pips)
Returns: The current candle's body size in POINTS
getTopWickSize() Gets the current candle's top wick size (in POINTS, divide by 10 to get pips)
Returns: The current candle's top wick size in POINTS
getBottomWickSize() Gets the current candle's bottom wick size (in POINTS, divide by 10 to get pips)
Returns: The current candle's bottom wick size in POINTS
getBodyPercent() Gets the current candle's body size as a percentage of its entire size including its wicks
Returns: The current candle's body size percentage
isHammer(float, bool) Checks if the current bar is a hammer candle based on the given parameters
Parameters:
float : _fib (default=0.382) The fib to base candle body on
bool : _colorMatch (default=false) Does the candle need to be green? (true/false)
Returns: A boolean - true if the current bar matches the requirements of a hammer candle
isStar(float, bool) Checks if the current bar is a shooting star candle based on the given parameters
Parameters:
float : _fib (default=0.382) The fib to base candle body on
bool : _colorMatch (default=false) Does the candle need to be red? (true/false)
Returns: A boolean - true if the current bar matches the requirements of a shooting star candle
isDoji(float, bool) Checks if the current bar is a doji candle based on the given parameters
Parameters:
float : _wickSize (default=2) The maximum top wick size compared to the bottom (and vice versa)
bool : _bodySize (default=0.05) The maximum body size as a percentage compared to the entire candle size
Returns: A boolean - true if the current bar matches the requirements of a doji candle
isBullishEC(float, float, bool) Checks if the current bar is a bullish engulfing candle
Parameters:
float : _allowance (default=0) How many POINTS to allow the open to be off by (useful for markets with micro gaps)
float : _rejectionWickSize (default=disabled) The maximum rejection wick size compared to the body as a percentage
bool : _engulfWick (default=false) Does the engulfing candle require the wick to be engulfed as well?
Returns: A boolean - true if the current bar matches the requirements of a bullish engulfing candle
isBearishEC(float, float, bool) Checks if the current bar is a bearish engulfing candle
Parameters:
float : _allowance (default=0) How many POINTS to allow the open to be off by (useful for markets with micro gaps)
float : _rejectionWickSize (default=disabled) The maximum rejection wick size compared to the body as a percentage
bool : _engulfWick (default=false) Does the engulfing candle require the wick to be engulfed as well?
Returns: A boolean - true if the current bar matches the requirements of a bearish engulfing candle
timeFilter(string, bool) Determines if the current price bar falls inside the specified session
Parameters:
string : _sess The session to check
bool : _useFilter (default=false) Whether or not to actually use this filter
Returns: A boolean - true if the current bar falls within the given time session
dateFilter(int, int) Determines if this bar's time falls within date filter range
Parameters:
int : _startTime The UNIX date timestamp to begin searching from
int : _endTime the UNIX date timestamp to stop searching from
Returns: A boolean - true if the current bar falls within the given dates
dayFilter(bool, bool, bool, bool, bool, bool, bool) Checks if the current bar's day is in the list of given days to analyze
Parameters:
bool : _monday Should the script analyze this day? (true/false)
bool : _tuesday Should the script analyze this day? (true/false)
bool : _wednesday Should the script analyze this day? (true/false)
bool : _thursday Should the script analyze this day? (true/false)
bool : _friday Should the script analyze this day? (true/false)
bool : _saturday Should the script analyze this day? (true/false)
bool : _sunday Should the script analyze this day? (true/false)
Returns: A boolean - true if the current bar's day is one of the given days
atrFilter(float, float) Checks the current bar's size against the given ATR and max size
Parameters:
float : _atr (default=ATR 14 period) The given ATR to check
float : _maxSize The maximum ATR multiplier of the current candle
Returns: A boolean - true if the current bar's size is less than or equal to _atr x _maxSize
fillCell(table, int, int, string, string, color, color) This updates the given table's cell with the given values
Parameters:
table : _table The table ID to update
int : _column The column to update
int : _row The row to update
string : _title The title of this cell
string : _value The value of this cell
color : _bgcolor The background color of this cell
color : _txtcolor The text color of this cell
Returns: A boolean - true if the current bar falls within the given dates

ZenLibraryLibrary "ZenLibrary"
A collection of custom tools & utility functions commonly used with my scripts.
getDecimals() Calculates how many decimals are on the quote price of the current market
Returns: The current decimal places on the market quote price
truncate(float, float) Truncates (cuts) excess decimal places
Parameters:
float : _number The number to truncate
float : _decimalPlaces (default=2) The number of decimal places to truncate to
Returns: The given _number truncated to the given _decimalPlaces
toWhole(float) Converts pips into whole numbers
Parameters:
float : _number The pip number to convert into a whole number
Returns: The converted number
toPips(float) Converts whole numbers back into pips
Parameters:
float : _number The whole number to convert into pips
Returns: The converted number
av_getPositionSize(float, float, float, float) Calculates OANDA forex position size for AutoView based on the given parameters
Parameters:
float : _balance The account balance to use
float : _risk The risk percentage amount (as a whole number - eg. 1 = 1% risk)
float : _stopPoints The stop loss distance in POINTS (not pips)
float : _conversionRate The conversion rate of our account balance currency
Returns: The calculated position size (in units - only compatible with OANDA)
getMA(int, string) Gets a Moving Average based on type
Parameters:
int : _length The MA period
string : _maType The type of MA
Returns: A moving average with the given parameters
getEAP(float) Performs EAP stop loss size calculation (eg. ATR >= 20.0 and ATR < 30, returns 20)
Parameters:
float : _atr The given ATR to base the EAP SL calculation on
Returns: The EAP SL converted ATR size
barsAboveMA(int, float) Counts how many candles are above the MA
Parameters:
int : _lookback The lookback period to look back over
float : _ma The moving average to check
Returns: The bar count of how many recent bars are above the MA
barsBelowMA(int, float) Counts how many candles are below the MA
Parameters:
int : _lookback The lookback period to look back over
float : _ma The moving average to reference
Returns: The bar count of how many recent bars are below the EMA
barsCrossedMA(int, float) Counts how many times the EMA was crossed recently
Parameters:
int : _lookback The lookback period to look back over
float : _ma The moving average to reference
Returns: The bar count of how many times price recently crossed the EMA
getPullbackBarCount(int, int) Counts how many green & red bars have printed recently (ie. pullback count)
Parameters:
int : _lookback The lookback period to look back over
int : _direction The color of the bar to count (1 = Green, -1 = Red)
Returns: The bar count of how many candles have retraced over the given lookback & direction
getBodySize() Gets the current candle's body size (in POINTS, divide by 10 to get pips)
Returns: The current candle's body size in POINTS
getTopWickSize() Gets the current candle's top wick size (in POINTS, divide by 10 to get pips)
Returns: The current candle's top wick size in POINTS
getBottomWickSize() Gets the current candle's bottom wick size (in POINTS, divide by 10 to get pips)
Returns: The current candle's bottom wick size in POINTS
getBodyPercent() Gets the current candle's body size as a percentage of its entire size including its wicks
Returns: The current candle's body size percentage
isHammer(float, bool) Checks if the current bar is a hammer candle based on the given parameters
Parameters:
float : _fib (default=0.382) The fib to base candle body on
bool : _colorMatch (default=false) Does the candle need to be green? (true/false)
Returns: A boolean - true if the current bar matches the requirements of a hammer candle
isStar(float, bool) Checks if the current bar is a shooting star candle based on the given parameters
Parameters:
float : _fib (default=0.382) The fib to base candle body on
bool : _colorMatch (default=false) Does the candle need to be red? (true/false)
Returns: A boolean - true if the current bar matches the requirements of a shooting star candle
isDoji(float, bool) Checks if the current bar is a doji candle based on the given parameters
Parameters:
float : _wickSize (default=2) The maximum top wick size compared to the bottom (and vice versa)
bool : _bodySize (default=0.05) The maximum body size as a percentage compared to the entire candle size
Returns: A boolean - true if the current bar matches the requirements of a doji candle
isBullishEC(float, float, bool) Checks if the current bar is a bullish engulfing candle
Parameters:
float : _allowance (default=0) How many POINTS to allow the open to be off by (useful for markets with micro gaps)
float : _rejectionWickSize (default=disabled) The maximum rejection wick size compared to the body as a percentage
bool : _engulfWick (default=false) Does the engulfing candle require the wick to be engulfed as well?
Returns: A boolean - true if the current bar matches the requirements of a bullish engulfing candle
isBearishEC(float, float, bool) Checks if the current bar is a bearish engulfing candle
Parameters:
float : _allowance (default=0) How many POINTS to allow the open to be off by (useful for markets with micro gaps)
float : _rejectionWickSize (default=disabled) The maximum rejection wick size compared to the body as a percentage
bool : _engulfWick (default=false) Does the engulfing candle require the wick to be engulfed as well?
Returns: A boolean - true if the current bar matches the requirements of a bearish engulfing candle
timeFilter(string, bool) Determines if the current price bar falls inside the specified session
Parameters:
string : _sess The session to check
bool : _useFilter (default=false) Whether or not to actually use this filter
Returns: A boolean - true if the current bar falls within the given time session
dateFilter(int, int) Determines if this bar's time falls within date filter range
Parameters:
int : _startTime The UNIX date timestamp to begin searching from
int : _endTime the UNIX date timestamp to stop searching from
Returns: A boolean - true if the current bar falls within the given dates
dayFilter(bool, bool, bool, bool, bool, bool, bool) Checks if the current bar's day is in the list of given days to analyze
Parameters:
bool : _monday Should the script analyze this day? (true/false)
bool : _tuesday Should the script analyze this day? (true/false)
bool : _wednesday Should the script analyze this day? (true/false)
bool : _thursday Should the script analyze this day? (true/false)
bool : _friday Should the script analyze this day? (true/false)
bool : _saturday Should the script analyze this day? (true/false)
bool : _sunday Should the script analyze this day? (true/false)
Returns: A boolean - true if the current bar's day is one of the given days
atrFilter(float, float) Checks the current bar's size against the given ATR and max size
Parameters:
float : _atr (default=ATR 14 period) The given ATR to check
float : _maxSize The maximum ATR multiplier of the current candle
Returns: A boolean - true if the current bar's size is less than or equal to _atr x _maxSize
fillCell(table, int, int, string, string, color, color) This updates the given table's cell with the given values
Parameters:
table : _table The table ID to update
int : _column The column to update
int : _row The row to update
string : _title The title of this cell
string : _value The value of this cell
color : _bgcolor The background color of this cell
color : _txtcolor The text color of this cell
Returns: A boolean - true if the current bar falls within the given dates
Volume X-ray [LucF]█ OVERVIEW
This tool analyzes the relative size of volume reported on intraday vs EOD (end of day) data feeds on historical bars. If you use volume data to make trading decisions, it can help you improve your understanding of its nature and quality, which is especially important if you trade on intraday timeframes.
I often mention, when discussing volume analysis, how it's important for traders to understand the volume data they are using: where it originates, what it includes and does not include. By helping you spot sizeable differences between volume reported on intraday and EOD data feeds for any given instrument, "Volume X-ray" can point you to instruments where you might want to research the causes of the difference.
█ CONCEPTS
The information used to build a chart's historical bars originates from data providers (exchanges, brokers, etc.) who often maintain distinct historical feeds for intraday and EOD timeframes. How volume data is assembled for intraday and EOD feeds varies with instruments, brokers and exchanges. Variations between the two feeds — or their absence — can be due to how instruments are traded in a particular sector and/or the volume reporting policy for the feeds you are using. Instruments from crypto and forex markets, for example, will often display similar volume on both feeds. Stocks will often display variations because block trades or other types of trades may not be included in their intraday volume data. Futures will also typically display variations. It is even possible that volume from different feeds may not be of the same nature, as you can get trade volume (market volume) on one feed and tick volume (transaction counts) on another. You will sometimes be able to find the details of what different feeds contain from the technical information provided by exchanges/brokers on their feeds. This is an example for the NASDAQ feeds . Once you determine which feeds you are using, you can look for the reporting specs for that feed. This is all research you will need to do on your own; "Volume X-ray" will not help you with that part.
You may elect to forego the deep dive in feed information and simply rely on the figure the indicator will calculate for the instruments you trade. One simple — and unproven — way to interpret "Volume X-ray" values is to infer that instruments with larger percentages of intraday/EOD volume ratios are more "democratic" because at intraday timeframes, you are seeing a greater proportion of the actual traded volume for the instrument. This could conceivably lead one to conclude that such volume data is more reliable than on an instrument where intraday volume accounts for only 3% of EOD volume, let's say.
Note that as intraday vs EOD variations exist for historical bars on some instruments, there will typically also be differences between the realtime feeds used on intraday vs 1D or greater timeframes for those same assets. Realtime reporting rules will often be different from historical feed reporting rules, so variations between realtime feeds will often be different from the variations between historical feeds for the same instrument. A deep dive in reporting rules will quickly reveal what a jungle they are for some instruments, yet it is the only way to really understand the volume information our charts display.
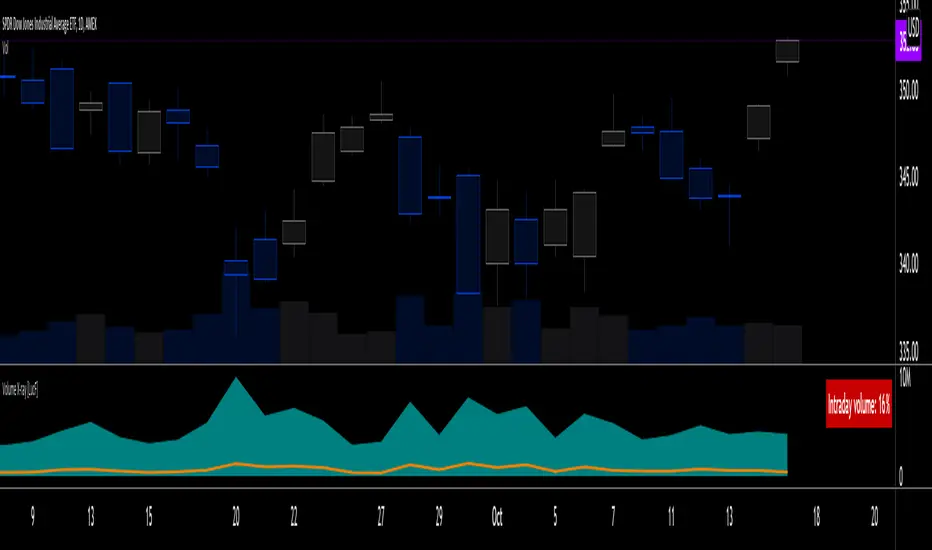
█ HOW TO USE IT
The script is very simple and has no inputs. Just add it to 1D charts and it will calculate the proportion of volume reported on the intraday feed over the EOD volume. The plots show the daily values for both volumes: the teal area is the EOD volume, the orange line is the intraday volume. A value representing the average, cumulative intraday/EOD volume percentage for the chart is displayed in the upper-right corner. Its background color changes with the percentage, with brightness levels proportional to the percentage for both the bull color (% >= 50) or the bear color (% < 50). When abnormal conditions are detected, such as missing volume of one kind or the other, a yellow background is used.
Daily and cumulative values are displayed in indicator values and the Data Window.
The indicator loads in a pane, but you can also use it in overlay mode by moving it on the chart with "Move to" in the script's "More" menu, and disabling the plot display from the "Settings/Style" tab.
█ LIMITATIONS
• The script will not run on timeframes >1D because it cannot produce useful values on them.
• The calculation of the cumulative average will vary on different intraday timeframes because of the varying number of days covered by the dataset.
Variations can also occur because of irregularities in reported volume data. That is the reason I recommend using it on 1D charts.
• The script only calculates on historical bars because in real time there is no distinction between intraday and EOD feeds.
• You will see plenty of special cases if you use the indicator on a variety of instruments:
• Some instruments have no intraday volume, while on others it's the opposite.
• Missing information will sometimes appear here and there on datasets.
• Some instruments have higher intraday than EOD volume.
Please do not ask me the reasons for these anomalies; it's your responsibility to find them. I supply a tool that will spot the anomalies for you — nothing more.
█ FOR PINE CODERS
• This script uses a little-known feature of request.security() , which allows us to specify `"1440"` for the `timeframe` argument.
When you do, data from the 1min intrabars of the historical intraday feed is aggregated over one day, as opposed to the usual EOD feed used with `"D"`.
• I use gaps on my request.security() calls. This is useful because at intraday timeframes I can cumulate non- na values only.
• I use fixnan() on some values. For those who don't know about it yet, it eliminates na values from a series, just like not using gaps will do in a request.security() call.
• I like how the new switch structure makes for more readable code than equivalent if structures.
• I wrote my script using the revised recommendations in the Style Guide from the Pine v5 User Manual.
• I use the new runtime.error() to throw an error when the script user tries to use a timeframe >1D.
Why? Because then, my request.security() calls would be returning values from the last 1D intrabar of the dilation of the, let's say, 1W chart bar.
This of course would be of no use whatsoever — and misleading. I encourage all Pine coders fetching HTF data to protect their script users in the same way.
As tool builders, it is our responsibility to shield unsuspecting users of our scripts from contexts where our calcs produce invalid results.
• While we're on the subject of accessing intrabar timeframes, I will add this to the intention of coders falling victim to what appears to be
a new misconception where the mere fact of using intrabar timeframes with request.security() is believed to provide some sort of edge.
This is a fallacy unless you are sending down functions specifically designed to mine values from request.security() 's intrabar context.
These coders do not seem to realize that:
• They are only retrieving information from the last intrabar of the chart bar.
• The already flawed behavior of their scripts on historical bars will not improve on realtime bars. It will actually worsen because in real time,
intrabars are not yet ordered sequentially as they are on historical bars.
• Alerts or strategy orders using intrabar information acquired through request.security() will be using flawed logic and data most of the time.
The situation reminds me of the mania where using Heikin-Ashi charts to backtest was all the rage because it produced magnificent — and flawed — results.
Trading is difficult enough when doing the right things; I hate to see traders infected by lethal beliefs.
Strive to sharpen your "herd immunity", as Lionel Shriver calls it. She also writes: "Be leery of orthodoxy. Hold back from shared cultural enthusiasms."
Be your own trader.
█ THANKS
This indicator would not exist without the invaluable insights from Tim, a member of the Pine team. Thanks Tim!
Gap RiderThis Indicator allows you to make statistics on the performance of any underlying on the days in which an opening gap occurs.
Specifically, the indicator was designed for "0 dte" options trades. In fact, it is possible to find parameters that give a good statistical advantage by opening a spread in the direction of the gap, creating a trade that has a risk-return ratio of 1: 1.
The indicator shows flags on the graph (green in case of gap up, red in case of gap down) and colored boxes (green in case the stock closed in the direction of the gap, red in case the stock closed in the opposite direction to the gap, yellow in the event that the stock closed at a distance that did not allow the spread in options to close in maximum loss or maximum profit, and therefore in breakeven)
The statistics panel, on the other hand, contains all the information necessary to search for parameters that give the trader a good statistical advantage.
In the settings you can filter the days of the week, only gap up or only gap down, ATR thresholds (volatility), points or minimum percentage for which a gap is taken into account, measure of the breakeven (which for options traders should represent the half the width of the spread to open), large gaps filter that takes into consideration only gaps that open out of range compared to the previous session. The Lookback parameter of course is used to set how many bars to take into account for the statistics.
Parameters and recommended strategy:
TODAY 31/08/2021 - Lookback 500 bars (2 years)
UNDERLYING: SPX
FILTERS: only Monday and Wednesday, only gap up, only gap> 0.01%
STRATEGY: exactly at opening, cover an ATM spread in the direction of the gap (example: gap up, I open a long call spread) that has the opening price as a break even, with a risk-return ratio of 1: 1 and leave it open until closing session, or set take profit at 90-95%. It is advisable to take into consideration the SPX statistics but to operate on the ES future so as to be able to open the spread a couple of minutes before the opening of the cash session and prevent the trade from "running away" due to too sudden movements of the opening. .
RESULTS:
124 Trade
70% profitable trades
30% losing trades
Max drawdown 3 trades
So assuming a spread on ES 10 points wide, each trade would gain or lose $ 250, applying the described strategy we would have in two years, investing only $ 250, a profit of $ 12500, with a max drawdown of $ 750. We would therefore have a profit of 5000%, or rather 2500% per year on the invested capital, with a drawdown of a much lower proportion of the profit ($ 750 compared to $ 6250 of annual profit).
The strategy is infinitely scalable by increasing the options contracts used and the impact of the commissions is almost zero.
MONEY MANAGEMENT: Example on a 50K account, with a spread that earns or loses $ 500, in two years it earns $ 25,000, therefore about 12500 per year, with a max drawdown of $ 1500, therefore 25% per year on the ENTIRE ACCOUNT with a maximum drawdown of 3%.
Note: the test was performed without a break even parameter, so the actual result will be more moderate, but of the same explosive nature.
** BUG STILL LOOKING FOR SOLUTION **
only in case the filters are set to take into account ONLY the gap down, the drawdown count in the statistics panel shows an incorrect result "

Alert(), alertcondition() or strategy alerts?Variety of possibilities offered by PineScript, especially thanks to recent additions, created some confusion. Especially one question repeats quite often - which method to use to trigger alerts?
I'm posting this to clarify and give some syntax examples. I'll discuss these 3 methods in chronological order, meaning - in the order they were introduced to PineScript.
ALERTCONDITION() - it is a function call, which can be used only in study-type script. Since years ago, you could create 2 types of a script: strategy and study. First one enables creating a backtest of a strategy. Second was to develop scripts which didn't require backtesting and could trigger alerts. alertcondition() calls in strategy-type scripts were rejected by Pine compiler. On the other hand compiling study-type scripts rejected all strategy...() calls. That created difficulties, because once you had a nice and backtested strategy, you had to rip it off from all strategy...() function calls to convert your script to study-type so you could produce alerts. Maintenance of two versions of each script was necessary and it was painful.
"STRATEGY ALERTS" were introduced because of alertcondition() pains. To create strategy alert, you need to click "Add alert" button inside Strategy Tester (backtester) and only there. Alerts set-up this way are bound with the backtester - whenever backtester triggers an order, which is visible on the chart, alert is also fired. And you can customize alert message using some placeholders like {{strategy.order.contracts}} or {{ticker}}.
ALERT() was added last. This is an alerts-triggering function call, which can be run from strategy-type script. Finally it is doable! You can connect it to any event coded in PineScript and generate any alert message you want, thanks to concatenation of strings and wrapping variables into tostring() function.
Out of these three alertcondition() is obviously archaic and probably will be discontinued. There is a chance this makes strategy/study distinction not making sense anymore, so I wouldn't be surprised if "studies" are deprecated at some point.
But what are the differences between "Strategy alerts" and alert()? "Strategy alerts" seem easier to set-up with just a few clicks and probably easier to understand and verify, because they go in sync with the backtester and on-chart trade markers. It is especially important to understand how they work if you're building strategy based on pending orders (stop and limit) - events in your code might trigger placing pending order, but alert will be triggered only (and when) such order is executed.
But "Strategy Alerts" have some limitations - not every variable you'd like to include in alert message is available from PineScript. And maybe you don't need the alert fired when the trade hit a stop-loss or take-profit, because you have already forwarded info about closing conditions in entry alert to your broker/exchange.
Alert() was added to PineScript to fill all these gaps. Is allows concatenating any alert message you want, with any variable you want inside it and you can attach alert() function at any event in your PineScript code. For example - when placing orders, crossing variables, exiting trades, but not explicitly at pending orders execution.
The Verdict
"Strategy Alerts" might seem a better fit - easier to set-up and verify, flexible and they fire only when a trade really happens, not producing unnecessary mess when each pending order is placed. But these advantages are illusionary, because they don't give you the full-control which is needed when trading with real money. Especially when using pending orders. If an alert is fired when price actually hit a stop-order or limit-order level, and even if you are executing such alert within 1 second thanks to a tool like TradingConnector, you might already be late and you are making entry at a market price. Slippage will play a great role here. You need to send ordering alert when logical conditions are met - then it will be executed at the price you want. Even if you need to cancel all the pending orders which were not executed. Because of that I strongly recommend sticking to ALERT() when building your alerts system.
Below is an example strategy, showing syntax to manage placing the orders and cancelling them. Yes, this is another spin-off from my TradingView Alerts to MT4 MT5 . As usual, please don't pay attention to backtest results, as this is educational script only.
P.S. For the last time - farewell alertcondition(). You served us well.

Repeated Median Regression ChannelThis script uses the Repeated Median (RM) estimator to construct a linear regression channel and thus offers an alternative to the available codes based on ordinary least squares.
The RM estimator is a robust linear regression algorithm. It was proposed by Siegel in 1982 (1) and has since found many applications in science and engineering for linear trend estimation and data filtering.
The key difference between RM and ordinary least squares methods is that the slope of the RM line is significantly less affected by data points that deviate strongly from the established trend. In statistics, these points are usually called outliers, while in the context of price data, they are associated with gaps, reversals, breaks from the trading range. Thus, robustness to outlier means that the nascent deviation from a predetermined trend will be more clearly seen in the RM regression compared to the least-squares estimate. For the same reason, the RM model is expected to better depict gaps and trend changes (2).
Input Description
Length : Determines the length of the regression line.
Channel Multiplier : Determines the channel width in units of root-mean-square deviation.
Show Channel : If switched off , only the (central) regression line is displayed.
Show Historical Broken Channel : If switched on , the channels that were broken in the past are displayed. Note that a certain historical broken channel is shown only when at least Length / 2 bars have passed since the last historical broken channel.
Print Slope : Displays the value of the current RM slope on the graph.
Method
Calculation of the RM regression line is done as follows (1,3):
For each sample point ( t (i), y (i)) with i = 1.. Length , the algorithm calculates the median of all the slopes of the lines connecting this point to the other Length -1 points.
The regression slope is defined as the median of the set of these median slopes.
The regression intercept is defined as the median of the set { y (i) – m * t (i)}.
Computational Time
The present implementation utilizes a brute-force algorithm for computing the RM-slope that takes O ( Length ^2) time. Therefore, the calculation of the historical broken channels might take a relatively long time (depending on the Length parameter). However, when the Show Historical Broken Channel option is off, only the real-time RM channel is calculated, and this is done quite fast.
References
1. A. F. Siegel (1982), Robust regression using repeated medians, Biometrika, 69 , 242–244.
2. P. L. Davies, R. Fried, and U. Gather (2004), Robust signal extraction for on-line monitoring data, Journal of Statistical Planning and Inference 122 , 65-78.
3. en.wikipedia.org

[BMAX] Averan BB(ENGLISH)
Averan is an indicator based on ADR, which shows the volatility of the market based on high-low prices on the selected timeframe. The difference between Averan and ATR is that Averan does not consider GAPs, so it basically consider the actual size of the candles.
This indicator also includes a standard deviation representation, the same as the top portion of the bollinger bands to present the variance of the volatility.
(PORTUGUÊS)
Averan é um indicador baseado no ADR, que apresenta a volatilidade do mercado baseado em máximas e mínimas do tempo gráfico escolhido. A diferença do Averan para o ATR é que o Averan não considera GAPs, portanto é basicamente calculado pelo real tamanho dos candles.
Este indicador também inclui a representação do desvio padrão, representado da mesma maneira que a banda superior do Bollinger Bands, apresentando portanto a variância da volatilidade.

scaled.orders [highwater]FOR EDUCATIONAL PURPOSES
There are multiple tools that allow you to place "scaled orders" on your exchange, namely Alertatron and Bybit Tools. This script is based on some Alertatron features, but you can use it for any grid like order placing strategy. Even if thats not your thing it's an example of how to use arrays in pinescript.
FROM PRICE - is the price to start your orders.
TO PRICE - is the price your orders will end.
SCALED TYPES :
LINEAR - will distribute orders evenly between from and to price.
EASE IN - will cluster orders closer to from price, then start to widen the gaps as you move closer to to price.
EASE OUT - will have wider gaps near from price, and start to cluster near to price.
EASE IN OUT - will cluster orders near both from price and to price.
COUNT - number of orders in each scaled order.

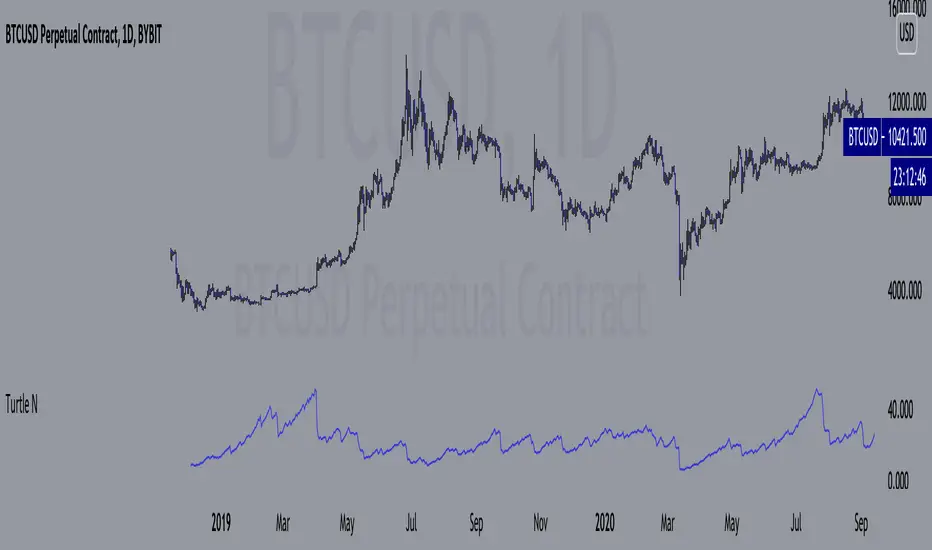
Volatility GuppyBased on my previous script "Turtle N Normalized," this script plots the CM SuperGuppy on the value of N to identify changing trends in the volatility of any instrument.
Turtle rules taken from an online PDF:
"The Turtles used a concept that Richard Dennis and Bill Eckhardt called N to represent the underlying volatility of a particular market.
N is simply the 20-day exponential moving average of the True Range, which is now more commonly known as the ATR. Conceptually, N represents the average range in price movement that a particular market makes in a single day, accounting for opening gaps. N was measured in the same points as the underlying contract.
The Turtles built positions in pieces which we called Units. Units were sized so that 1 N represented 1% of the account equity. Thus, a unit for a given market or commodity can be calculated using the following formula:
Unit = 1% of Account/(N x Dollars per Point)"
To normalize the Unit formula, this script instead takes the value of (close/N). Dollars per point = 1 for stocks and crypto, but will change depending on the contract specifications for individual futures .
"Since the Turtles used the Unit as the base measure for position size, and since those units were volatility risk adjusted, the Unit was a measure of both the risk of a position, and of the entire portfolio of positions."
When the EMA's are green, volatility is decreasing.
When the EMA's are red, volatility is increasing.
When the EMA's are grey, the trend is changing.

Turtle N NormalizedSimple script that calculates the normalized value of N. Rules taken from an online PDF containing the original Turtle system:
"The Turtles used a volatility-based constant percentage risk position sizing algorithm. The Turtles used a concept that Richard Dennis and Bill Eckhardt called N to represent the underlying volatility of a particular market.
N is simply the 20-day exponential moving average of the True Range, which is now more commonly known as the ATR. Conceptually, N represents the average range in price movement that a particular market makes in a single day, accounting for opening gaps. N was measured in the same points as the underlying contract.
The Turtles built positions in pieces which we called Units. Units were sized so that 1 N represented 1% of the account equity. Thus, a unit for a given market or commodity can be calculated using the following formula:
Unit = 1% of Account/(N x Dollars per Point)"
To normalize the Unit formula, this script instead takes the value of (close/N). Dollars per point = 1 for stocks and crypto, but will change depending on the contract specifications for individual futures.
"Since the Turtles used the Unit as the base measure for position size, and since those units were volatility risk adjusted, the Unit was a measure of both the risk of a position, and of the entire portfolio of positions."
When the value of N is high, volatility is low and you should be more risk-on.
When the value of N is low, volatility is high and you should be more risk-off.
Awesome Oscillator_VTX
Abbreviations:
AO - Awesome Oscillator
AC - Accelerator Oscillator
TP - TimePeriod (1m,2m,5m,1h....)
TP Steps - 1m,3m,12m,1h,5h,D (This steps i use)
Use-case:
Awesome Oscillator best used to find Divergence/Convergence what results in Weakening of Momentum and Price reversals.
This script calculates and plots AO/AC with minute precision, removing GAPS when projecting Higher Period AO/AC.
So you can accommodate all important information on one chart with best precision.
Made for Intraday Perioads.
Best used for DayTrading, when you need to make quick and efficient decisions.
Calculation = Preferred resolution * Length / Present resolution.
As Additional Function, this Awesome Oscillator has AC built in.
Settings:
Resolution - Most used TP included, plus some exclusive paid plans (1m, 2m, 3m, 5m, 12m, 15m, 1h, 4h, 5h, Daily). Default set to 1h
Use AO - You can switch between EMA and SMA for FastMA/SlowMA calculation. Default set to EMA
FastMA - standard function. Default set to 5
SlowMA - standard function. Default set to 34
Signal Line - Plots MA to show Momentum. Uses EMA/SMA based on "Use AO" selection. Default set to 5
Use AC - You can switch between EMA and SMA for AC calculation. Default set to SMA
Offset - standard function. Default set to 0
Accelerator - AC length. Default set to 5
Source - standard function. Default set to hlc3
Why to use it ?
Yes, i know that variable TP is standard now in TradingView. But there are some limitations, especially for DayTraders.
Problem:
Imagine you are trading/scalping on 1m.. 5m.. 15.. charts and you want to see where are your on Higher TP.
-- You can change to 1h and check it, but you will loose the picture from smaller TP.
-- You can use Standard TP function, but your data will update every 15m, 1h (depends on TP). And in result you have Gaps between bars.
Solution:
This script help to solve this problem, by breaking information down to 1m and building from there.
So whatever Intraday TP you choose to trade, your AO/AC will be updated with minute precision.
Limitations:
Sadly nothing without limitations.
1. For Best performance use only Higher TP dividable By Yours (ex. You use 3m chart, then you can plot 12m, 15m, 1h / You use 5m chart, then you can plot 15m, 1h. 12m will already have 3m of information lost using 5m Chart )

Kicker ScannerThe kicker pattern is deemed to be one of the most reliable reversal patterns and usually signifies a dramatic change in the fundamentals of the company in question.
It is a 2-candle pattern, whereby there is a significant gap between the body of the most recent candle and the previous candle.
A bullish kicker is one in which the most recent candle is bullish, and the previous candle is bearish.
A bearish kicker is one in which the most recent candle is bearish, and the previous candle is bullish.
I notice this works best for stocks, as there are many gaps in a stock chart. Currencies have few gaps, and thus few kickers.
From within the settings, you can set the minimum permitted gap between the two candles, specified in price, accurate to 6 decimal places; 0.000001.

Line breakI decided to help TradingView programmers and wrote code that converts a standard candles / bars to a line break chart. The built-in linebreak() and security() functions for constructing a Linear Break chart are bad, the chart is not built correctly, and does not correspond to the Line Breakout chart built into TradingView. I’m talking about simulating the Linear Break lines using the plotcandle() annotation, because these are the same candles without shadows. When you try to use the market simulator, when the gaps are turned on in the security() function, nothing is added to the chart, and when turned off, a completely different line break chart is drawn. Do not try to write strategies based on the built-in linebreak() function! The developers write in the manual: "Please note that you cannot plot Line Break boxes from Pine script exactly as they look. You can only get a series of numbers similar to OHLC values for Line Break charts and use them in your algorithms." However, it is possible to build a “Linear Breakthrough” chart exactly like the “Linear Breakthrough" chart built into TradingView. Personally, I had enough Pine Script functionality.
For a complete understanding of how such a graph is built, you can refer to Steve Nison's book “BEYOND JAPANESE CANDLES” and see the instructions for creating a “Three-Line Breakthrough” chart (the number of lines for a breakthrough is three):
Rule 1: if today's price is above the base price (closing the first candle), draw a white line from the base price to the new maximum price (before closing).
or Rule 2: if today's price is below the base price, draw a black line from the base price to the new low of prices (before closing).
Rule 3: if today's price is no different from the base, do not draw any line.
Rule 4: if today's price rises above the maximum of the first line, shift to the column to the right and draw a new white line from the previous maximum to the new maximum of prices.
Rule 5: if the price is below the low of the first line, move one column to the right and draw a new black line down from the previous low to the new low of prices.
Rule 6: if the price is kept in the range of the first line, nothing is applied to the chart.
Rule 7: if the market reaches a new maximum, surpassing the maximum of previous lines, move to the column to the right and draw a new white line up to a new maximum.
Rule 8: if today's price is below the low of previous lines (i.e. there is a new low), move to the right column and draw a new black line down to a new low.
Rule 9: if the price is in the range of the first two lines, nothing is applied to the chart.
Rule 10: if there is a series of three white lines, a new white line is drawn when a new maximum is reached (even if it is only one tick higher than the old one). Under the same conditions, for drawing a black reversal line, the price should fall below the minimum of the series of the last three white lines. Such a black line is called a black reversal line. It runs from the base of the highest white line to a new low of price.
Rule 11: if there is a series of three black lines, a new black line is drawn when a new minimum is reached. Under the same conditions, for drawing a white line, called a white reversal line, the price must exceed the maximum of the previous three black lines. This line is drawn from the top of the lowest black line to a new high of the price.
So, the script was not small, but the idea is extremely simple: if you need to break n lines to build a line, then among these n lines (or less, if this is the beginning of the chart), the maximum or minimum of closures and openings will be searched. If the current candles closed above or below these highs or lows, then a new line is added to the chart on the current candles (trend or breakout). According to my observations, this script draws a chart that is completely identical to the Line Breakout chart built into TradingView, but of course with gaps, as there is time in the candles / bar chart. I stuffed all the logic into a wrapper in the form of the get_linebreak() function, which returns a tuple of OHLC values. And these series with the help of the plotcandle() annotation can be converted to the "Linear Breakthrough" chart. I also want to note that with a large number of candles on the chart, outrages about the buffer size uncertainty are heard from the TradingView black box. Because of this, in the annotation study() set the value to the max_bars_back parameter.
In general, use it (for example, to write strategies)!
True Accumulation/DistributionAccumulation/Distribution is developed by Marc Chaikin to provide insight into strength of a trend by measuring flow of buy and sell volume.
The fact that A/D only factors current period's range for calculating the volume multiplier causes problem with price gaps. They are ignored or even misinterpreted.
True Accumulation/Distribution solves the problem by using True Range instead of only relying on current period's high and low.
In this example you can see when a gap has occurred in Amazon Inc.'s daily chart True A/D has handled it better than Accumulation/Distribution which a bearish close in period's range has caused it to misinterpret the strong buy pressure as sell volume.

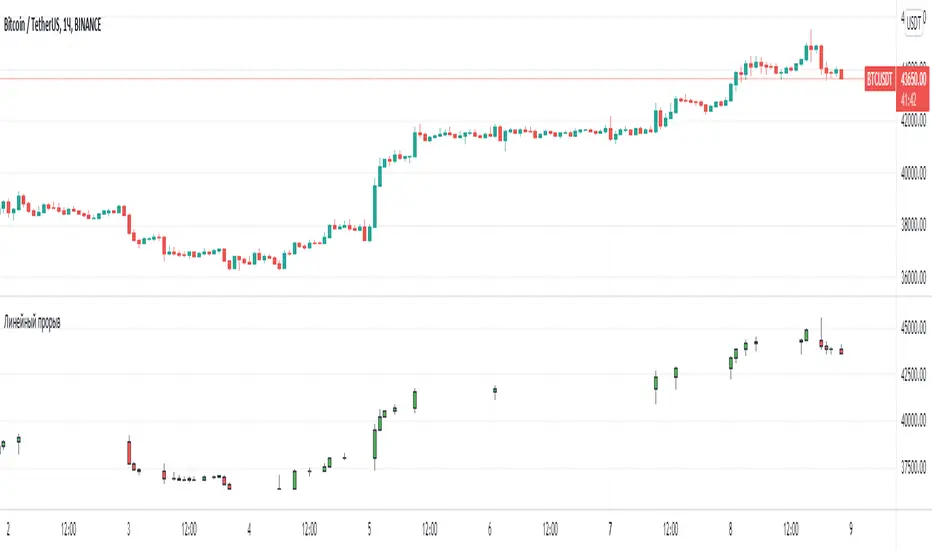
Grover Llorens Activator Strategy AnalysisThe Grover Llorens Activator is a trailing stop indicator deeply inspired by the parabolic SAR indicator, and aim to provide early exit points and reversal detection. The indicator was posted not so long ago, you can find it here :
Today a strategy using the indicator is proposed, and its profitability is analyzed on 3 different markets with the main time frame being 1 hour, remember that lower time frames involve lower absolute price changes, therefore we are way more affected by the spread, and we can require a larger position sizing depending on our investment target, trading higher time-frames is always a good practice and this is why 1 hour is selected. Based on the result we might make various conclusions regarding the indicator accuracy and might have ideas on future improvements of the indicator.
I'am not great when it comes to strategy design, i still hope to share correct and useful information in this post, let me know your thoughts on the post format and if i should make more of these.
Setup And Rules
The analysis is solely based on the indicator signals, money management isn't taken into account, this allow us to have an idea on the indicator robustness and resilience, particularly on extremely volatile markets and ones exhibiting a chaotic structure, altho it is normally good practice to close any position before a market closure in order to avoid any potential major gaps.
The settings used are 480 for length and 14 for mult, this create relatively mid term signals that are suited for a trend indicator such as the Grover Llorens Activator, unfortunately we can't infer the indicator optimal settings, thats how it is with any technical indicator anyway.
Here are the rules of our strategy :
long : closing price cross over the indicator
short : closing price cross under the indicator
We use constant position sizing, once a signal is triggered all the previous positions are closed.
Description Of The Statistics Used
Various statistics are presented in this post, here is a brief description of the main ones :
Percent Profitability (higher = better): Percentage of winning trades, that is : winning trades/total number of trades × 100
Maximum Drawdown (lower = better) : The highest difference between a peak and a valley in the balance, that is : peak - valley , in percentage : (peak - valley)/peak × 100
Profit Factor (higher = better) : Gross profit divided by gross loss, values under 1 represent gross losses superior to the gross profits
Remember that more volatility = more risk, since higher absolute price changes can logically cause larger losses.
EURUSD
The first market analyzed is the Forex market with the EURUSD major pair with a position sizing of 1000 units (1 micro lot). Since October EURUSD is not showing any particular strong trend but posses a discrete rising motion, fortunately cycles can be observed.
The equity was rising until two trades appeared causing a decline in the equity. Before October a bearish market could be observed.
We can see that the equity is rising, the trend still posses various retracements that affect our indicator, however we can see that the indicator totally nail the end of the trend, thats the power of converging toward the price.
In short :
$ 86.63 net profit
340 closed trades
37.65 % profitable (thats a lot of loosing trades)
1.19 profit factor
$ 76.67 max drawdown
Applying a spread would create negative results (in general the average spread is used), not a great start...
BTCUSD
The cryptocurrency market is relatively more volatile than others, which also mean potentially higher returns, we test the indicator using certainly the most traded cryptocurrency, BTCUSD. We will use a position sizing of 1 unit.
In the case of BTCUSD the strategy balance is relatively stationary around the initial capital, with of course high dispersion.
from september to december the market is bearish with various ranging periods, no apparent cycles can be observed, except maybe in the ranging period of october, this ranging period is followed by a non linear trend (relatively parabolic) that the indicator failed to capture in its integrity (this is a recurrent problem and it is starting to piss me off xD).
In short :
$ 2010.64 net profit (aka how i bet the crypto market)
395 closed trades
38.23 % profitable
1.036 profit factor
$ 5738.01 max drawdown (aka how i lost to the crypto market)
AMD
AMD stand for Advanced Micro Devices and is a company focused on the development of computer technology, i love the microprocessor market and i really like AMD who start this year in a pretty great way with a net bullish trend.
The performance of the indicator on AMD is decent (at last !) with the equity producing many new higher highs. The indicator performance still drop in the middle end of 2019 with a large equity drawdown of 17$ caused by the gap of august 8. Unfortunately AMD, like lot of well behaving stocks can only tells us that the indicator has good performances on heavily trending markets with no excess of noise or chaotic structures.
In short :
$ 17.86 net profit (Enough for a consistent lunch)
295 closed trades
36.27 % profitable
1.414 profit factor
$ 10.37 max drawdown.
Conclusion
A strategy using the recently proposed Grover Llorens activator has been presented. We can easily conclude that the indicator can't possibly generate long term returns under chaotic and volatile markets, and could even produce unnecessary trades in trending markets without much parasitic fluctuations such as noise and retracements (think about a simple linear trend) since the indicator converge toward the price and would therefore automatically cross over/under the trend, thus guaranteeing a false signal.
However we have seen its ability to provide accurate early reversal detection shine from time to time, thus over performing lagging indicators in this aspect, however the duration of price fluctuations isn't fixed at a certain period, the rate of convergence should be way faster during volatile fluctuations, of moderate speed during more cyclic fluctuations, and really slow with apparent long term trends, this could be achieved by making the indicator adaptive, but it won't really make it necessarily perform better.
That said i still believe that converging trend indicators are really interesting and aim to capture the non lasting behavior of price fluctuations, they shouldn't receive so much hate (think about the poor p-sar).
Thanks for reading !

Reflex & Trendflex█ OVERVIEW
Reflex and Trendflex are zero-lag oscillators that decompose price into independent cycle and trend components using SuperSmoother filtering. These indicators isolate each component separately, providing clearer identification of cyclical reversals (Reflex) versus trending movements (Trendflex).
Based on Dr. John F. Ehlers' "Reflex: A New Zero-Lag Indicator" article (February 2020, TASC), both oscillators use normalized slope deviation analysis to minimize lag while maintaining signal clarity. The SuperSmoother filter removes high-frequency noise, then deviations from linear regression (Reflex) or current value (Trendflex) are measured and normalized by RMS for consistent amplitude across instruments and timeframes.
█ CONCEPTS
SuperSmoother Filter
Both oscillators begin with a two-pole Butterworth low-pass filter that smooths price data without the excessive lag of simple moving averages. The filter uses exponential decay coefficients and cosine modulation based on the cutoff period, providing aggressive smoothing while preserving signal timing.
Reflex: Cycle Component
Reflex isolates cyclical price behavior by measuring deviation from a linear regression line fitted through the SuperSmoother output. For each bar, the filter calculates a linear slope over the lookback period, then sums how much the smoothed price deviates from this trendline. These deviations represent pure cyclical movement - price oscillations around the dominant trend. The result is normalized by RMS (root mean square) to produce consistent amplitude regardless of volatility or timeframe.
Trendflex: Trend Component
Trendflex extracts trending behavior by measuring cumulative deviation from the current SuperSmoother value. Instead of comparing to a regression line, it simply sums the differences between the current smoothed value and all past values in the period. This captures sustained directional movement rather than oscillations. Like Reflex, normalization by RMS ensures comparable readings across different instruments.
RMS Normalization
Both oscillators normalize their raw deviation measurements using an exponentially weighted RMS calculation: `rms = 0.04 * deviation² + 0.96 * rms `. This adaptive normalization ensures the oscillator amplitude remains stable as volatility changes, making threshold levels meaningful across different market conditions.
█ INTERPRETATION
Reflex (Cycle Component)
Oscillates around zero representing cyclical price behavior isolated from trend:
• Above zero : Price is in upward phase of cycle
• Below zero : Price is in downward phase of cycle
• Zero crossings : Potential cycle reversal points
• Extremes : Indicate stretched cyclical condition, often precede mean reversion
Best used for identifying cyclical turning points in ranging or oscillating markets. More sensitive to reversals than Trendflex.
Trendflex (Trend Component)
Oscillates around zero representing trending behavior isolated from cycles:
• Above zero : Sustained upward trend
• Below zero : Sustained downward trend
• Zero crossings : Trend direction changes
• Magnitude : Strength of trend (larger absolute values = stronger trend)
Best used for confirming trend direction and identifying trend exhaustion. Less noisy than Reflex due to focus on directional movement rather than oscillations.
Combined Analysis
Using both oscillators together provides powerful signal confirmation:
• Both positive: Strong uptrend with positive cycle phase (high probability long setup)
• Both negative: Strong downtrend with negative cycle phase (high probability short setup)
• Divergent signals: Conflicting cycle and trend (choppy conditions, reduce position size)
• Reflex reversal with Trendflex agreement: Cyclical turn within established trend (entry/exit timing)
Dynamic Thresholds
Threshold bands identify statistically significant oscillator readings that warrant attention:
• Breach above +threshold : Strong bullish cycle (Reflex) or trend (Trendflex) behavior - potential overbought condition
• Breach below -threshold : Strong bearish cycle or trend behavior - potential oversold condition
• Return inside thresholds : Signal strength normalizing, potential reversal or consolidation ahead
• Threshold compression : During low volatility, thresholds narrow (especially with StdDev mode), making breaches more frequent
• Threshold expansion : During high volatility, thresholds widen, filtering out minor oscillations
Combine threshold breaches with zero-line position for stronger signals:
• Threshold breach + zero-line cross = high-conviction signal
• Threshold breach without zero-line support = monitor for confirmation
Alert Conditions
Six built-in alerts trigger on bar close (no repainting):
• Above +Threshold : Oscillator crossed above positive threshold (strong bullish behavior)
• Below -Threshold : Oscillator crossed below negative threshold (strong bearish behavior)
• Reflex Above Zero : Reflex crossed above zero (bullish cycle phase)
• Reflex Below Zero : Reflex crossed below zero (bearish cycle phase)
• Trendflex Above Zero : Trendflex crossed above zero (bullish trend shift)
• Trendflex Below Zero : Trendflex crossed below zero (bearish trend shift)
█ SETTINGS & PARAMETER TUNING
Oscillator Settings
• Source : Price series to decompose
• Reflex Period (5-50): SuperSmoother period for cycle component. Lower values increase responsiveness to cyclical turns but add noise. Default 20.
• Trendflex Period (5-50): SuperSmoother period for trend component. Lower values respond faster to trend changes. Default 20.
Display Settings
• Reflex/Trendflex Display : Toggle visibility and customize colors for each oscillator independently
• Zero Line : Reference line showing neutral oscillator position
Dynamic Thresholds
Optional significance bands that identify when oscillator readings indicate strong cyclical or trending behavior:
• Threshold Mode : Choose calculation method based on market characteristics
- MAD (Median Absolute Deviation) : Outlier-resistant, best for markets with occasional spikes (default)
- Standard Deviation : Volatility-sensitive, adapts quickly to regime changes
- Percentile Rank : Fixed probability bands (e.g., 90% = only 10% of values exceed threshold)
• Apply To : Select which oscillator (Reflex or Trendflex) to calculate thresholds for
• Period (2-200): Lookback window for threshold calculation. Default 50.
• Multiplier (k) : Scaling factor for MAD/StdDev modes. Higher values = fewer threshold breaches (default 1.5)
• Percentile (%) : For Percentile mode only. Higher percentile = more selective threshold (default 90%)
Parameter Interactions
• Shorter periods make both oscillators more sensitive but noisier
• Reflex typically more volatile than Trendflex at same period settings
• For ranging markets: shorter Reflex period (10-15) captures swings better
• For trending markets: shorter Trendflex period (10-15) follows trend shifts faster
█ LIMITATIONS
Inherent Characteristics
• Near-zero lag, not zero-lag : Despite the name, some lag remains from SuperSmoother filtering
• Normalization artifacts : RMS normalization can produce unusual readings during volatility regime changes
• Period dependency : Oscillator characteristics change significantly with different period settings - no "correct" universal parameter
Market Conditions to Avoid
• Very low volatility : Normalization amplifies noise in quiet markets, producing false signals
• Sudden gaps : SuperSmoother assumes continuous data; large gaps disrupt filter continuity requiring bars to stabilize
• Micro timeframes : Sub-minute charts contain microstructure noise that overwhelms signal quality
Parameter Selection Pitfalls
• Matching periods to dominant cycle : If period doesn't align with actual market cycle period, signals degrade
• Threshold over-tuning : Optimizing threshold parameters for past data often fails forward - use conservative defaults
• Ignoring component differences : Reflex and Trendflex measure different aspects - don't expect identical behavior
█ NOTES
Credits
These indicators are based on Dr. John F. Ehlers' "Reflex: A New Zero-Lag Indicator" published in the February 2020 issue of Technical Analysis of Stocks & Commodities (TASC) magazine. The article introduces a novel approach to isolating cycle and trend components using SuperSmoother filtering combined with normalized deviation analysis.
For those interested in the underlying mathematics and DSP concepts:
• Ehlers, J.F. (February 2020). "Reflex: A New Zero-Lag Indicator" - Technical Analysis of Stocks & Commodities magazine
• Ehlers, J.F. (2001). Rocket Science for Traders: Digital Signal Processing Applications . John Wiley & Sons
• Various TASC articles by John Ehlers on SuperSmoother filters and oscillator design
by ♚@e2e4

GAP DETECTORGAP DETECTOR is an indicator displaying price gaps that have never been completely filled (only gaps >= 5 pips are considered).
Each gap is defined by two lines (the lower and upper bound of the gap), and a label giving information on its price range
#Parameters:
length: the number of candles being considered in the indicator (max is 3000).
width: the width of the gap lines.

[PX] VWAP Gap LevelHello guys,
another day, another method for detecting support and resistance level. This time it's all about the VWAP and daily gaps it might produce.
How does it work?
The indicator detects when a new daily candle begins and the VWAP makes a big move in either direction. Often it produces a gap and this is where the support or resistance level will be plotted. The idea behind it is, that those gaps get filled at some point in time. You can control how big a VWAP movement ("gap") has to be with the "VWAP Movement %" -setting. Also, you can adjust the style of the level.
If you find this indicator useful, please leave a "like" and hit that "follow" button :)
Have fun and happy trading :)))
