Fair Value Gap Profiles [AlgoAlpha]🟠 OVERVIEW
This script draws and manages Fair Value Gap (FVG) zones by detecting unfilled gaps in price action and then augmenting them with intra-gap volume profiles from a lower timeframe. It is designed to help traders find potential areas where price may return to fill liquidity voids, and to provide extra detail about volume distribution inside each gap to assess strength and likely mitigation. The script automatically tracks each gap, updates its state over time, and can show which gaps are still unfilled or have been mitigated.
🟠 CONCEPTS
A Fair Value Gap is a zone between candles where no trades occurred, often seen as an inefficiency that price later revisits. The script checks each bar to see if a bullish (low above 2-bars-ago high) or bearish (high below 2-bars-ago low) gap has formed, and measures whether the gap’s size exceeds a threshold defined by a volatility-adjusted multiplier of past gap widths (to only detect significantly large gaps). Once a qualified gap is found, it gets recorded and visualized with a box that can stretch forward in time until filled. To add more context, a mini volume profile is built from a lower timeframe’s price and volume data, showing how volume is distributed inside the gap. The lowest-volume subzone is also highlighted using a sliding window scan method to visualise the true gap (area with least trading activity)
🟠 FEATURES
Visual gap boxes that appear automatically when bullish or bearish fair value gaps are detected on the chart.
Color-coded zones showing bullish gaps in one color and bearish gaps in another so you can easily see which side the gap favors.
Volume profile histograms plotted inside each gap using data from a lower timeframe, helping you see where volume concentrated inside the gap area.
Highlight of the lowest-volume subzone within each gap so you can spot areas price may target when filling the gap.
Dynamic extension of the gap boxes across the chart until price comes back and fills them, marking them as mitigated.
Customizable colors and transparency settings for gap boxes, profiles, and low-volume highlights to match your chart style.
Alerts that notify you when a new gap is created or when price fills an existing gap.
🟠 USAGE
This indicator helps you find and track unfilled price gaps that often act as magnets for price to revisit. You can use it to spot areas where liquidity may rest and plan entries or exits around these zones.
The colored gap boxes show you exactly where a fair value gap starts and ends, so you can anticipate potential pullbacks or continuations when price approaches them.
The intra-gap volume profile lets you gauge whether the gap was created on strong or thin participation, which can help judge how likely it is to be filled. The highlighted lowest-volume subzone shows where price might accelerate once inside the gap.
Traders often look for entries when price returns to a gap, aiming for a reaction or reversal in that area. You can also combine the mitigation alerts with your trade management to track when gaps have been closed and adjust your bias accordingly. Overall, the tool gives a clear visual reference for imbalance zones that can help structure trades around supply and demand dynamics.
Cerca negli script per "liquidity"

First FVG📘 Indicator Description (English)
First FVG – NY Open is a TradingView indicator designed to automatically identify the first Fair Value Gap (FVG) that appears during the New York session, following the ICT (Inner Circle Trader) methodology.
It highlights institutional inefficiencies in price caused by imbalanced price action and helps traders spot high-probability entry zones, especially after the 9:30 AM EST (New York Open).
⚙️ How It Works
Session time: The indicator scans for FVGs starting at 9:32 AM (allowing 3 candles after the NY Open to form).
FVG Conditions:
Bullish FVG: When the high of 2 candles ago is lower than the low of the current candle and the middle candle is bullish.
Bearish FVG: When the low of 2 candles ago is higher than the high of the current candle and the middle candle is bearish.
Only the first FVG per session is drawn, as taught by ICT for setups like Judas Swing or NY Reversal models.
A colored box is drawn to represent the FVG zone.
A dotted horizontal line (CE) is drawn at the midpoint of the FVG box (Consequent Encroachment), a key level watched by smart money traders.
A dashed vertical line is drawn at 9:30 NY time to mark the open.
🧠 How to Use It
Wait for the NY Open (9:30 AM EST) – the indicator becomes active at 9:32 AM.
Watch for the first FVG box of the day. This is often a high-probability reaction zone.
Use the CE line (center of the FVG) as a reference for entries, rejections, or liquidity grabs.
Combine with market structure, PD Arrays, and liquidity concepts as taught by ICT for confluence.
The FVG box and CE line will extend forward for several candles for visual clarity.
🎛️ Customizable Settings
Session time (default: 09:32–16:00 NY)
FVG box color (up/down)
Text color
Max number of days to keep boxes on chart
Option to show or hide the 9:30 NY Open vertical line

Position Size Calculator with Fees# Position Size Calculator with Portfolio Management - Manual
## Overview
The Position Size Calculator with Portfolio Management is an advanced Pine Script indicator designed to help traders calculate optimal position sizes based on their total portfolio value and risk management strategy. This tool automatically calculates your risk amount based on portfolio allocation percentages and determines the exact position size needed while accounting for trading fees.
## Key Features
- **Portfolio-Based Risk Management**: Calculates risk based on total portfolio value
- **Tiered Risk Allocation**: Separates trading allocation from total portfolio
- **Automatic Trade Direction Detection**: Determines long/short based on entry vs stop loss
- **Fee Integration**: Accounts for trading fees in position size calculations
- **Risk Factor Adjustment**: Allows scaling of position size up or down
- **Visual Display**: Shows all calculations in a clear, color-coded table
- **Automatic Risk Calculation**: No need to manually input risk amount
## Input Parameters
### Total Portfolio ($)
- **Purpose**: The total value of your investment portfolio
- **Default**: 0.0
- **Range**: Any positive value
- **Step**: 0.01
- **Example**: If your total portfolio is worth $100,000, enter 100000
### Trading Portfolio Allocation (%)
- **Purpose**: The percentage of your total portfolio allocated to active trading
- **Default**: 20.0%
- **Range**: 0.0% to 100.0%
- **Step**: 0.01
- **Example**: If you allocate 20% of your portfolio to trading, enter 20
### Risk from Trading (%)
- **Purpose**: The percentage of your trading allocation you're willing to risk per trade
- **Default**: 0.1%
- **Range**: Any positive value
- **Step**: 0.01
- **Example**: If you risk 0.1% of your trading allocation per trade, enter 0.1
### Entry Price ($)
- **Purpose**: The price at which you plan to enter the trade
- **Default**: 0.0
- **Range**: Any positive value
- **Step**: 0.01
### Stop Loss ($)
- **Purpose**: The price at which you will exit if the trade goes against you
- **Default**: 0.0
- **Range**: Any positive value
- **Step**: 0.01
### Risk Factor
- **Purpose**: A multiplier to scale your position size up or down
- **Default**: 1.0 (no scaling)
- **Range**: 0.0 to 10.0
- **Step**: 0.1
- **Examples**:
- 1.0 = Normal position size
- 2.0 = Double the position size
- 0.5 = Half the position size
### Fee (%)
- **Purpose**: The percentage fee charged per transaction
- **Default**: 0.01% (0.01)
- **Range**: 0.0% to 1.0%
- **Step**: 0.001
## How Risk Amount is Calculated
The script automatically calculates your risk amount using this formula:
```
Risk Amount = Total Portfolio × Trading Allocation (%) × Risk % ÷ 10,000
```
### Example Calculation:
- Total Portfolio: $100,000
- Trading Allocation: 20%
- Risk per Trade: 0.1%
**Risk Amount = $100,000 × 20 × 0.1 ÷ 10,000 = $20**
This means you would risk $20 per trade, which is 0.1% of your $20,000 trading allocation.
## Portfolio Structure Example
Let's say you have a $100,000 portfolio:
### Allocation Structure:
- **Total Portfolio**: $100,000
- **Trading Allocation (20%)**: $20,000
- **Long-term Investments (80%)**: $80,000
### Risk Management:
- **Risk per Trade (0.1% of trading)**: $20
- **Maximum trades at risk**: Could theoretically have 1,000 trades before risking entire trading allocation
## How Position Size is Calculated
### Trade Direction Detection
- **Long Trade**: Entry price > Stop loss price
- **Short Trade**: Entry price < Stop loss price
### Position Size Formulas
#### For Long Trades:
```
Position Size = -Risk Factor × Risk Amount / (Stop Loss × (1 - Fee) - Entry Price × (1 + Fee))
```
#### For Short Trades:
```
Position Size = -Risk Factor × Risk Amount / (Entry Price × (1 - Fee) - Stop Loss × (1 + Fee))
```
## Output Display
The indicator displays a comprehensive table with color-coded sections:
### Portfolio Information (Light Blue Background)
- **Portfolio (USD)**: Your total portfolio value
- **Trading Portfolio Allocation (%)**: Percentage allocated to trading
- **Risk as % of Trading**: Risk percentage per trade
### Trade Setup (Gray Background)
- **Entry Price**: Your specified entry price
- **Stop Loss**: Your specified stop loss price
- **Fee (%)**: Trading fee percentage
- **Risk Factor**: Position size multiplier
### Risk Analysis (Red Background)
- **Risk Amount**: Automatically calculated dollar risk
- **Effective Entry**: Actual entry cost including fees
- **Effective Exit**: Actual exit value including fees
- **Expected Loss**: Calculated loss if stop loss is hit
- **Deviation from Risk %**: Accuracy of risk calculation
### Final Result (Blue Background)
- **Position Size**: Number of shares/units to trade
## Usage Examples
### Example 1: Conservative Long Trade
- **Total Portfolio**: $50,000
- **Trading Allocation**: 15%
- **Risk per Trade**: 0.05%
- **Entry Price**: $25.00
- **Stop Loss**: $24.00
- **Risk Factor**: 1.0
- **Fee**: 0.01%
**Calculated Risk Amount**: $50,000 × 15% × 0.05% ÷ 100 = $3.75
### Example 2: Aggressive Short Trade
- **Total Portfolio**: $200,000
- **Trading Allocation**: 30%
- **Risk per Trade**: 0.2%
- **Entry Price**: $150.00
- **Stop Loss**: $155.00
- **Risk Factor**: 2.0
- **Fee**: 0.01%
**Calculated Risk Amount**: $200,000 × 30% × 0.2% ÷ 100 = $120
**Actual Risk**: $120 × 2.0 = $240 (due to risk factor)
## Color Coding System
- **Green/Red Header**: Trade direction (Long/Short)
- **Light Blue**: Portfolio management parameters
- **Gray**: Trade setup parameters
- **Red**: Risk-related calculations and results
- **Blue**: Final position size result
## Best Practices
### Portfolio Management
1. **Keep trading allocation reasonable** (typically 10-30% of total portfolio)
2. **Use conservative risk percentages** (0.05-0.2% per trade)
3. **Don't risk more than you can afford to lose**
### Risk Management
1. **Start with small risk factors** (1.0 or less) until comfortable
2. **Monitor your total exposure** across all open positions
3. **Adjust risk based on market conditions**
### Trade Execution
1. **Always validate calculations** before placing trades
2. **Account for slippage** in volatile markets
3. **Consider position size relative to liquidity**
## Risk Management Guidelines
### Conservative Approach
- Trading Allocation: 10-20%
- Risk per Trade: 0.05-0.1%
- Risk Factor: 0.5-1.0
### Moderate Approach
- Trading Allocation: 20-30%
- Risk per Trade: 0.1-0.15%
- Risk Factor: 1.0-1.5
### Aggressive Approach
- Trading Allocation: 30-40%
- Risk per Trade: 0.15-0.25%
- Risk Factor: 1.5-2.0
## Troubleshooting
### Common Issues
1. **Position Size shows 0**
- Verify all portfolio inputs are greater than 0
- Check that entry price differs from stop loss
- Ensure calculated risk amount is positive
2. **Very small position sizes**
- Increase risk percentage or risk factor
- Check if your risk amount is too small for the price difference
3. **Large risk deviation**
- Normal for very small positions
- Consider adjusting entry/stop loss levels
### Validation Checklist
- Total portfolio value is realistic
- Trading allocation percentage makes sense
- Risk percentage is conservative
- Entry and stop loss prices are valid
- Trade direction matches your intention
## Advanced Features
### Risk Factor Usage
- **Scaling up**: Use risk factors > 1.0 for high-confidence trades
- **Scaling down**: Use risk factors < 1.0 for uncertain trades
- **Never exceed**: Risk factors that would risk more than your comfort level
### Multiple Timeframe Analysis
- Use different risk factors for different timeframes
- Consider correlation between positions
- Adjust trading allocation based on market conditions
## Disclaimer
This tool is for educational and planning purposes only. Always verify calculations manually and consider market conditions, liquidity, and correlation between positions. The automated risk calculation assumes you're comfortable with the mathematical relationship between portfolio allocation and individual trade risk. Past performance doesn't guarantee future results, and all trading involves risk of loss.

Fair Value Gap [Custom]📌 FVG Indicator – Smart Money Concepts Tool
This script is based on Smart Money Concepts (SMC) and automatically detects and marks Fair Value Gaps (FVG) on the chart, helping traders identify unbalanced price areas left behind by institutional moves.
🧠 What is an FVG?
An FVG (Fair Value Gap) is the price gap formed when the market moves rapidly, leaving behind a candle range where no trading occurred — typically between Candle 1’s high and Candle 3’s low (in a three-candle pattern). These gaps often signal imbalance, created during structural breaks or liquidity grabs, and may act as retrace zones or entry points.
🛠 Features:
✅ Automatically detects and highlights FVG zones (high-low range)
✅ Differentiates between open (unfilled) and closed (filled) FVGs
✅ Adjustable timeframe settings (works best on 1H–4H charts)
✅ Option to toggle display of filled FVGs
✅ Great for identifying pullback entries, continuation zones, or reversal setups
💡 Recommended Use:
After BOS/CHoCH, watch for price to return to the FVG for entry
Combine with Order Blocks and liquidity zones for higher accuracy
Best used as part of an ICT or SMC-based trading system

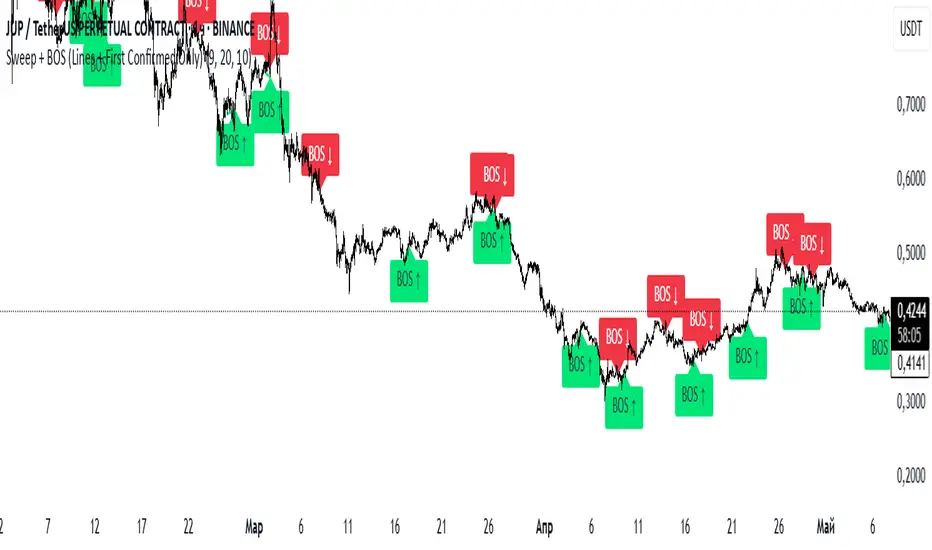
Sweep + BOS (Lines + First Confirmed Only)🔍 Indicator: Sweep + BOS (Break of Structure with Visual Lines)
🧠 Overview
This indicator combines Swing detection, Liquidity Sweeps, and Break of Structure (BOS) logic, with:
Customizable swing length,
BOS signals only after confirmed sweeps,
BOS shown only once per sweep,
Visual labels and connecting lines to highlight structure breaks clearly.
⚙️ Inputs
Swing Length:
Defines how many candles to use to identify a swing high/low. Must be an odd number (e.g., 3, 5, 7...).
Sweep Lookback Window:
Sets how far back the script checks for a sweep (false breakout over a swing).
BOS Validity After Sweep:
Number of bars within which a BOS can be considered valid after a sweep.
Toggle Options:
Show/hide:
Swing Labels
Sweep Labels
BOS Labels
BOS Connecting Lines
📌 Logic Breakdown
✅ Swings
Swing High: A candle’s high is greater than the highs of all N candles on both sides.
Swing Low: A candle’s low is lower than the lows of all N candles on both sides.
💧 Liquidity Sweeps
Sweep High:
Price spikes above a previous Swing High,
Then closes back below it (false breakout).
Sweep Low:
Price drops below a previous Swing Low,
Then closes back above it.
🔁 Break of Structure (BOS)
A BOS is only shown if:
It occurs after a valid sweep (within X bars),
It hasn’t been already plotted for that sweep,
BOS ↑ is only possible after Sweep Low,
BOS ↓ is only possible after Sweep High,
Opposite BOS type resets the last BOS state.
BOS ↑ (Bullish):
Confirmed when price closes above previous Swing High after Sweep Low.
Label appears at the candle low.
A line is drawn from the Swing Low to the BOS candle.
BOS ↓ (Bearish):
Confirmed when price closes below previous Swing Low after Sweep High.
Label appears at the candle high.
A line is drawn from the Swing High to the BOS candle.
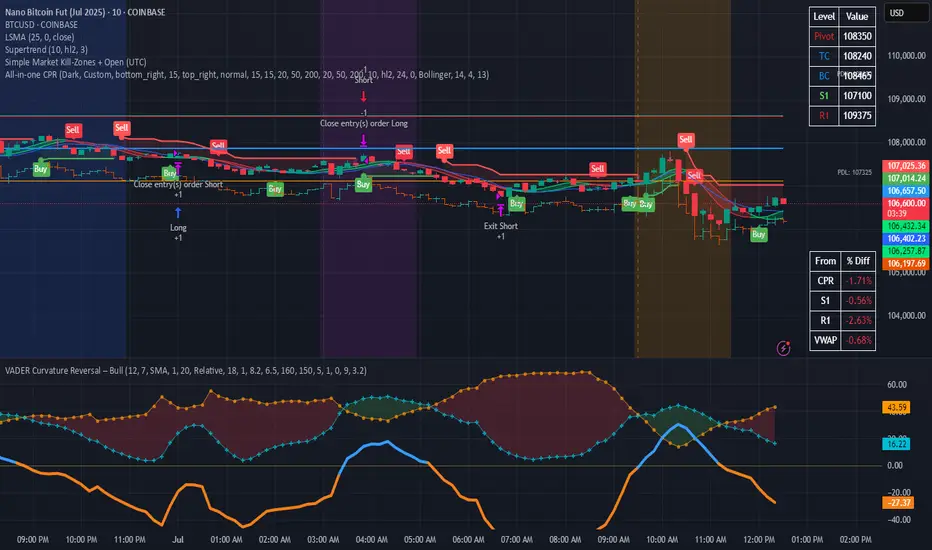
Simple Market Kill-Zones + Open (UTC)What it does
This Pine v6 indicator highlights the “kill-zones” around the big session opens—Asian (23:00–03:00 UTC), London (07:00–09:00 UTC) and New York (13:30–15:30 UTC)—by reading each bar’s actual UTC timestamp. It also draws dashed vertical lines at exactly 23:00, 07:00 and 13:30 UTC, so you never miss the liquidity ramps. Because it uses raw UTC hours/minutes, it stays accurate even when exchanges pause (e.g. Nano-BTC’s daily halt) or your chart’s display timezone changes.
Key Inputs
Show Asia/London/NY Kill Zone – toggle each shaded band on/off
Zone Colors – pick your own semi-transparent hues
Show Session-Open Lines – enable dashed verticals at the exact open times
Line Colors – customize the line opacity and style
How to use
Apply on your favorite timeframe (15 min–1 h is a sweet spot).
Toggle the zones you care about and pick readable colors.
Use the dashed lines as entry triggers or as visual bookmarks.
In your own Pine strategies, wrap order logic with the zone booleans to only trade when liquidity’s alive.
Thursday High & Friday Low Breakout (Safe)This TradingView Pine Script indicator is designed to help traders visually track two key situational breakout patterns that occur across the Thursday–Monday trading window. Specifically, it detects:
Whether the high of Thursday has been taken out on Friday, and
Whether the low of Friday has been breached on Monday.
These conditions are based on commonly observed market behaviors where key highs and lows from the previous days often act as liquidity targets or decision points. By identifying these events, traders can better understand the unfolding market structure and anticipate potential follow-through or reversals.
The script stores Thursday's high and Friday's low at the close of each respective day and evaluates the breakout conditions in real-time as new bars are printed. When Friday’s price action exceeds Thursday’s high, an upward-pointing green triangle is plotted above the bar. Conversely, when Monday’s price breaks below Friday’s low, a red downward triangle is plotted below the bar.
Unlike scripts that rely on label.new (which can create compatibility issues on certain platforms or versions), this version uses plotshape() to ensure wide compatibility and reliable visual cues, even on older Pine Script environments. This makes it lightweight, robust, and ideal for traders who want a quick-glance tool without cluttering their charts.
The indicator is best used on 1H, 4H, or daily timeframes to clearly observe the Thursday–Friday–Monday structure. It works well in both trending and consolidating markets as a tool to mark potential liquidity sweeps or break-of-structure setups.

OPR Asia-New-York [Elykia]This Pine Script indicator, called "OPR Asia-New-York ", displays time-based boxes corresponding to two specific trading periods known as OPR (Opening Price Range):
🎯 Purpose of the Indicator:
To visualize two key market time windows (morning and afternoon) as extended boxes, helping with technical analysis around opening ranges.
🕒 Two sessions displayed as boxes:
🔹 Morning OPR:
Default: from 09:00 to 09:15 (configurable)
The box extends until 10:30.
It captures the highest and lowest candle within this interval.
🔸 Afternoon OPR:
Default: from 15:30 to 15:45
The box extends until 17:30.
Follows the same logic as the morning session.
⚙️ Dashboard Options:
Enable or disable the morning or afternoon box individually
Select the timezone (e.g., GMT+2)
Customize all colors (morning/afternoon boxes, median line)
Set your own start/end/extension times for each session
📦 Each box includes:
A colored rectangle showing the price range (high/low)
A dotted median line between the high and low
The box and line extend until the end time defined
🧠 Usefulness for Traders:
Identify liquidity zones or consolidation areas
Trade setups like liquidity grabs, breakouts, or fakeouts around the OPR
Align with ICT methods or scalping strategies based on session behavior

OI Bahavior MapThis indicator visualizes Open Interest (OI) changes for Binance Futures and highlights the behavior of market participants — whether takers or makers are opening or closing positions.
📊 Supported display modes:
• Taker or Maker
• Longs or Shorts
• Cumulative or Per-Bar
• Displayed in USD or Coins
💡 Each candle color reflects the dominant trade direction (delta):
🟢 Green = Aggressive buying (Delta Buy)
🔴 Red = Aggressive selling (Delta Sell)
OI direction (↑/↓) determines whether positions are being opened or closed.
🛠️ Optional metrics:
• Moving average of OI (SMA, EMA, WMA, VWMA, LSMA)
• Volatility channels (Bollinger Bands or Extremums)
⚙️ How it works:
• Fetches OI data from the SYMBOL_OI ticker (e.g., BTCUSDT_OI)
• Compares current OI with the previous bar
• Uses signed volume delta (close - open) to infer intent
• Classifies bar as open/close, long/short, taker/maker
• Displays the net effect as a colored candle on a secondary chart
🤔 How to interpret Taker and Maker?
• Taker: The aggressive participant who removes liquidity (initiates the trade)
• Maker: The passive participant who provides liquidity (places resting orders)
You can choose to display the same event from either the Taker or Maker perspective — the chart will look the same, but the interpretation changes.
🧠 Core Logic Mapping
```
🟢 Green: Taker Longs (Buy, OI↑) | Maker Shorts (Buy, OI↓)
🔴 Red: Taker Shorts (Sell, OI↑) | Maker Longs (Sell, OI↓)
```
⚠️ Limitations:
• Works only for Binance Futures
• Requires existence of SYMBOL_OI ticker on TradingView
• Represents approximate intent based on OI + volume behavior
💬 Open Source
The script is open for the community. Suggestions and feedback are welcome in the comments!
__________________________________________________________________________________
Этот индикатор визуализирует изменения открытого интереса (OI) для Binance Futures и показывает поведение участников рынка — открывают или закрывают позиции тейкеры или мейкеры.
📊 Доступные режимы отображения:
• Taker или Maker
• Longs или Shorts
• Кумулятивный или по бару
• В USD или в монетах
💡 Каждый цвет свечи отражает преобладающее направление сделок (дельта):
🟢 Зеленый = Агрессивные покупки (Delta Buy)
🔴 Красный = Агрессивные продажи (Delta Sell)
Направление OI (↑/↓) показывает, открываются или закрываются позиции.
🛠️ Дополнительные метрики:
• Скользящая средняя OI (SMA, EMA, WMA, VWMA, LSMA)
• Волатильностные каналы (Bollinger Bands или экстремумы)
⚙️ Как работает:
• Получает данные OI из тикера SYMBOL_OI (например, BTCUSDT_OI)
• Сравнивает текущий OI с предыдущим баром
• Использует направленную дельту объема (close - open) для определения намерения
• Классифицирует бар как открытие/закрытие, лонг/шорт, тейкер/мейкер
• Отображает итог в виде цветной свечи на дополнительном графике
🤔 Как интерпретировать Taker и Maker?
• Taker: Агрессивный участник, который изымает ликвидность (инициирует сделку)
• Maker: Пассивный участник, который создает ликвидность (выставляет лимитные заявки)
Вы можете выбрать отображение события с позиции тейкера или мейкера — график будет одинаковым, но смысл меняется.
🧠 Схема логики
```
🟢 Зеленый: Taker Longs (Покупка, OI↑) | Maker Shorts (Покупка, OI↓)
🔴 Красный: Taker Shorts (Продажа, OI↑) | Maker Longs (Продажа, OI↓)
```
⚠️ Ограничения:
• Работает только для Binance Futures
• Требуется наличие тикера SYMBOL_OI на TradingView
• Показывает приблизительное намерение на основе OI и дельты объема
💬 Open Source
Скрипт открыт для сообщества. Предложения и обратная связь приветствуются в комментариях!

True Close – Institutional Trading Sessions (Zeiierman)█ Overview
True Close – Institutional Trading Sessions (Zeiierman) is a professional-grade session mapping tool designed to help traders align with how institutions perceive the market’s true close. Unlike the textbook “daily close” used by retail traders, institutional desks often anchor their risk management, execution benchmarks, and exposure metrics to the first hour of the next session.
This indicator visualizes that logic directly on your chart — drawing session boxes, true close levels, and time-aligned labels across Sydney, Tokyo, London, and New York. It highlights the first hour of each session, projects the institutional closing price, and builds a live dashboard that tells you which sessions are active, which are in the critical opening phase, and what levels matter most right now.
More than just a visual tool, this indicator embeds institutional rhythm directly into your workflow — giving you a window into where big players finalize yesterday’s business, rebalance exposure, and execute delayed orders. It’s not just about painting sessions on your chart — it’s about adopting the mindset of those who truly move the market. Institutions don’t settle risk at the bell; they complete it in the next session. This tool lets you see that transition in real time, giving you an edge that goes beyond candles and indicators.
█ How It Works
⚪ Session Detection Engine
Each session is identified by its own time block (e.g., 09:00–17:30 for London). Once a session opens:
A full-session box is drawn to track its range.
The first hour is highlighted separately.
Once the first hour completes, the true close line is plotted, representing the price institutions often treat as the "real" close of the prior day.
⚪ Institutional True Close Logic
The script captures the close of the first hour, not the end of the day.
This line becomes a static reference across your chart, letting you visualize how price interacts with that institutional anchor:
Rejections from it show where yesterday's flow is respected.
Breaks through it may indicate that today's flows are rewriting the narrative.
⚪ Dynamic Dashboard Table
A live table appears in the corner of your screen, showing:
Each session's active status
Whether we’re inside the first hour
The current “true close” price if available
Each cell comes with advanced tooltips giving institutional context, flow dynamics, and market microstructure insights — from rebalancing spillovers to VWAP/TWAP lag effects.
█ How to Use
⚪ Use the First-Hour Line as Your Institutional Anchor
Treat it like the price level that big funds care about. Watch how the price behaves around level. Fades, re-tests, or continuation moves often occur as the market finishes recapping yesterday’s leftover orders.
⚪ Structure Entries Around the Session Context
Are you inside the first hour? Expect more volatility, more decisive flow. After the first session hour, expect fading liquidity as the market slows down and awaits the next session to open.
█ Settings
UTC Offset – Select your preferred time zone; all sessions adjust accordingly.
Session Toggles – Enable/disable Sydney, Tokyo, London, or NY.
Box Display Options – Show/hide session background, first-hour fill, borders.
True Close Line Controls – Enable line, label, and customize width & color.
Execution Hour Labels – Optional toggle for first-hour label placement.
-----------------
Disclaimer
The content provided in my scripts, indicators, ideas, algorithms, and systems is for educational and informational purposes only. It does not constitute financial advice, investment recommendations, or a solicitation to buy or sell any financial instruments. I will not accept liability for any loss or damage, including without limitation any loss of profit, which may arise directly or indirectly from the use of or reliance on such information.
All investments involve risk, and the past performance of a security, industry, sector, market, financial product, trading strategy, backtest, or individual's trading does not guarantee future results or returns. Investors are fully responsible for any investment decisions they make. Such decisions should be based solely on an evaluation of their financial circumstances, investment objectives, risk tolerance, and liquidity needs.

HTF Candle Display (Evolution FX)HTF Candle Display (Evolution FX)
WHAT IT DOES
This tool overlays a **higher timeframe candle** (like Daily or Weekly) directly on your current lower timeframe chart (like 5m, 15m, 1h). It visually anchors current price action within its broader market context, ideal for traders using multi-timeframe confluence, liquidity mapping, or High-Timeframe-Based decision-making.
KEY FEATURES
Timeframe selection : Choose any higher timeframe (HTF) to display (e.g., D, W, M).
Dynamic candle placement : Position the HTF candle overlay away from price action using distance presets: `Close`, `Near`, `Far`, `Very Far`.
Adjustable thickness : Choose candle body width via `Thin`, `Thick`, or `Thicker` styles.
Fully customisable visuals : Set custom colours for bullish and bearish candles, borders, wicks, and labels.
Highlight box (optional) : Display a semi-transparent box aligned to the HTF candle's real time span.
Label with live countdown : Optionally show a floating label with timeframe info and time remaining in the HTF candle.
Previous candle display : Toggle to show or hide the prior HTF candle for better comparison.
HOW TO USE IT
Select your HTF (e.g., Daily) from the input dropdown.
Use "Distance From Price Action" to shift the visual away from the candles for a cleaner layout.
Adjust "Candle Width" to visually match your preferences.
Optionally toggle:
- "Show Previous Candle"
- "Show Label"
- "Highlight Current Day Price Action Box"
Customise your **colour scheme** to match your charting setup.
Recommended to use on charts like `15m`, `1h`, or `4h` for best visual clarity.
USE CASES
HTF liquidity hunting
Bias framing via daily/weekly structure
Institutional-style trading models
Scalping with macro trend context

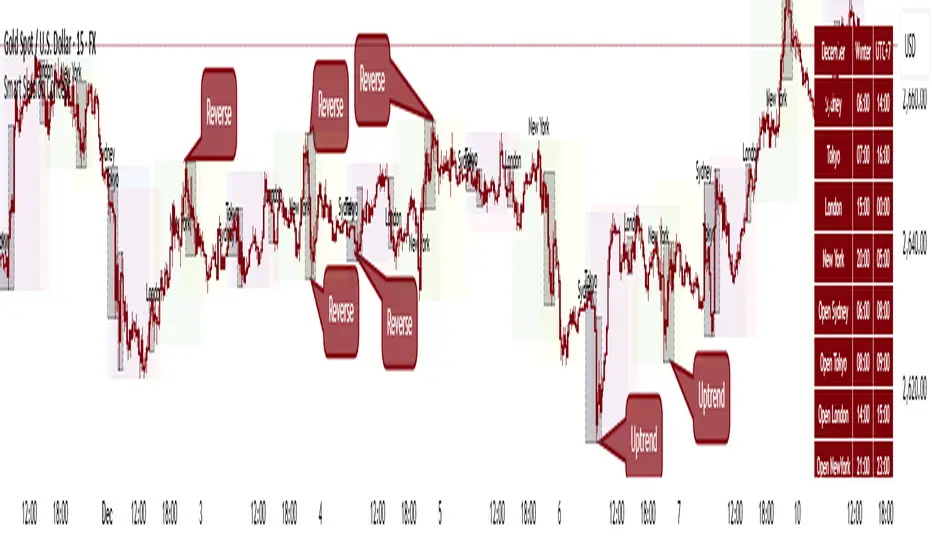
Smart Session ConceptSmart Session Concept — Intelligent Trading Session Overlay
Smart Session Concept is designed to detect major reversal points and key price pivots formed on higher timeframes, particularly during high-volume periods of the day — often marking the footprints of institutional orders and whales.
🔍 Key Features:
Displays standard sessions (Asian, London, New York) and allows adding custom time sessions.
Offers two visualization modes:
Time session table
Visual session boxes plotted on the chart
Auto-sync with seasonal time changes (Summer/Winter), supports Daylight Saving Time (DST)
Full flexibility:
Toggle table, boxes, and labels on/off
Customize colors for all session elements
Choose which months are considered summer/winter
💡 Suggested Use Case:
Use Smart Session Sync to pinpoint critical price structures such as:
Peaks and troughs of trending waves
Highs/lows in Wyckoff trading ranges
Liquidity sweeps or untouched liquidity zones
----------------------
BAFD (Price Action For D.....s)🧠 Overview
This indicator combines multiple Moving Averages (MA) with visual price action elements such as Fair Value Gaps (FVGs) and Swing Points. It provides traders with real-time insight into trend direction, structural breaks, and potential entry zones based on institutional price behavior.
⚙️ Features
1. Multi MA Visualization (SMA & EMA)
- Plots short-, mid-, and long-term moving averages
- Fully customizable: MA type (SMA/EMA) and length per MA
- Dynamic color coding: green for bullish, red for bearish (based on close >/< MA)
2. Fair Value Gaps (FVG) Detection
Detects bullish and bearish imbalances using multiple logic types:
- Same Type: Last 3 candles move in the same direction
- Twin Close: Last 2 candles close in the same direction
- All: Shows all valid FVGs regardless of pattern
Gaps are marked with semi-transparent yellow boxes
Useful for identifying potential liquidity voids and retest zones
3. Swing Highs and Lows
- Automatically identifies major swing points
- Customizable sensitivity (strength setting)
Marked with subtle colored dots for structure identification or support/resistance mapping
📈 Use Cases
- Trend Identification: Visualize momentum on multiple timeframes
- Liquidity Mapping: Spot potential retracement zones using FVGs
- Confluence Building: Combine MA slope, FVG zones, and swing points for refined setups
🛠️ Customizable Settings
- Moving average type and length for each MA
- FVG logic selection and color
- Swing point strength
🔔 Note
This script does not generate buy/sell signals or alerts. It is designed as a visual decision-support tool for discretionary traders who rely on market structure, trend, and price action.

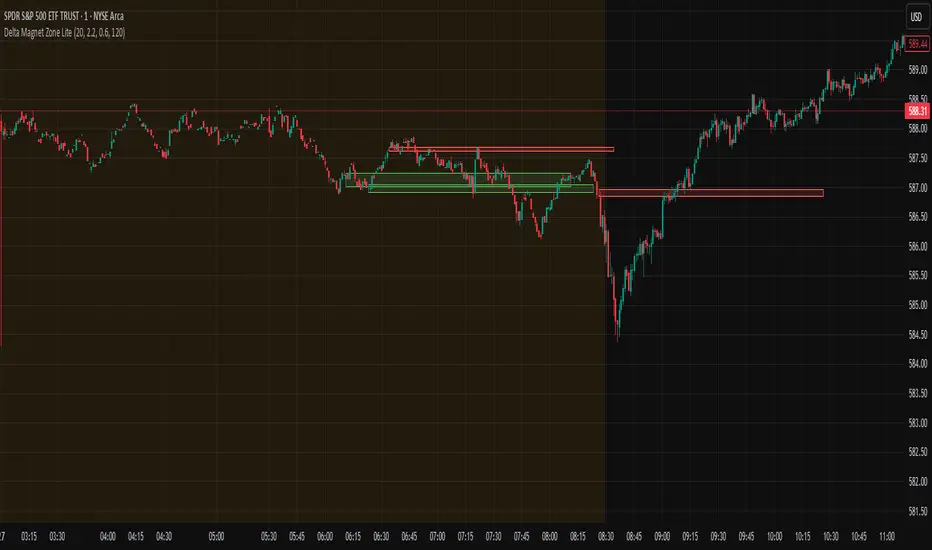
Delta Magnet Zone LiteDelta Magnet Zone Lite is exactly what it sounds like. It is areas where price cold potentially act as a magnet zone for price. Delta Magnet Zone Lite is a lightweight yet powerful visual tool that highlights potential liquidity traps and high-probability reversal zones based on volume spikes and wick imbalances. Designed for precision traders, this indicator visually marks key “magnet” zones where price may react, reverse, or consolidate due to prior aggressive buying or selling activity.
🔹 Core Logic:
Volume Spike Detection
Identifies candles with significantly higher volume than the moving average (customizable). These are likely areas of institutional interest or stop-hunt events.
Wick Ratio Analysis
Measures the size of the upper or lower wick relative to the total candle range. When combined with volume spikes, this helps detect:
Bullish Traps: Large lower wicks with strong buying volume
Bearish Traps: Large upper wicks with strong selling volume
Smart Zone Marking
When trap conditions are met, the script draws a semi-transparent colored box (green for bullish, red for bearish) that extends forward in time, highlighting a magnet zone—a price area likely to be retested or respected by future price action.
🛠 Customization Options:
Volume Spike Threshold
Adjust the multiplier for defining what qualifies as "high volume" relative to the average.
Wick Ratio Sensitivity
Fine-tune how extreme the wick size must be to qualify as a trap.
Zone Lifetime (Lookback)
Control how many bars each zone remains active on the chart.
Toggle Visibility
Turn bullish or bearish zones on/off independently for clean charting.
Ideal Use Cases:
Spotting hidden liquidity zones
Identifying exhaustion points in fast markets
Tracking institutional order imbalances
Enhancing confirmation for entry/exit signals
Whether you're trading intraday breakouts or swing-level reversals, Delta Magnet Zone Lite brings clarity to key reaction levels derived from raw price and volume behavior.
Time LevelsTime Levels is a customizable TradingView indicator designed to mark critical intraday price levels based on specific time inputs. This tool helps traders identify significant Open/High/Low/Close (OHLC) levels, support & resistance (S&R) zones, and potential Judas Swing manipulation points—aligned with selected timeframes and adjusted to any time zone via UTC offset.
🔧 Key Features:
OHLC/OLHC Levels: Automatically draws horizontal lines at the candle’s open price for up to four specified time points. Ideal for marking session opens, closes, or key intraday levels.
Support & Resistance Zones: Highlights two time-based S&R levels that can help identify discount and premium pricing zones.
Judas Swing Detection: Marks potential liquidity grab zones (Judas Swings) at three user-defined times, assisting in identifying manipulation and smart money entry points.
Global Timezone Support: Includes a UTC offset input to align levels accurately with your trading session, regardless of your location.
Full Customization: Personalize the color, style (solid, dashed, dotted), and thickness of each line independently for OHLC, S&R, and Judas levels.
🛠️ Use Cases:
New York / London open price tracking
ICT-based SMC level marking
Predefined time-based liquidity level visualizations
Institutional-level price reactions (e.g., during specific market opens)
This indicator is best suited for intraday and short-term (especially ICT) traders looking to bring precision and consistency into their technical analysis framework.

Dr Avinash Talele momentum indicaterTrend and Volatility Metrics
EMA10, EMA20, EMA50:
Show the percentage distance of the current price from the 10, 20, and 50-period Exponential Moving Averages.
Positive values indicate the price is above the moving average (bullish momentum).
Negative values indicate the price is below the moving average (bearish or corrective phase).
Use: Helps traders spot if a stock is extended or pulling back to support.
RVol (Relative Volume):
Compares current volume to the 20-day average.
Positive values mean higher-than-average trading activity (potential institutional interest).
Negative values mean lower activity (less conviction).
Use: High RVol often precedes strong moves.
ADR (Average Daily Range):
Shows the average daily price movement as a percentage.
Use: Higher ADR = more volatility = more trading opportunities.
50D Avg. Vol & 50D Avg. Vol ₹:
The 50-day average volume (in millions) and value traded (in crores).
Use: Confirms liquidity and suitability for larger trades.
ROC (Rate of Change) Section
1W, 1M, 3M, 6M, 12M:
Show the percentage price change over the last 1 week, 1 month, 3 months, 6 months, and 12 months.
Positive values (green) = uptrend, Negative values (red) = downtrend.
Use: Quickly see if the stock is gaining or losing momentum over different timeframes.
Momentum Section
1M, 3M, 6M:
Show the percentage gain from the lowest price in the last 1, 3, and 6 months.
Use: Measures how much the stock has bounced from recent lows, helping find strong rebounds or new leaders.
52-Week High/Low Section
From 52WH / From 52WL:
Show how far the current price is from its 52-week high and low, as a percentage.
Closer to 52WH = strong uptrend; Closer to 52WL = possible value or turnaround setup.
Use: Helps traders identify stocks breaking out to new highs or rebounding off lows.
U/D Ratio
U/D Ratio:
The ratio of up-volume to down-volume over the last 50 days.
Above 1 = more buying volume (bullish), Below 1 = more selling volume (bearish).
Use: Confirms accumulation or distribution.
How This Table Helps Analysts and Traders
Instant Trend Assessment:
With EMA distances and ROC, analysts can instantly see if the stock is trending, consolidating, or reversing.
Momentum Confirmation:
ROC and Momentum sections highlight stocks with strong recent moves, ideal for momentum and breakout traders.
Liquidity and Volatility Check:
Volume and ADR ensure the stock is tradable and has enough price movement to justify a trade.
Relative Positioning:
52-week high/low stats show whether the stock is near breakout levels or potential reversal zones.
Volume Confirmation:
RVol and U/D ratio help confirm if moves are backed by real buying/selling interest.
Actionable Insights:
By combining these metrics, traders can filter for stocks with strong trends, robust momentum, and institutional backing—ideal for swing, position, or even intraday trading.

FXC Candle strategyFxc candle strategy for Gold scalping.
Scalping is a fast-paced trading strategy focusing on capturing small, frequent price movements for incremental profits. High market liquidity and tight spreads are needed for scalping, minimizing execution risks. Scalpers should trade during peak liquidity to avoid slippage

SMC ICT – Simplified Daily Trend & Reversal AnalyzerThis Pine Script provides a simplified approach to analyzing daily trends and potential reversals using concepts inspired by Smart Money Concepts (SMC) and ICT (Inner Circle Trader).
What It Does:
• Detects daily uptrend and downtrend conditions by comparing the current daily high/low to the previous day’s values.
• Highlights potential bullish or bearish reversal zones when price behavior suggests a shift in sentiment.
• Automatically draws dashed lines for the previous day's high and low.
• Labels these high/low levels for quick visual reference.
How to Use:
Apply this indicator to any timeframe chart. Use the plotted trend markers to assess daily direction and potential reversal signals. The dashed lines (previous high/low) can be used as reference points for liquidity zones or break/retest entries.
User Interface:
The indicator displays labels and shapes in English. This script is intended for educational and trading workflow enhancement purposes.
Note:
This is an open-source tool designed for clarity and basic SMC/ICT application. It is best used in combination with other confluences like FVGs, order blocks, and liquidity sweeps.

Impulse Profile Zones [BigBeluga]🔵 OVERVIEW
Impulse Profile Zones is a volume-based tool designed to highlight high-impact candles and visualize hidden liquidity zones inside them using microstructure data. It’s ideal for identifying volume concentration and potential reaction points during impulsive market moves.
Whenever a candle exceeds a specified size threshold, this indicator captures its structure and overlays a detailed intrabar volume profile (from a 10x lower timeframe), allowing traders to analyze the distribution of interest within powerful market impulses.
🔵 CONCEPTS
Filters candles that exceed a user-defined threshold by size.
For qualifying candles, retrieves lower timeframe price and volume data.
Divides the candle’s body into 10 volume bins and calculates the volume per zone. Highlights the bin with the highest volume as the Point of Control (POC) .
Each POC line extends forward until a new impulse is detected.
🔵 FEATURES
Impulse Candle Detection:
Triggers only when a candle’s body size is larger than the defined threshold.
Lower Timeframe Profiling:
Aggregates 10-bin volume data from a lower timeframe (typically 1/10 of current TF).
Volume Distribution Bars:
Each bin displays a stylized bar using unicode block characters (e.g., ▇▇▇, ▇▇ or ▇--).
The bar size reflects the relative volume intensity.
POC Zone Mapping:
The bin with the highest volume is marked with a bold horizontal line.
Its value is labeled and extended until the next valid impulse.
🔵 HOW TO USE
Use large candle profiles to assess which price levels inside a move were most actively traded.
Watch the POC line as a magnet for future price interaction (support/resistance or reaction).
Combine with market structure or order block indicators to identify confluence levels.
Adjust the “Filter Large Candles” input to detect more or fewer events based on volatility.
🔵 CONCLUSION
Impulse Profile Zones is a hybrid microstructure tool that bridges lower timeframe volume with higher timeframe impulse candles. By revealing where most of the volume occurred inside large moves, traders gain a deeper view into hidden liquidity, enabling smarter trade entries and more confident profit-taking zones.

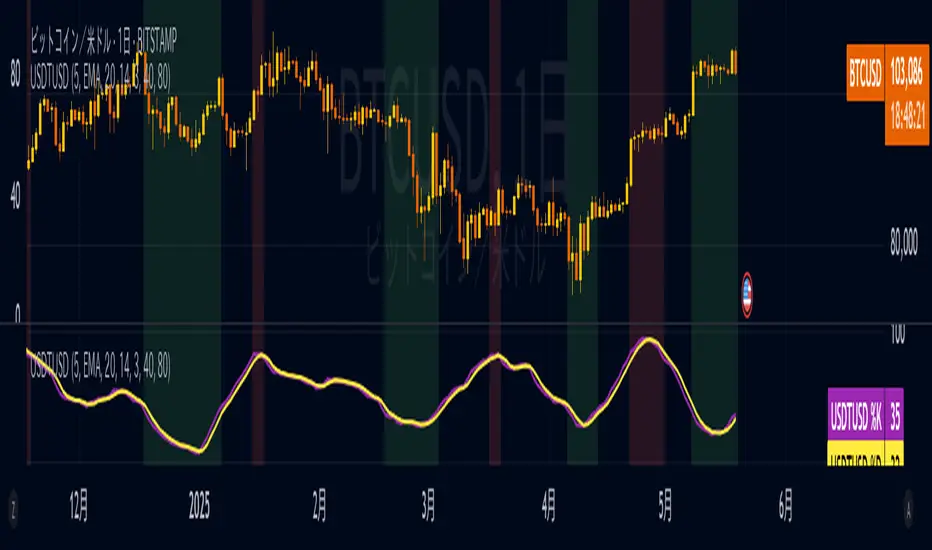
USDTUSD Stochastic RSI [SAKANE]Release Note
■ Overview
The USDTUSD Stochastic RSI indicator visualizes shifts in market sentiment and liquidity by applying the Stochastic RSI to the USDT/USD price pair.
Rather than tracking the price of Bitcoin directly, this tool observes the momentum of USDT, a key intermediary in most crypto transactions, to detect early signals of trend reversals.
■ Background & Motivation
USDT exhibits two distinct characteristics:
Its credibility as a long-term store of value is limited.
Yet, it serves as one of the most liquid assets in the crypto space and is widely used as a trading base pair.
Because most BTC trades involve converting fiat into USDT and vice versa, USDT/USD frequently deviates slightly from its peg to USD.
These deviations—though subtle—often occur just before major shifts in the broader crypto market.
This indicator is designed to detect such moments of structural imbalance by applying momentum analysis to USDT itself.
■ Feature Highlights
Calculates RSI and Stochastic RSI on the USDT/USD closing price
Supports customizable smoothing via SMA or EMA
Background shading dynamically visualizes overheated or cooled market states (thresholds are adjustable)
Displayed in a separate pane, keeping it visually distinct from the price chart
■ Usage Insights
This indicator is based on an observable pattern:
When the Stochastic RSI bottoms out, Bitcoin tends to form a price bottom shortly afterward
Conversely, when the indicator peaks, Bitcoin tends to top out with a slight delay
Since USDT acts as a gateway for capital in and out of the market, changes in its momentum often foreshadow turning points in BTC.
This allows traders to anticipate shifts in sentiment rather than merely reacting to them.
■ Unique Value Proposition
Unlike conventional price-based indicators, this tool offers a structural perspective.
It focuses on USDT as a mechanism of liquidity flow, making it possible to detect the "hidden rhythm" of the crypto market.
In that sense, this is not just a technical tool, but an entry point into market microstructure analysis—allowing users to read the market’s intentions rather than just its movements.
■ Practical Tips
Look for reversals in momentum as potential BTC entry or exit points.
Overlay this indicator with the BTC chart to compare timing and divergence.
Combine with other tools such as on-chain data or macro indicators for comprehensive analysis.
■ Final Thoughts
USDTUSD Stochastic RSI is designed with the belief that the most important market signals often come from what drives the price, not the price itself.
By tuning into the “heartbeat” of capital flow, this indicator sheds light on market dynamics that would otherwise remain unseen.
We hope it proves useful in your trading and research.
JPMorgan G7 Volatility IndexThe JPMorgan G7 Volatility Index: Scientific Analysis and Professional Applications
Introduction
The JPMorgan G7 Volatility Index (G7VOL) represents a sophisticated metric for monitoring currency market volatility across major developed economies. This indicator functions as an approximation of JPMorgan's proprietary volatility indices, providing traders and investors with a normalized measurement of cross-currency volatility conditions (Clark, 2019).
Theoretical Foundation
Currency volatility is fundamentally defined as "the statistical measure of the dispersion of returns for a given security or market index" (Hull, 2018, p.127). In the context of G7 currencies, this volatility measurement becomes particularly significant due to the economic importance of these nations, which collectively represent more than 50% of global nominal GDP (IMF, 2022).
According to Menkhoff et al. (2012, p.685), "currency volatility serves as a global risk factor that affects expected returns across different asset classes." This finding underscores the importance of monitoring G7 currency volatility as a proxy for global financial conditions.
Methodology
The G7VOL indicator employs a multi-step calculation process:
Individual volatility calculation for seven major currency pairs using standard deviation normalized by price (Lo, 2002)
- Weighted-average combination of these volatilities to form a composite index
- Normalization against historical bands to create a standardized scale
- Visual representation through dynamic coloring that reflects current market conditions
The mathematical foundation follows the volatility calculation methodology proposed by Bollerslev et al. (2018):
Volatility = σ(returns) / price × 100
Where σ represents standard deviation calculated over a specified timeframe, typically 20 periods as recommended by the Bank for International Settlements (BIS, 2020).
Professional Applications
Professional traders and institutional investors employ the G7VOL indicator in several key ways:
1. Risk Management Signaling
According to research by Adrian and Brunnermeier (2016), elevated currency volatility often precedes broader market stress. When the G7VOL breaches its high volatility threshold (typically 1.5 times the 100-period average), portfolio managers frequently reduce risk exposure across asset classes. As noted by Borio (2019, p.17), "currency volatility spikes have historically preceded equity market corrections by 2-7 trading days."
2. Counter-Cyclical Investment Strategy
Low G7 volatility periods (readings below the lower band) tend to coincide with what Shin (2017) describes as "risk-on" environments. Professional investors often use these signals to increase allocations to higher-beta assets and emerging markets. Campbell et al. (2021) found that G7 volatility in the lowest quintile historically preceded emerging market outperformance by an average of 3.7% over subsequent quarters.
3. Regime Identification
The normalized volatility framework enables identification of distinct market regimes:
- Readings above 1.0: Crisis/high volatility regime
- Readings between -0.5 and 0.5: Normal volatility regime
- Readings below -1.0: Unusually calm markets
According to Rey (2015), these regimes have significant implications for global monetary policy transmission mechanisms and cross-border capital flows.
Interpretation and Trading Applications
G7 currency volatility serves as a barometer for global financial conditions due to these currencies' centrality in international trade and reserve status. As noted by Gagnon and Ihrig (2021, p.423), "G7 currency volatility captures both trade-related uncertainty and broader financial market risk appetites."
Professional traders apply this indicator in multiple contexts:
- Leading indicator: Research from the Federal Reserve Board (Powell, 2020) suggests G7 volatility often leads VIX movements by 1-3 days, providing advance warning of broader market volatility.
- Correlation shifts: During periods of elevated G7 volatility, cross-asset correlations typically increase what Brunnermeier and Pedersen (2009) term "correlation breakdown during stress periods." This phenomenon informs portfolio diversification strategies.
- Carry trade timing: Currency carry strategies perform best during low volatility regimes as documented by Lustig et al. (2011). The G7VOL indicator provides objective thresholds for initiating or exiting such positions.
References
Adrian, T. and Brunnermeier, M.K. (2016) 'CoVaR', American Economic Review, 106(7), pp.1705-1741.
Bank for International Settlements (2020) Monitoring Volatility in Foreign Exchange Markets. BIS Quarterly Review, December 2020.
Bollerslev, T., Patton, A.J. and Quaedvlieg, R. (2018) 'Modeling and forecasting (un)reliable realized volatilities', Journal of Econometrics, 204(1), pp.112-130.
Borio, C. (2019) 'Monetary policy in the grip of a pincer movement', BIS Working Papers, No. 706.
Brunnermeier, M.K. and Pedersen, L.H. (2009) 'Market liquidity and funding liquidity', Review of Financial Studies, 22(6), pp.2201-2238.
Campbell, J.Y., Sunderam, A. and Viceira, L.M. (2021) 'Inflation Bets or Deflation Hedges? The Changing Risks of Nominal Bonds', Critical Finance Review, 10(2), pp.303-336.
Clark, J. (2019) 'Currency Volatility and Macro Fundamentals', JPMorgan Global FX Research Quarterly, Fall 2019.
Gagnon, J.E. and Ihrig, J. (2021) 'What drives foreign exchange markets?', International Finance, 24(3), pp.414-428.
Hull, J.C. (2018) Options, Futures, and Other Derivatives. 10th edn. London: Pearson.
International Monetary Fund (2022) World Economic Outlook Database. Washington, DC: IMF.
Lo, A.W. (2002) 'The statistics of Sharpe ratios', Financial Analysts Journal, 58(4), pp.36-52.
Lustig, H., Roussanov, N. and Verdelhan, A. (2011) 'Common risk factors in currency markets', Review of Financial Studies, 24(11), pp.3731-3777.
Menkhoff, L., Sarno, L., Schmeling, M. and Schrimpf, A. (2012) 'Carry trades and global foreign exchange volatility', Journal of Finance, 67(2), pp.681-718.
Powell, J. (2020) Monetary Policy and Price Stability. Speech at Jackson Hole Economic Symposium, August 27, 2020.
Rey, H. (2015) 'Dilemma not trilemma: The global financial cycle and monetary policy independence', NBER Working Paper No. 21162.
Shin, H.S. (2017) 'The bank/capital markets nexus goes global', Bank for International Settlements Speech, January 15, 2017.

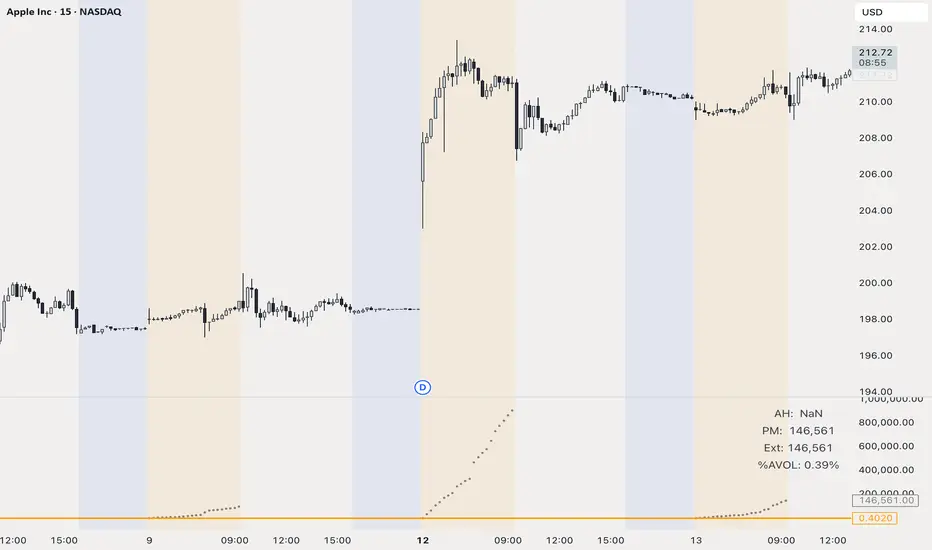
Extended-hours Volume vs AVOL// ──────────────────────────────────────────────────────────────────────────────
// Extended-Hours Volume vs AVOL • HOW IT WORKS & HOW TO TRADE IT
// ──────────────────────────────────────────────────────────────────────────────
//
// ░ What this indicator is
// ------------------------
// • It accumulates PRE-MARKET (04:00-09:30 ET) and AFTER-HOURS (16:00-20:00 ET)
// volume on intraday charts and compares that running total with the stock’s
// 21-day average daily volume (“AVOL” by default).
// • Three live read-outs are shown in the data-window/table:
//
// AH – volume traded since the 16:00 ET close
// PM – volume traded before the 09:30 ET open
// Ext – AH + PM (updates in pre-market only)
// %AVOL – Ext ÷ AVOL × 100 (updates in pre-market)
//
// • It is intended for U.S. equities but the session strings can be edited for
// other markets.
//
// ░ Why it matters
// ----------------
// Big extended-hours volume almost always precedes outsized intraday range.
// By quantifying that volume as a % of “normal” trade (AVOL), you can filter
// which gappers and news names deserve focus *before* the bell rings.
//
// ░ Quick-start trade plan (educational template – tune to taste)
// ----------------------------------------------------------------
// 1. **Scan** the watch-list between 08:30-09:25 ET.
// ► Keep charts on 1- or 5-minute candles with “Extended Hours” ✔ checked.
// 2. **Filter** by `Ext` or `%AVOL`:
// – Skip if < 10 % → very low interest
// – Flag if 20-50 % → strong interest, Tier-1 candidate
// – Laser-focus if > 50 % → crowd favourite; expect liquidity & range
// 3. **Opening Range Breakout (long example)**
// • Preconditions: Ext ≥ 20 % & price above yesterday’s close.
// • Let the first 1- or 5-min bar complete after 09:30.
// • Stop-buy 1 tick above that bar (or pre-market high – whichever higher).
// • Initial stop below that bar low (or pre-market low).
// • First target = 1R or next HTF resistance.
// 4. **Red-to-Green reversal (gap-down long)**
// • Ext ≥ 30 % but pre-market gap is negative.
// • Enter as price reclaims yesterday’s close on live volume.
// • Stop under reclaim bar; scale out into VWAP / first liquidity pocket.
// 5. **Risk** – size so the full stop is ≤ 1 R of account. Volume fade or
// loss of %AVOL slope is a reason to tighten or exit early.
//
// ░ Tips
// ------
// • AVOL look-back can be changed in the input panel (21 days ⇒ ~1 month).
// • To monitor several symbols, open a multi-chart layout and sort your
// watch-list by %AVOL descending – leaders float to the top automatically.
// • Replace colour constants with hex if the namespace ever gets shadowed.
//
// ░ Disclaimer
// ------------
// For educational purposes only. Not financial advice. Trade your own plan.
//
// ──────────────────────────────────────────────────────────────────────────────
OB Sweeps ReversalOB Sweeps Reversal is a high-precision market structure tool that identifies and dynamically tracks bullish and bearish order blocks — key zones where institutional participants are likely to be active. These zones act as support and resistance levels, adapting to market behavior in real time.
The script monitors price interaction with each OB and classifies its status as:
Unmitigated (price has not yet returned)
Mitigating (price is testing the zone)
Invalidated (zone has been broken)
Traders can use these zones directly as actionable support/resistance — or wait for additional confirmation via the system’s liquidity sweep detection and optional filters.
🔍 Key Features:
Automatically detects and plots bullish and bearish OBs
Tracks mitigation status and updates visuals accordingly
Detects liquidity sweeps of recent highs/lows
Optional filters:
• 200 EMA trend direction
• Momentum of current or previous candle
Plots stop-loss and take-profit lines using ATR-based logic
Clean entry labels with full contextual data
Built-in alert system with constant-string messages (automation ready)
📈 How to Use:
Load the script on any timeframe (15m–4H recommended)
Observe the live OB zones as they develop
Trade based on price interaction:
• Bounce off a bullish OB = potential long setup
• Rejection from a bearish OB = potential short
• Sweep + snapback into an OB = optional trap reversal entry
SL/TP levels are drawn automatically for reference
Use alerts to automate or monitor high-conviction setups
The order blocks themselves are valuable on their own — even without waiting for a signal. They can be used as dynamic support and resistance zones, offering excellent structure-based trading opportunities.
🧠 Ideal For:
Traders who follow price action and market structure
Those using support/resistance, OBs, or supply/demand
Intraday and swing traders looking for cleaner structure alignment
Users who prefer low-frequency, high-quality setups
⚠️ Note:
This tool does not produce frequent signals. It is designed for precision and discipline, with a focus on clarity and confluence. It complements — not replaces — a trader’s decision-making process.
This script is open-source and designed with integrity, precision, and trader usability in mind. No links, no upsells, no promotions — just a reliable system for structural market analysis.
