Central Bank Dark Energy TracerCentral Bank Dark Energy Tracer (CBDE Tracer)
What makes The Universe grow at an accelerating pace?
Dark Energy.
What makes The Economy grow at an accelerating pace?
Debt.
Debt is the Dark Energy of The Economy.
The CBDE Tracer is a tool that tracks currency assets in US dollars that can be scaled to fit other assets on TradingView.
The example provided is QQQ with scale factors and offsets applied that best curve fit to the most recent price action.
The white line is non-US assets from the following central banks:
-JPY (Japan)
-CNY (China)
-UK (British Pound)
-SNB (Swiss National Bank)
-ECB (European Central Bank )
The lime green line is for US Federal Reserve data including a midpoint of WRESBAL and the fed liquidity calculation (WALCL - WTREGEN) and then subtracting RRPONTSYD
The purple line is the average of the two, US assets, and non-US.
The settings can be configured so that only the average is showing, which should the closest aggregate of all liquidity data.
Cerca negli script per "liquidity"

30MIN CYCLE█ HOW DOES IT WORK?
The known 90 min cycle is used as one killzone. But actually all 18 min are relevant to search for a trade. All 18 min when a new box starts only then is the placement of an order valid. If the entry candle isn't in a box then it will probably fail. The boxes should only be used in the M1 or M5 timeframe. The best hitrate is in the M1 timeframe. Included are the last 48 "Mini-Killzones" für intraday trading and backtesting. These "Mini-Killzones" can be used with the "Liquidity Inducement Strategy".
█ WHAT MAKES IT UNIQUE?
This is the first indicator on tradingview that shows all mini-killzones for trading and backtesting a whole tradingday. The well-known killzones of ICT are from 08:00-11:00 and 14:00 - 17:00 (UTC+1) but with this indicator there is finally a refinement of the ICT Smart Money Concept killzones.
█ HOW TO USE IT?
For a proper use of this indicator we suggest to know already at least SMC or better Liquidity Indcuement Trading. This indicator is a further confluence before placing an order. After you made your setup you will have these mini-killzones as a confluence. We don't suggest to open a trade only according to this indicator.
█ ADDITIONAL INFO
This indicator is free to use for all tradingview users.
█ DISCLAIMER
This is not financial advice.

Day Trading Booster by DGTTiming when day trading can be everything
In Stock markets typically more volatility (or price activity) occurs at market opening and closings
When it comes to Forex (foreign exchange market), the world’s most traded market, unlike other financial markets, there is no centralized marketplace, currencies trade over the counter in whatever market is open at that time, where time becomes of more importance and key to get better trading opportunities. There are four major forex trading sessions, which are Sydney , Tokyo , London and New York sessions
Forex market is traded 24 hours a day, 5 days a week across by banks, institutions and individual traders worldwide, but that doesn’t mean it’s always active the entire day. It may be very difficult time trying to make money when the market doesn’t move at all. The busiest times with highest trading volume occurs during the overlap of the London and New York trading sessions, because U.S. dollar (USD) and the Euro (EUR) are the two most popular currencies traded. Typically most of the trading activity for a specific currency pair will occur when the trading sessions of the individual currencies overlap. For example, Australian Dollar (AUD) and Japanese Yen (JPY) will experience a higher trading volume when both Sydney and Tokyo sessions are open
There is one influence that impacts Forex matkets and should not be forgotten : the release of the significant news and reports. When a major announcement is made regarding economic data, currency can lose or gain value within a matter of seconds
Cryptocurrency markets on the other hand remain open 24/7, even during public holidays
Until 2021, the Asian impact was so significant in Cryptocurrency markets but recent reasearch reports shows that those patterns have changed and the correlation with the U.S. trading hours is becoming a clear evolving trend.
Unlike any other market Crypto doesn’t rest on weekends, there’s a drop-off in participation and yet algorithmic trading bots and market makers (or liquidity providers) can create a high volume of activity. Never trust the weekend’ is a good thing to remind yourself
One more factor that needs to be taken into accout is Blockchain transaction fees, which are responsive to network congestion and can change dramatically from one hour to the next
In general, Cryptocurrency markets are highly volatile, which means that the price of a coin can change dramatically over a short time period in either direction
The Bottom Line
The more traders trading, the higher the trading volume, and the more active the market. The more active the market, the higher the liquidity (availability of counterparties at any given time to exit or enter a trade), hence the tighter the spreads (the difference between ask and bid price) and the less slippage (the difference between the expected fill price and the actual fill price) - in a nutshell, yield to many good trading opportunities and better order execution (a process of filling the requested buy or sell order)
The best time to trade is when the market is the most active and therefore has the largest trading volume, trading all day long will not only deplete a trader's reserves quickly, but it can burn out even the most persistent trader. Knowing when the markets are more active will give traders peace of mind, that opportunities are not slipping away when they take their eyes off the markets or need to get a few hours of sleep
What does the Day Trading Booster do?
Day Trading Booster is designed ;
- to assist in determining market peak times, the times where better trading opportunities may arise
- to assist in determining the probable trading opportunities
- to help traders create their own strategies. An example strategy of when to trade or not is presented below
For Forex markets specifically includes
- Opening channel of Asian session, Europien session or both
- Opening price, opening range (5m or 15m) and day (session) range of the major trading center sessions, including Frankfurt
- A tabular view of the major forex markets oppening/closing hours, with a countdown timer
- A graphical presentation of typically traded volume and various forext markets oppening/clossing events (not only the major markets but many other around the world)
For All type of markets Day Trading Booster plots
- Day (Session) Open, 5m, 15m or 1h Opening Range
- Day (Session) Referance Levels, based on Average True Range (ATR) or Previous Day (Session) Range (PH - PL)
- Week and Month Open
Day Trading Booster also includes some of the day trader's preffered indicaotrs, such as ;
- VWAP - A custom interpretaion of VWAP is presented here with Auto, Interactive and Manual anchoring options.
- Pivot High/Low detection - Another custom interpretation of Pivot Points High Low indicator.
- A Moving Average with option to choose among SMA, EMA, WMA and HMA
An example strategy - Channel Bearkout Strategy
When day trading a trader usually monitors/analyzes lower timeframe charts and from time to time may loose insight of what really happens on the market from higher time porspective. Do not to forget to look at the larger time frame (than the one chosen to trade with) which gives the bigger picture of market price movements and thus helps to clearly define the trend
Disclaimer : Trading success is all about following your trading strategy and the indicators should fit within your trading strategy, and not to be traded upon solely
The script is for informational and educational purposes only. Use of the script does not constitutes professional and/or financial advice. You alone the sole responsibility of evaluating the script output and risks associated with the use of the script. In exchange for using the script, you agree not to hold dgtrd TradingView user liable for any possible claim for damages arising from any decision you make based on use of the script

J1 - Glassnode Metrics ToolkitTV announced that you can now pull data from Glassnode!
Here you can find every metric available to compare blockchain data from different coins.
How to use:
- Select your Coin
- Select your Metric
Then you can enable another coin or the same one to compare data.
As per TV's post:
Coins:
BTC, ETH, LTC, AAVE, ABT, AMPL, ANT, ARMOR, BADGER, BAL, BAND, BAT, BIX, BNT, BOND, BRD, BUSD, BZRX, CELR, CHSB, CND, COMP, CREAM, CRO, CRV, CVC, CVP, DAI, DDX, DENT, DGX, DHT, DMG, DODO, DOUGH, DRGN, ELF, ENG, ENJ, EURS, FET, FTT, FUN, GNO, GUSD, HEGIC, HOT, HPT, HT, HUSD, INDEX, KCS, LAMB, LBA, LDO, LEO, LINK, LOOM, LRC, MANA, MATIC, MCB, MCO, MFT, MIR, MKR, MLN, MTA, MTL, MX, NDX, NEXO, NFTX, NMR, Nsure, OCEAN, OKB, OMG, PAX, PAY, PERP, PICKLE, PNK, PNT, POLY, POWR, PPT, QASH, QKC, QNT, RDN, REN, REP, RLC, ROOK, RPL, RSR, SAI, SAN, SNT, SNX, STAKE, STORJ, sUSD, SUSHI, TEL, TOP, UBT, UMA, UNI, USDC, USDK, USDT, UTK, VERI, WaBi, WAX, WBTC, WETH, wNMX, WTC, YAM, YFI, ZRX.
Metrics:
ACTIVEADDRESSES — Number of Active Addresses
SENDINGADDRESSES — Number of Sending Addresses
RECEIVINGADDRESSES — Number of Receiving Addresses
NEWADDRESSES — Number of New Addresses
ADDRESSES — Number of Addresses
BLOCKS — Block Height
BLOCKSMINED — Number of Blocks Mined
BLOCKMEANINTERVAL — Mean Block Interval
BLOCKMEDIANINTERVAL — Median Block Interval
TOTALBLOCKSIZE — Total Block Size
MEANBLOCKSIZE — Mean Block Size
TOTALTXFEES — Total Transaction Fees
MEANTXFEES — Mean Transaction Fees
MEDIANTXFEES — Median Transaction Fees
TOTALTXFEESUSD — Total Transaction Fees in USD
MEANTXFEESUSD — Mean Transaction Fees in USD
MEDIANTXFEESUSD — Median Transaction Fees in USD
TOTALGASUSED — Total Gas Used
MEANGASUSED — Mean Gas Used
MEDIANGASUSED — Median Gas Used
MEANTXGASPRICE — Mean Transaction Gas Price in gwei
MEDIANTXGASPRICE — Median Transaction Gas Price in gwei
MEANTXGASPRICEUSD — Mean Transaction Gas Price in USD
MEDIANTXGASPRICEUSD — Median Transaction Gas Price in USD
MEANGASLIMIT — Mean Transaction Gas Limit
MEDIANGASLIMIT — Median Transaction Gas Limit
MARKETCAP — Market Cap
DIFFICULTY — Mining Difficulty
HASHRATE — Mean Hash Rate
ATHDRAWDOWN — Price Drawdown from ATH
SOPR — Spent Output Profit Ratio (SOPR)
NEWDEPOSITS — Number of New Deposits
NEWSTAKED — Amount of New Value Staked
NEWSTAKEDUSD — Amount of New Value Staked in USD
NEWVALIDATORS — Number of New Validators
DEPOSITS — Total Number of Deposits
STAKED — Total Value Staked
STAKEDUSD — Total Value Staked in USD
VALIDATORS — Total Number of Validators
PHASE0GOAL — Phase 0 Staking Goal
ACTIVE1Y — Percent of Supply Last Active 1+ Years Ago
TXS — Number of Transactions
TXSPS — Number of Transactions per Second
TFSPS — Number of Transfers per Second
TOTALTXSIZE — Total Size of Transactions
MEANTXSIZE — Mean Size of Transfers
TOTALVOLUME — Total Transfer Volume
TOTALVOLUMEUSD — Total Transfer Volume in USD
MEANVOLUME — Mean Transfer Volume
MEANVOLUMEUSD — Mean Transfer Volume in USD
MEDIANVOLUME — Median Transfer Volume
MEDIANVOLUMEUSD — Median Transfer Volume in USD
UTXOCREATED — Number of Created UTXOs
UTXOSPENT — Number of Spent UTXOs
UTXOTOTAL — Total Numbers of UTXOs in the Network
UTXOVALUETOTAL — Total Value of Created UTXOs
UTXOVALUETOTALUSD — Total Value of Created UTXOs in USD
UTXOVALUEMEAN — Mean Value of Created UTXOs
UTXOVALUEMEANUSD — Mean Value of Created UTXOs in USD
UTXOVALUEMEDIAN — Median Value of Created UTXOs
UTXOVALUEMEDIANUSD — Median Value of Created UTXOs in USD
UTXOVALUETOTALSPENT — Total Value of Spent UTXOs
UTXOVALUETOTALSPENTUSD — Total Value of Spent UTXOs in USD
UTXOVALUEMEANSPENT — Mean Value of Spent UTXOs
UTXOVALUEMEANSPENTUSD — Mean Value of Spent UTXOs in USD
UTXOVALUEMEDIANSPENT — Median Value of Spent UTXOs
UTXOVALUEMEDIANSPENTUSD — Median Value of Spent UTXOs in USD
UNISWAPTXS — Number of Transactions on Uniswap
UNISWAPTOTALVOLUME — Total Volume Traded on Uniswap
UNISWAPTOTALVOLUMEUSD — Total Volume Traded on Uniswap in USD
UNISWAPLIQUIDITY — Total Liquidity on Uniswap
UNISWAPLIQUIDITYUSD — Total Liquidity on Uniswap in USD

PVSRA Volume Price - Some people say "Price Action is King". I say, we cannot know how the MMs (Market Makers) will move price next, period. But price tends to consolidate above key SR when MMs are filling short orders for SM (Smart Money) and long orders for DM (Dumb Money), and price tends to consolidate below key SR when MMs are filling long orders for SM and short orders for DM. The MMs are also "SM", and they tend to do the other SMs "one better"! This means that after the MMs fill the SM/DM orders, they might move price a bit further in an attempt to stop out some of those SM executed orders and sucker in more DM; both giving liquidity for the MMs to add to their own SM side position. Yes, the MMs are bastards. But the point is that could leave price not "nicely" above or below a SR anymore, yet more consolidation can occur.
Volume - Increases in activity denote increase in interest. But, is it long or short interest? Where is price in the bigger picture when this is happening? Is it at relative highs, or lows in the overall price action? And if a high volume bar is for a candle which you can examine by going to lower TF charts, you might see where in the spread of that candle the most volume occurred, high or low! Using volume is about taking note of relative increases in volume and what price is doing at the same time. Are the better volumes favoring the lower or the higher prices, as the MMs waffle price up and down? And do the volumes get particularly notable when the MMs take price above or below key SR?
S&R - Read all about S&R at "Baby Pips.com". What I want you to realize here is that the whole, half and quarter numbered price levels (hereinafter referred to as "Levels") are the most important SR of all in this market! Not because price stops, pauses, proceeds or reverses there, but because it is above or below these levels that important consolidation (MMs filling SM orders) takes place. Once SM long orders are filled, they become interested in placing orders to close them at higher prices, and hence the MMs will be moving price higher, eventually. Once SM short orders are filled, they become interested in placing orders to close them at lower prices, and hence the MMs will be moving price lower, eventually.
PVSRA - If we can spot consolidations above/below key SR, examine the overall price action on various TF charts, and take note of where the notable increases in volume have most recently occurred (did volume favor relative highs or lows), then we can build a consensus about what kind of orders the MMs have most recently been filling; buying to open longs or close shorts, or selling to open shorts or close longs. And we can get a better idea if things will next become bullish or bearish. And once PA confirms our bullish or bearish PVSRA results, by recognizing the importance of Levels we can look beyond current PA in the direction it is going and look to historic PA S&R (consolidation around key Levels) to come up with candidates for where the price might be headed. And bull or bear swings typically run in terms of 100+, 150+, 200+ pips, .....etc. And now you know why.
Okay. Now, if this is your first introduction to PVSRA, and having just read the above, you are likely scratching your head and still confused. That is normal. I will tell you a secret about the market and why you have a right to be confused. The secret is this. The market cannot be defined by mathematics nor by immutable logic. This is why the most advanced mathematicians over a century have never even come close to cracking the market. It cannot be done. Something else, other than math and immutable logic is the fundamental operand in the market. Have you ever watched a child attempt a jigsaw puzzle for the first time? And watched as that child grew and attempted more of them, and more complex ones? What is at work in the market I will elaborate on later, but for now trust me in this. We need to apply ourselves to learning how to do PVSRA just as a child attacks learning how to do jigsaw puzzles. And we must continue doing PVSRA, because in time our mind will "learn" when we have just picked up an important piece of the puzzle, and that we know where it goes! Developing the skill of PVSRA is an art form. We must not allow ourselves to feel badly if we miss clues. PVSRA is an art form that takes time to perfect. Over time our skill will grow and our "read" of the unpredictable market will improve. We must take to ongoing learning and application of PVSRA.
Introduction to How the Market Really Works
Does anybody remember the "lil' Abner" cartoons in the Sunday papers? Let me draw for you a mental picture of how the market really works.....
Imagine Daddy Yokum ferociously racing a buckboard wagon up and down the steep inclines and declines in the rough, rocky mountain road that has sharp turns and a sheer cliff on one side. The wagon wheels are spewing rocks off the side of the cliff! Even Daddy Yokum's shotgun is going off due to the jolting of the buckboard! Daddy Yokum has a demented look on his face, but he is smiling! The horse has a wild look in it's eyes and is frothing at the mouth. There are two passengers being tossed around in the back of the buckboard, terror stricken! Now, let's pan back from this cartoon picture and place the labels needed. On the side of the wagon is the sign "Market Pricing". The demented, smiling Daddy Yokum, is the Market Maker. The passengers being tossed around are the buyers and sellers.
.....Got it? Market prices are not determined by the buyers and sellers. They are determined by the Robber Bank Market Makers (MMs).
MMs are Market Manipulators of Price, and Thieves!
The "market" is the sole creation of the Robber Banks that "make the market". While it serves the world of commerce, they run it to make profits. And they opened the market up to foster prolific currency trading by others for the sole purpose of making more profits. They move prices up and down to "create liquidity" to fill the orders of SM (Smart Money) and DM (Dumb Money), for the commissions they make by filling the orders. When they have some orders above the current price and some below the current price, who do you think determines the sequence of direction and distance the price is going to move so these orders can be filled? And always - since they know how they are going to move price next - they take positions themselves to make additional profits.
They do this by:
1. Manipulating price to sucker into the market DM that is taking the wrong side position.
2. Manipulating price to sucker into the market SM that is taking the right side position, but too soon, and later manipulating price to hit their stops.
They have total control of pricing, and by these actions they effectively "steal" from others the money to fill their own "right side" positions before moving the price to the next area they have decided on for filling orders, and for taking profit on their positions built beforehand. Don't get me wrong. I do not object to the market volatility these thieving Robber Banks create. We need it. But we also need to understand what these people are like, the cloth they are cut from. They are crooks, and we have to be extra careful about trading in the market they operate. On some special days you can see them in their true colors. We should witness it. Take note of it. Speak of it. And remember it!

DOJI FU IndicatorIndicator is designed to paint a doji, the size of which can be adjusted in settings.
Provided there is a valid doji, the following candle is a 'FU candle' or an 'Institution' candle. This candle wicks above/below the doji and takes liquidity from above or below.
Colours can be changed
Red = Doji candle
Yellow = FU candle
Example shown on the 1hr chart, red doji indicating a change of trend upwards, the FU candle (yellow) takes liquidity from above and sweeps down.

Multi-Exchange Volume (30 Tickers) by kurtsmock + BV + rVolauthor: kurtsmock
Fully Customizable ticker set. Up to 30 Tickers. Bitcoin set as default.
-- IMPORTANT NOTE: --
30 Exchanges are a lot. It can take a while to load. You can fully customize this indicator to your liking. Here's how:
1. Load indicator
2. Open Settings
3. Uncheck the switch box for exchanges you want unincluded
4. At the bottom of the settings menu click "Defaults" and hit "Save as Default"
5. To turn them all back on, hit "Reset Settings" in that same "Defaults" menu and click "Save as Default" again.
Also, you don't have to use this with Bitcoin. This works with any asset, just change the ticker in the settings.
There's a lot going on with this indicator so the following is descriptions and instructions to help you better understand what's going on here. Thanks!
Goal:
- To provide a mechanism for assets on multiple exchanges to have their volume evaluated together
Edge:
- Having better and more complete volume information
Notes:
- The Default Exchanges for this indicator are highest volume bitcoin exchanges, but may contain "fake volume"
- Indicator is set for Bitcoin by default. However, you can change the tickers to reflect any asset you want
////// rVol //////
Goal:
- To understand how much volume is being executed relative to the same candle on previous days/periods
Edge:
- Higher rVol implies higher volatility and market interest.
- High rVol = higher than average volume . Markets move on volume so higher than average volume indicates increased market activity/volatility
- rVol is an indirect measure of active or anticipated volatility
Definitions:
- rVol: The volume of a period compared to the Average Volume of that same period in past sessions
- Important to note it does NOT add up the last 10 (default) candles, but rather the last 10 candles at session intervals.
- Example:
-- On a Tuesday, 1h chart it will add up the last ten Tuesday, 9:00 am candles, not including the current, active candle.
-- It then averages those lookback candles.
-- It then plots the percentage relationship between the most recent candle and the average of the lookback candles
-- Avg Vol of Lookback candles = 5000,
-- Volume of most recent candle = 4000: Output = rVol = 80:
-- Volume of most recent candle was 80% of the average volume in the 9 am time period of the last ten Tuesdays in the 9 am, 1h period
Notes:
- rVol does not add current candle volume into lookback sum. So, you set lookback to be: (not including the current day)
- rVol is on a switch. So, if you want to see rVol instead of volume, hit the switch in the settings
- If you want to see both, load 2 instances of the indicator.
////// Better-er Volume //////
Goal:
To Identify:
- When a candle closes at the highest volume * range relative to the lookback period and close > open
- When a candle closes at the highest volume * range relative to the lookback period and close < open
- When a candle closes at the highest volume / price relative to the lookback period
Edge:
- Identifies beginnings of price expansion, climax of price expansion, breakouts, pivots, and take profit points on the volume chart
Notes:
- Based generally on Barry Taylor's "Better Volume" indicator and ideas from Pascal Willain's book "Value in Time."
- Better-er Volume rules are applied to both Total Volume or rVol.
-- When rVol is displayed Better-er Volume is applied to rVol
-- When Total Volume is displayed Better-er Volume is applied to Total Volume
// Plot Key: //
Green Triangle Up = Often marks the beginning and/or end of price expansion to the upside
Red Triangle Up = Often marks the beginning and/or end of price expansion to the downside
Yellow Square = High Volume but Tight Range. Implies a Battle of Bulls and Bears. High Liquidity area. Provided Liquidity is not enough to move price. Thick Limit Order Book.
Purple Triangle Up or Down = Implies high market participation. Typically at the end of expansion when very significant s/r is hit
category: volume Volatility
tags: Volume rVol relativevolume Bitcoin cryptocurrency bettervolume
Many More Volume Indicators Coming Out Soon!


S&R ZonesThis indicator automatically detects swing highs and swing lows on the chart using a 3-bar swing structure. Once a swing point is confirmed, it evaluates the price movement and body size of subsequent candles. If the movement meets a volume-based range condition (2.5× the average body size of the last 5 candles), the indicator creates a zone around that swing.
Swing High Zones: Drawn from the highest price of the swing cluster down to its midpoint.
Swing Low Zones: Drawn from the lowest price of the swing cluster up to its midpoint.
These zones act as dynamic support and resistance levels and remain on the chart until they are either:
Broken (price closes beyond the zone), or
Expired (more than 200 bars old).
Zones are color-coded for clarity:
🔴 Red shaded areas = Swing High resistance zones.
🟢 Green shaded areas = Swing Low support zones.
This makes the indicator useful for identifying high-probability reversal areas, liquidity zones, and supply/demand imbalances that persist until invalidated.

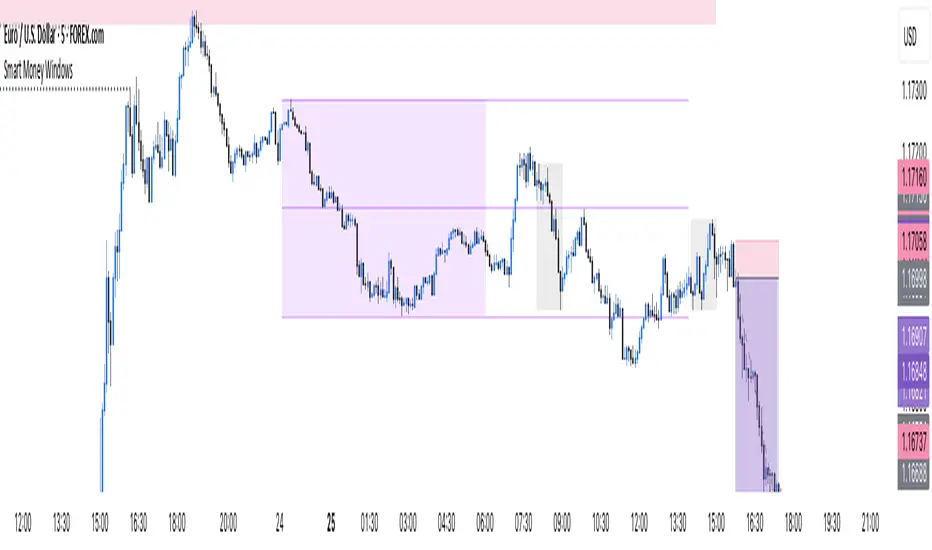
Smart Money Windows- X7Smart Money Windows 📊💰
Unlock the secret moves of the big players! This indicator highlights key liquidity traps, smart money zones, and market kill zones for the Asian, London, and New York sessions. See where the pros hide their orders and spot potential price flips before they happen! 🚀🔥
Features:
Visual session boxes with high/low/mid levels 🟪🟫
NY session shifted 60 mins for precise timing 🕒
Perfect for spotting traps, inducements & smart money maneuvers 🎯
Works on Forex, crypto, and stocks 💹
Get in the “Smart Money Window” and trade like the pros! 💸🔑
By HH
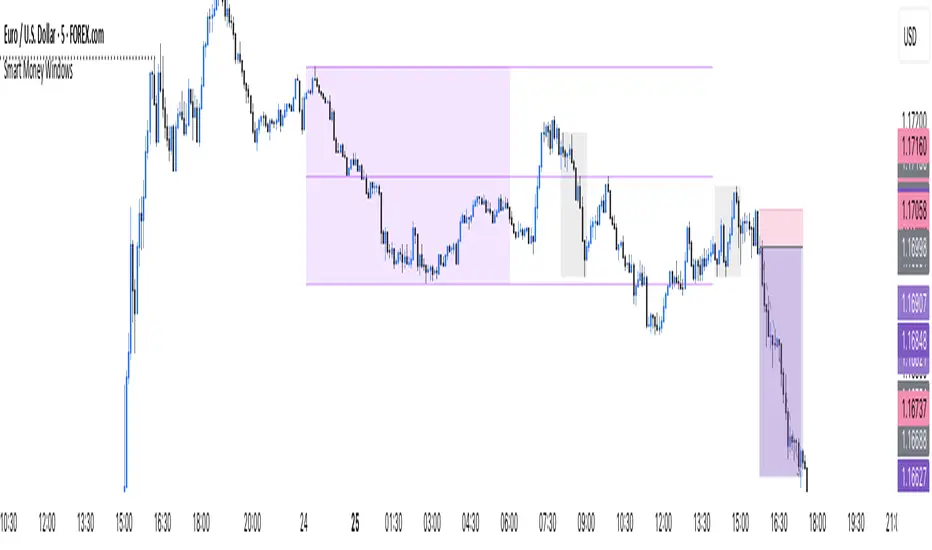
Sunmool's Next Day Model FVG AlertNY Killzone FVG Alert - ICT Fair Value Gap Detection Indicator
This comprehensive Pine Script indicator is specifically designed for traders following ICT (Inner Circle Trader) methodology and Smart Money Concepts. The indicator automatically detects Fair Value Gaps (FVG) that occur during the New York Killzone session, providing real-time alerts when these critical market imbalances are identified.
Key Features:
🎯 Fair Value Gap Detection
Automatically identifies bullish and bearish Fair Value Gaps using the classic 3-candle pattern
Filters gaps based on customizable minimum size thresholds to avoid insignificant imbalances
Provides visual representation through colored boxes and labels for easy identification
⏰ New York Killzone Focus
Specifically monitors the NY Killzone session (default: 7:00 AM - 10:00 AM EST)
Fully customizable session times to accommodate different trading preferences
Only detects FVGs when all three candles forming the gap occur within the killzone timeframe
📅 ICT Next Day Model Compliance
Automatically excludes Mondays from FVG detection as per ICT Next Day Model principles
Optional Monday exclusion can be toggled on/off based on trading strategy
Ensures alignment with professional ICT trading methodologies
🔔 Advanced Alert System
Three distinct alert conditions: Bullish FVG, Bearish FVG, and Combined alerts
Customizable alert messages for different notification preferences
Compatible with TradingView's full alert system including email, SMS, and webhook notifications
🎨 Visual Customization
Adjustable colors for bullish and bearish FVG boxes
Configurable box extension length for better visualization
Optional background highlighting during killzone sessions
Clean, professional chart presentation that doesn't clutter your analysis
📊 Technical Specifications
Works on all timeframes, though most effective on intraday charts (1m, 5m, 15m)
Timezone-aware calculations ensure accurate session detection globally
Efficient code structure minimizes processing load and chart lag
Compatible with other indicators and doesn't interfere with existing chart setups
🎯 Ideal For:
ICT methodology traders seeking automated FVG detection
Smart Money Concepts practitioners
Scalpers and day traders focusing on NY session
Traders looking to identify high-probability entry zones
Anyone interested in market structure and liquidity concepts
📈 Trading Applications:
Fair Value Gaps often serve as areas where price may return to "fill" the imbalance, making them excellent zones for:
Potential reversal areas
Take profit targets
Stop loss placement reference points
Market structure analysis
Confluence with other ICT concepts
⚙️ Customizable Parameters:
FVG minimum size filter
Killzone session start/end times
Visual display options
Alert preferences
Color schemes and styling options
This indicator brings institutional trading concepts to retail traders, helping identify the same market inefficiencies that smart money targets. By focusing specifically on the New York Killzone - one of the most liquid and volatile trading sessions - it provides high-quality signals during optimal market conditions.
Whether you're new to ICT concepts or an experienced trader looking to automate your FVG detection, this indicator provides the precision and reliability needed for professional trading analysis.

Institutional Session VWAP Bands (Zeiierman)█ Overview
Institutional Session VWAP Bands (Zeiierman) plots a clean, session-aware VWAP that restarts at the “True Close” (end of the first trading hour) for each session you enable (Sydney, Tokyo, London, New York). From that anchor, the script computes a classic volume-weighted average price plus optional standard-deviation bands to frame session fair value and dispersion.
By aligning VWAP to when institutional flows settle (the first hour), you get a reference that matches real execution behavior, yielding more credible pullbacks, retests, and mean-reversion reads inside each session.
█ How It Works
⚪ Session Detection
You choose the sessions (on/off), their UTC-aligned time windows, and colors. The script detects when each session is active on your chart timeframe.
⚪ True-Close Anchoring
At session open the indicator waits. When the first hour completes, it flips the anchor on and starts a fresh VWAP for that session, mirroring how many desks treat the first hour as the real close for the prior day’s positioning.
⚪ VWAP Core
From the true-close anchor, VWAP is calculated in the standard way: cumulative (price × volume) / cumulative volume using your chosen price source (default hlc3).
⚪ VWAP Bands (σ)
Upper/Lower bands are built using a running standard deviation of the price source since the anchor. You control the σ multiplier and line width, and you can optionally fill between the bands.
█ Why Sessions + True-Close Anchoring
⚪ Institutional Timing Matters
A new anchor at the first-hour close reflects where real flows have settled, giving you a session fair-value line that aligns with how many funds evaluate prices intraday.
⚪ Cleaner Session Reads
Because VWAP and σ-bands restart each session, your retests, squeezes, and mean-reversion signals are based on today’s order-flow context, not yesterday’s inertia.
Result: a session-true fair-value with dispersion bands that stay close to the action, improving the quality of pullback entries and risk framing.
█ How to Use
⚪ Session Fair-Value Guide
Treat VWAP as the magnet for intraday value. Impulsive moves away from VWAP that fold back often present retest opportunities.
⚪ σ-Band Reversion & Breaks
Reversion: Tests beyond the upper/lower band that snap back inside can flag exhaustion.
Trend: Price riding the VWAP band in a strong trend
⚪ Session Handoffs
When one session hands to the next, watch how price behaves around the new session’s VWAP Bands after its anchor triggers. Continuation through the new VWAP vs. rejection often sets the tone.
█ Settings
UTC: Choose the timezone used to evaluate session windows (e.g., UTC+2).
Sessions (Sydney, Tokyo, London, New York): Toggle visibility and define each HHMM-HHMM window.
VWAP Price: Source for weighting.
Band Multiplier (σ): Standard deviation multiplier.
█ Related publications
True Close – Institutional Trading Sessions (Zeiierman)
-----------------
Disclaimer
The content provided in my scripts, indicators, ideas, algorithms, and systems is for educational and informational purposes only. It does not constitute financial advice, investment recommendations, or a solicitation to buy or sell any financial instruments. I will not accept liability for any loss or damage, including without limitation any loss of profit, which may arise directly or indirectly from the use of or reliance on such information.
All investments involve risk, and the past performance of a security, industry, sector, market, financial product, trading strategy, backtest, or individual's trading does not guarantee future results or returns. Investors are fully responsible for any investment decisions they make. Such decisions should be based solely on an evaluation of their financial circumstances, investment objectives, risk tolerance, and liquidity needs.

Same-Direction Candles (Two Symbols)Same-Direction Candles (Two Symbols)
What it does
Highlights bars on your chart when two symbols print the same candle direction on the chosen timeframe:
Both Bullish → one color
Both Bearish → another color
Great for spotting synchronous moves (e.g., NQ & ES, QQQ & SPY), or confirming risk-on/risk-off with an inverse asset (e.g., NQ vs DXY with inversion).
How it works
For each bar, the script checks whether close > open (bullish), close < open (bearish), or equal (doji) for:
The chart’s symbol
A second symbol pulled via request.security() (optionally on a different timeframe)
If both symbols are bullish, it paints Bull color; if both are bearish, it paints Bear color. Dojis can be ignored.
Inputs
Second symbol: Ticker to compare (e.g., CME_MINI:ES1!, NASDAQ:QQQ, TVC:DXY).
Second symbol timeframe: Leave blank to use the chart’s TF, or set a specific one (e.g., 5, 15, D).
Invert second symbol direction?: Flips the second symbol’s candle direction (useful for inversely related assets like DXY vs indices).
Ignore doji candles: Skip highlights when either candle is neutral (open == close).
Coloring options: Toggle bar coloring and/or background shading; pick colors; set background transparency.
Alerts
Three alert conditions:
Both Bullish
Both Bearish
Both Same Direction (bullish or bearish)
Create alerts from the Add Alert dialog after adding the script.
Use cases
Index confluence: NQ & ES moving in lockstep
ETF confirmation: QQQ & SPY agreement
FX/Index risk signals: Invert DXY against NQ/ES to see when equity strength aligns with dollar weakness
Tips
For mixed timeframes (e.g., chart on 1m, ES on 5m), set Second symbol timeframe to the higher TF to reduce noise.
Keep Ignore dojis on for cleaner signals.
Combine with your own entry rules (structure, FVGs, liquidity sweeps).
Notes
Works on any symbol/timeframe supported by TradingView.
Overlay script; no strategy/entries/exits are executed.
Past performance ≠ future results; for education only.
Version: 1.0 – initial release (bar/background highlights, doji filter, inversion, multi-TF support, alerts).

BTC CME Gap – detector & single signals# BTC CME Gap — Detector & Single Signals (Pine v5)
**What it does**
This indicator finds the **weekend gap** on **CME Bitcoin futures** and turns it into a clean, tradable object:
* Draws a **gap zone** (Friday close ↔ Monday open) as a right-extending box.
* Fires **one-time signals** per gap:
* **ENTER** – first touch of the gap zone by price.
* **FILL** – gap is considered filled when price tags **Friday’s close**.
It works on any BTC chart (spot or futures). The gap itself is calculated from **CME\:BTC1!** daily data.
---
## How it works
1. Pulls **daily** `open`/`close` from `CME:BTC1!` (`request.security`, no lookahead).
2. On **Monday**, compares Monday **open** with previous **Friday close**:
* If different → a **gap** exists.
3. Defines the zone:
* `gapTop = max(MonOpen, FriClose)`
* `gapBot = min(MonOpen, FriClose)`
4. Renders a box + boundary lines, **extending right** until price action resolves it.
5. Signals:
* **ENTER**: the first bar that **enters** the gap zone.
* **FILL**: first bar that **touches Friday close** (gap completion).
6. Each new Monday gap **replaces** the previous box and signals.
---
## Inputs
* **CME symbol** (default `CME:BTC1!`)
* **Gap timeframe** (default `D`)
* **Colors** for the box and edges
---
## Plot & Signals
* **Box** = visual gap zone (transparent fill, outlined).
* **ENTER** = triangle up below bar.
* **FILL** = triangle down above bar.
* Optional label prints **Top / Bottom / Fill** levels.
---
## Notes on behavior
* Uses `barmerge.lookahead_off` and daily aggregation, so the gap definition **does not repaint** once Monday’s daily bar is confirmed.
* Signals are **single-shot** per gap (no clutter).
* Works on any chart timeframe; the gap logic always references **CME daily**.
---
## Practical use
* Track obvious **“magnets”** for mean-reversion, stop-runs, or liquidity grabs.
* Combine with your higher-timeframe bias (e.g., **1D trend filter**) and execution on **4H/1H**.
* Typical outcomes: quick Monday fill, staged fill after partial rejection, or delayed fill during later consolidation.
---
## Customization ideas
* Add `alertcondition(enterSignal, …)` / `alertcondition(fillSignal, …)` for automation.
* Gate trades with trend filters (EMA/SMA, Kernel regression, ADX) or session tools (VWAP/POC).
* Persist multiple historical gap boxes if you want to track **unfilled** gaps.
---
**Credits**: Built for BTC CME weekend gaps; minimal, publication-ready visualization with single-event signals to keep charts clean.

Price Heat Meter [ChartPrime]⯁ OVERVIEW
Price Heat Meter visualizes where price sits inside its recent range and turns that into an intuitive “temperature” read. Using rolling extremes, candles fade from ❄️ aqua (cold) near the lower bound to 🔥 red (hot) near the upper bound. The tool also trails recent extreme levels, tags unusually persistent extremes with a % “heat” label, and shows a bottom gauge (0–100%) with a live arrow so you can read market heat at a glance.
⯁ KEY FEATURES
Rolling Heat Map (0–100%):
The script measures where the close sits between the current Lowest Low and Highest High over the chosen Length (default 50).
Candles use a two-stage gradient: aqua → yellow (0–50%), then yellow → red (50–100%). This makes “how stretched are we?” instantly visible.
Dynamic Extremes with Time Decay:
When a new rolling High or Low is set, the script starts a faint horizontal trail at that price. Each bar that passes without a new extreme increases a counter; the line’s color gradually fades over time and fully disappears after ~100 bars, keeping the chart clean.
Persistent-Extreme Tags (Reversal Hints):
If an extreme persists for 40 bars (i.e., price hasn’t reclaimed or surpassed it), the tool stamps the original extreme pivot with its recorded Heat% at the moment the extreme formed.
• Upper extremes print a red % label (possible exhaustion/resistance context).
• Lower extremes print an aqua % label (possible exhaustion/support context).
Bottom Heat Gauge (0–100% Scale):
A compact, gradient bar renders at the bottom center showing the current Heat% with an arrow/label. ❄️ anchors the left (0%), 🔥 anchors the right (100%). The arrow adopts the same candle heat color for consistency.
Minimal Inputs, Clear Theme:
• Length (lookback window for H/L)
• Heat Color set (Cold / Mid / Hot)
The defaults give a balanced, legible gradient on most assets/timeframes.
Signal Hygiene by Design:
The meter doesn’t “call” reversals. Instead, it contextualizes price within its range and highlights the aging of extremes. That keeps it robust across regimes and assets, and ideal as a confluence layer with your existing triggers.
⯁ HOW IT WORKS (UNDER THE HOOD)
Range Model:
H = Highest(High, Length), L = Lowest(Low, Length). Heat% = 100 × (Close − L) / (H − L).
Extreme Tracking & Fade:
When High == H , we record/update the current upper extreme; same for Low == L on the lower side. If the extreme doesn’t change on the next bar, a counter increments and the plotted line’s opacity shifts along a 0→100 fade scale (visual decay).
40-Bar Persistence Labels:
On the bar after the extreme forms, the code stores the bar_index and the contemporaneous Heat% . If the extreme survives 40 bars, it places a % label at the original pivot price and index—flagging levels that were meaningfully “tested by time.”
Unified Color Logic:
Both candles and the gauge use the same two-stage gradient (Cold→Mid, then Mid→Hot), so your eye reads “heat” consistently across all elements.
⯁ USAGE
Treat >80% as “hot” and <20% as “cold” context; combine with your trigger (e.g., structure, OB, div, breakouts) instead of acting on heat alone.
Watch persistent extreme labels (40-bar marks) as reference zones for reaction or liquidity grabs.
Use the fading extreme lines as a memory map of where price last stretched—levels that slowly matter less as they decay.
Tighten Length for intraday sensitivity or increase it for swing stability.
⯁ WHY IT’S UNIQUE
Rather than another oscillator, Price Heat Meter translates simple market geometry (rolling extremes) into a readable temperature layer with time-aware extremes and a synchronized gauge . You get a continuously updated sense of stretch, persistence, and potential reversal context—without clutter or overfitting.

Sniper Fade Indicator™️Sniper Fade Indicator™️
The Sniper Fade Indicator™️ is built to help traders spot potential fade opportunities — areas where price may exhaust and reverse during key sessions.
Features:
Fade Zone Mapping → visual zones highlighting likely reversal areas.
Time-Based Filters → optimized for London & New York sessions.
Clean Visual Overlays → boxes & markers for quick recognition.
Customizable Alerts → get notified when fade conditions align.
Works Across Markets → Forex, Futures, and Indices (including NAS100).
How to Use:
Use this indicator to plan trades around potential exhaustion zones. It works best when combined with daily bias context and liquidity levels. Always apply risk management and confirmation from your own strategy.
Notes:
Educational purposes only.
Not financial advice.
For best results, test in multiple markets and sessions.

Bardhi's ICT Killzone & PivotsThis indicator is a complete ICT-style session and liquidity toolkit designed for precision trading. It automatically marks the most important trading windows (“Killzones”) and provides powerful tools for tracking price action around them.
Key Features:
Killzones: Automatically plots Asia, London, and New York (AM, Lunch, PM) sessions with customizable colors, transparency, and labels.
Session Highs, Lows & Midpoints: Dynamic lines for killzone highs/lows, optional midpoints, and alerts when levels are broken.
Range Statistics: Displays the real-time range of each session plus rolling averages in a customizable table.
Day / Week / Month Levels: Plots opens, highs, lows, and separators for higher-timeframe reference points with optional alerts.
Custom Opening Prices: Define up to 8 custom open lines (e.g., True Day Open, 06:00, 10:00) with cutoff times.
Vertical Timestamp Lines: Highlight important intraday times such as news events or personal strategy triggers.
Day-of-Week Labels: Clean labels for each day, with the option to hide weekends.
Full Customization: Adjustable label sizes, colors, line styles, transparency, and drawing limits.
Why Use It?
This tool combines killzone sessions, pivots, higher-timeframe opens/highs/lows, and range statistics into one clean, automated package. It saves time drawing manually, keeps charts organized, and helps traders apply ICT concepts consistently.

ICT Silver Bullet Zones (All Sessions)This Pine Script v6 indicator highlights the ICT Silver Bullet windows (10:00–11:00 local time) for all major forex/trading sessions: London, New York AM, New York PM, and Asia.
✅ Features:
Clearly visualizes Silver Bullet zones for each session.
Labels are centered inside each zone for easy identification.
Fully compatible with Pine Script v6 and TradingView.
Adjustable opacity and label size for better chart visibility.
Works on any timeframe and keeps historical zones visible.
Use Case:
Perfect for ICT strategy traders who want to identify high-probability trading windows during major market sessions. Helps in planning entries and understanding liquidity timing without cluttering the chart.
Instructions:
Add the script to your TradingView chart.
Adjust opacity and label size to suit your chart style.
Observe the SB zones for all sessions and plan trades according to ICT methodology.

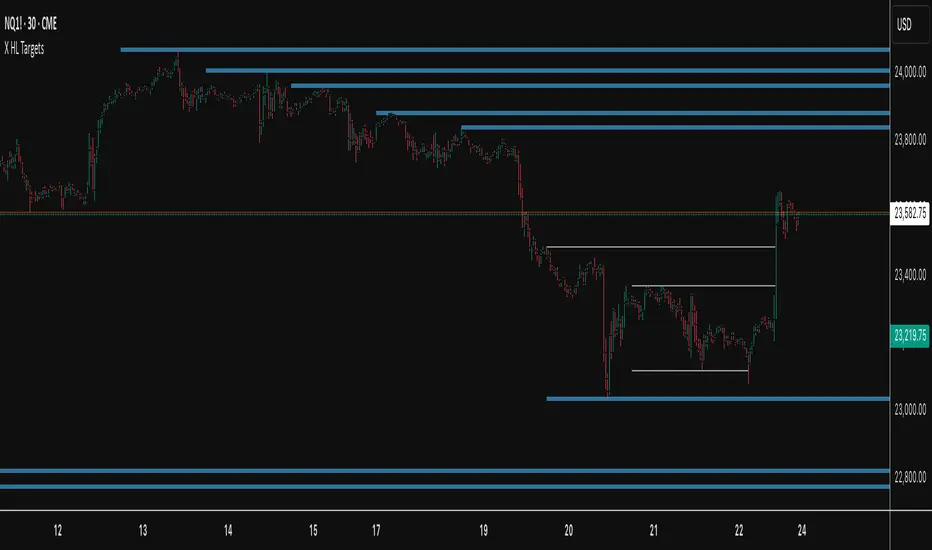
X HL TargetsDesigned to track and project prior interval high and low levels. It provides traders with clear reference points for potential targets, support and resistance
Key Features
Prior Interval Anchoring
At the start of each new interval, the indicator captures the previous interval’s high and low.
Current interval developing highs and lows are ignored, ensuring only completed data drives level creation.
Dynamic Extensions
Each high and low level is extended forward until price action mitigates (touches or crosses) the level.
When mitigated, the line is automatically “frozen” at the bar of contact and restyled to a subdued color.
End-of-Day Housekeeping
Optional setting allows all mitigated lines to be automatically removed at the end of each interval, keeping charts uncluttered and focused only on active untested levels.
Performance Management
User-defined limit on the number of past intervals retained ensures efficient performance and prevents chart overload.
Trading Applications
Target Mapping: Prior interval highs and lows are commonly watched areas where liquidity pools form and price often reacts.
Breakout & Reversal Signals: Monitoring if and when price mitigates these levels can help confirm breakouts or identify potential reversals.
Intraday Focus: By excluding developing highs and lows of the current session, the indicator emphasizes only proven, market-validated levels.
Clean Workspace: End-of-day deletion of mitigated lines prevents clutter and highlights only the most relevant active levels for ongoing sessions.
Pivot Matrix & Multi-Timeframe Support-Resistance Analytics________________________________________
📘 Study Material for Pivot Matrix & Multi Timeframe Support-Resistance Analytics
(By aiTrendview — Educational Use Only)
________________________________________
🎯 Introduction
The Pivot Matrix & Multi Timeframe Support-Resistance Analytics indicator is designed to help traders visualize pivot points, support/resistance levels, VWAP, and volume flow analytics all in one place. Rather than giving explicit buy/sell calls, the dashboard provides reference insights so a learner may understand how different technical levels interact in real time.
This document explains its functionality step by step with formulas and usage guides.
________________________________________
1️⃣ Pivot System Logic
Pivot points are classic tools for mapping market support and resistance levels.
✦ How Calculated?
Using the Traditional Method:
• Pivot Point (PP):
PP=Highprev+Lowprev+Closeprev3PP = \frac{High_{prev} + Low_{prev} + Close_{prev}}{3}PP=3Highprev+Lowprev+Closeprev
• First Support/Resistance:
R1=2×PP−Lowprev,S1=2×PP−HighprevR1 = 2 \times PP - Low_{prev}, \quad S1 = 2 \times PP - High_{prev}R1=2×PP−Lowprev,S1=2×PP−Highprev
• Second Support/Resistance:
R2=PP+(Highprev−Lowprev),S2=PP−(Highprev−Lowprev)R2 = PP + (High_{prev} - Low_{prev}), \quad S2 = PP - (High_{prev} - Low_{prev})R2=PP+(Highprev−Lowprev),S2=PP−(Highprev−Lowprev)
• Third Levels:
R3=Highprev+2×(PP−Lowprev),S3=Lowprev−2×(Highprev−PP)R3 = High_{prev} + 2 \times (PP - Low_{prev}), \quad S3 = Low_{prev} - 2 \times (High_{prev} - PP)R3=Highprev+2×(PP−Lowprev),S3=Lowprev−2×(Highprev−PP)
• Similarly, R4/R5 and S4/S5 are extrapolated from extended range multipliers.
✦ How Used?
• Price above PP → bullish control bias.
• Price below PP → bearish control bias.
• R1–R5 levels act as resistances; S1–S5 act as supports.
Learners should watch how candles behave when approaching R/S zones to spot breakout vs. rejection conditions.
________________________________________
2️⃣ Multi Timeframe Logic
The indicator allows using daily-based pivot values (via request.security). This ensures alignment with institutional daily levels, not just intraday recalculations.
✦ Teaching Value
Understanding MTF pivots shows how markets respect higher timeframe levels (daily > intraday, weekly > daily). This helps learners grasp nested support-resistance structures.
________________________________________
3️⃣ VWAP (Volume Weighted Average Price)
Formula:
VWAPt=∑(Pricei×Volumei)∑(Volumei),Pricei=High+Low+Close3VWAP_t = \frac{\sum (Price_i \times Volume_i)}{\sum (Volume_i)}, \quad Price_i = \frac{High + Low + Close}{3}VWAPt=∑(Volumei)∑(Pricei×Volumei),Pricei=3High+Low+Close
Usage:
• VWAP is used as an institutional benchmark of fair value.
• Above VWAP = bullish flow.
• Below VWAP = bearish flow.
Learners should check whether price respects VWAP as a magnet or uses it as support/resistance.
________________________________________
4️⃣ Volume Flow Analysis
The script classifies buy volume, sell volume, and neutral volume.
• Buy Volume = if close > open.
• Sell Volume = if close < open.
• Neutral Volume = if close = open.
For daily tracking:
Buy%=DayBuyVolDayTotalVol×100,Sell%=DaySellVolDayTotalVol×100Buy\% = \frac{DayBuyVol}{DayTotalVol} \times 100, \quad Sell\% = \frac{DaySellVol}{DayTotalVol} \times 100Buy%=DayTotalVolDayBuyVol×100,Sell%=DayTotalVolDaySellVol×100
Usage for Learners:
• Dominant Buy% → accumulation/ bullish pressure.
• Dominant Sell% → distribution/ bearish pressure.
• Balanced → sideways liquidity building.
This teaches observation of order flow bias rather than relying only on price.
________________________________________
5️⃣ Dashboard Progress Bars & Colors
The script uses visual progress bars and dynamic colors for clarity. For example:
• VWAP Backgrounds: Green shades when price strongly above VWAP, Red when below.
• Volume Bars: More green blocks mean buying dominance, red means selling pressure.
This visual design turns concepts into easy-to-digest cues, useful for training.
________________________________________
6️⃣ Market Status Summary
Finally, the dashboard synthesizes all data points:
• Price vs Pivot (above or below).
• Price vs VWAP (above or below).
• Volume Pressure (buy side vs sell side).
Status Rule:
• If all three align bullish → Status box turns green.
• If mixed → Neutral grey.
• If bearish dominance → weaker tone.
Why Important?
This teaches learners that market conditions should align in confluence across indicators before confidence arises.
________________________________________
⚠️ Strict Disclaimer (aiTrendview)
The Pivot Matrix & Multi Timeframe Support-Resistance Analytics tool is developed by aiTrendview for strictly educational and research purposes.
❌ It does NOT provide buy/sell recommendations.
❌ It does NOT guarantee profits.
❌ Unauthorized use, copying, or redistribution of this code is prohibited.
⚠️ Trading Risk Warning:
• Trading involves high risk of financial loss.
• You may lose more than your capital.
• Past levels and indicators do not predict future outcomes.
This tool must be viewed as a visual education aid to practice technical analysis skills, not as trading advice.
________________________________________
✅ Now you have a step by step study guide:
• Pivot calculations explained
• VWAP with logic
• Volume breakdown
• Visual analytics
• Status confluence logic
• Disclaimer for compliance
________________________________________
⚠️ Warning:
• Trading financial markets involves substantial risk.
• You can lose more money than you invest.
• Past performance of indicators does not guarantee future results.
• This script must not be copied, resold, or republished without authorization from aiTrendview.
By using this material or the code, you agree to take full responsibility for your trading decisions and acknowledge that this is not financial advice.
________________________________________
⚠️ Disclaimer and Warning (From aiTrendview)
This Dynamic Trading Dashboard is created strictly for educational and research purposes on the TradingView platform. It does not provide financial advice, buy/sell recommendations, or guaranteed returns. Any use of this tool in live trading is completely at the user’s own risk. Markets are inherently risky; losses can exceed initial investment.
The intellectual property of this script and its methodology belongs to aiTrendview. Unauthorized reproduction, modification, or redistribution of this code is strictly prohibited. By using this study material or the script, you acknowledge personal responsibility for any trading outcomes. Always consult professional financial advisors before making investment decisions.

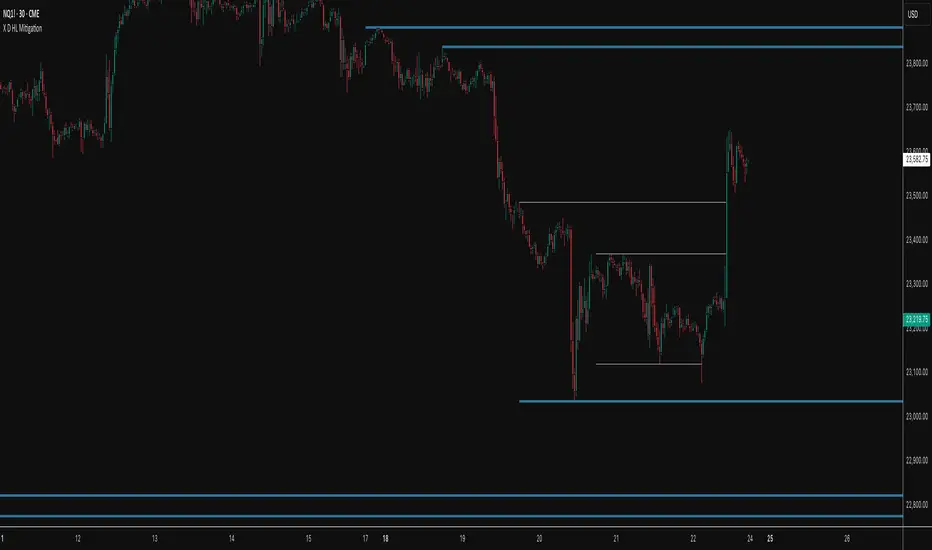
X D HL MitigationDesigned to track and project prior day high and low levels into the current trading session. It provides traders with reference points for potential support and resistance without being distorted by the unfinished intraday range of the active day.
Key Features
Prior-Day Anchoring
At the start of each new trading day, the indicator captures the previous day’s high and low.
Current-day developing highs and lows are ignored, ensuring only completed data drives level creation.
Dynamic Extensions
Each high and low level is extended forward intraday until price action mitigates (touches or crosses) the level.
When mitigated, the line is automatically “frozen” at the bar of contact and restyled to a new color.
This makes it easy to distinguish which historical levels remain active versus which have already been resolved by price.
End-of-Day Housekeeping
Optional setting allows all mitigated lines to be automatically removed at the end of each trading day, keeping charts uncluttered and focused only on active levels.
Trading Applications
Support & Resistance Mapping: Prior-day highs and lows are commonly watched areas where liquidity pools form and price often reacts.
Breakout & Reversal Signals: Monitoring if and when price mitigates these levels can help confirm breakouts or identify potential reversals.
Intraday Focus: By excluding developing highs and lows of the current session, the indicator emphasizes only proven, market-validated levels.
BSL/SSL 8:00–9:30 ET (Daily Reset)AlexCShow you the buyside and sellside liquidity that create between 8AM EST and 9:30 AM EST
