Momentum Matrix SignalMomentum Matrix Signals is a real-time indicator that finds BUY/SELL signals using a VWMA trend, closing momentum, and a strength score. It allows for re-entries & exits. ⚠️ WARNING: This version repaints; signals can disappear before a bar closes.
Signal Scoring
A signal is only considered if it first meets two mandatory conditions: a momentum trend and VWMA trend alignment.
If these are met, the signal is then scored from 0 to 5 based on a checklist of five factors:
2-Bar Trend: Confirms initial momentum.
3-Bar Trend: Confirms sustained momentum.
VWMA Trend: Confirms main trend alignment.
Volume Pressure (OBV): Confirms money flow.
Volume Spike (RVOL): Confirms market interest.
A higher score indicates a stronger, higher-conviction signal.
Cerca negli script per "momentum"
Dynamic Momentum Oscillator with Adaptive ThresholdsDynamic Momentum Oscillator with Adaptive Thresholds (DMO-AT)
This advanced indicator is designed to provide traders with a robust tool for identifying momentum shifts, overbought/oversold conditions, and potential reversals in any market. Unlike traditional oscillators with fixed thresholds, DMO-AT uses adaptive levels that adjust based on current volatility (via ATR) and incorporates volume weighting for more accurate signals in high-volume environments.
#### Key Features:
- **Momentum Calculation**: A normalized momentum value derived from price changes, optionally weighted by volume for enhanced sensitivity.
- **Adaptive Thresholds**: Overbought and oversold levels dynamically adjust using ATR, making the indicator adaptable to volatile or ranging markets.
- **Signal Line**: An EMA of the momentum for crossover signals, helping confirm trend directions.
- **Divergence Detection**: Built-in alerts for bullish and bearish divergences between price and momentum.
- **Visual Enhancements**: Background coloring for quick zone identification, dashed static lines for reference, and a customizable stats table displaying real-time values.
- **Alerts**: Multiple alert conditions for crossovers, zone entries, and divergences to keep you notified without constant chart watching.
#### How to Use:
1. Add the indicator to your chart via TradingView's indicator search.
2. Customize inputs: Adjust the momentum length, source, ATR length, and threshold multiplier to fit your trading style (e.g., shorter lengths for scalping, longer for swing trading).
3. Interpret Signals:
- **Crossover**: Momentum crossing above the signal line suggests bullish momentum; below indicates bearish.
- **Zones**: Entering the overbought (red) zone may signal a potential sell; oversold (green) for buys.
- **Divergences**: Use alerts to spot hidden opportunities where price and momentum disagree.
4. Combine with other tools like moving averages or support/resistance for confluence.
5. Enable the stats table for at-a-glance insights on the chart.
This indicator is versatile across timeframes and assets, from stocks to crypto. It's optimized for clarity and performance, with no repainting.
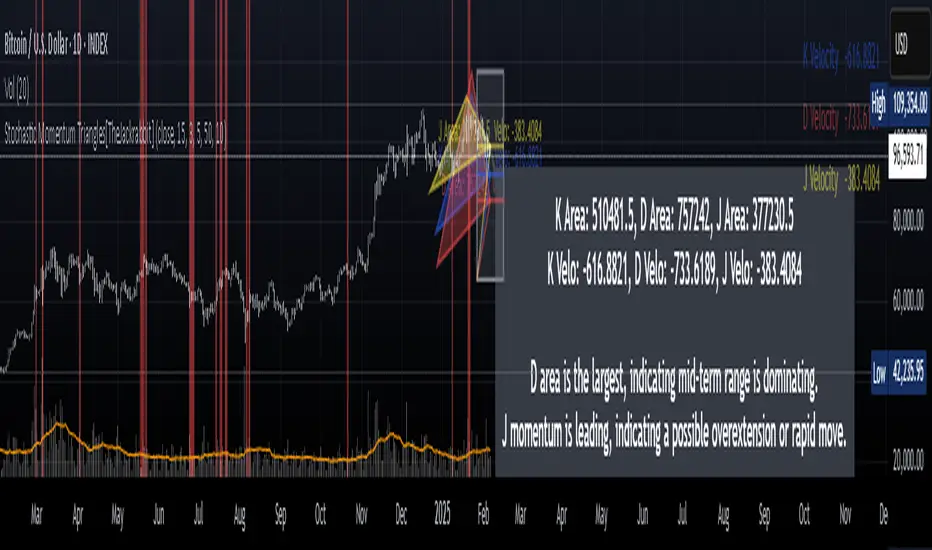
Stochastic Momentum Triangles[TheJackrabbit]This code is invite-only and in the experimental phase. Please contact the author if you are interested in testing.
**Stochastic Momentum Triangles ** is a custom indicator designed to integrate multiple dimensions of market momentum into a single, visual framework. Rather than relying on generic oscillators, this tool brings together stochastic calculations, price mapping, velocity measurement, and dynamic visual feedback to offer a layered view of market conditions.
#### Key Features and Components
- **Stochastic Calculations Mapped to Price Levels**
The indicator starts by computing the traditional stochastic oscillator values—%K, %D, and %J—over a user-defined period. These values are then mapped to the current price range. This mapping is achieved via a dedicated function that uses an exponential moving average and a rounding option, thereby linking momentum metrics directly with price dynamics.
- **Momentum Velocity and Its RSI**
To quantify the rate of change, the script calculates a “velocity” by measuring the difference in the price-mapped stochastic values over a specified lookback period. The resulting velocity values are then processed through a Relative Strength Index (RSI) calculation. This additional layer helps to provide a clearer picture of how rapidly market momentum is changing.
- **Triangle Area Measurement as a Volatility Proxy**
For each of the K, D, and J series, the indicator identifies the highest and lowest values within a user-specified lookback window and constructs triangles by connecting these extremes with the current value. The area of these triangles is computed, serving as an abstract measure of volatility and the range of price momentum. These areas are displayed alongside the velocity readings in an on-chart table for easy reference.
- **Dynamic Interpretation Label**
The tool also generates a concise reading in English that summarizes the relationships among the areas and velocity values. For example, it notes when one series, such as J, exhibits both the largest triangle area and the highest velocity. In such cases—suggesting an extended move or potential overextension—the label’s text color changes (to red) to visually alert the trader to an increased likelihood of a reversal. This approach allows traders to quickly assimilate the indicator’s data without overwhelming them with subjective language.
- **Additional Visual Elements**
Beyond the core calculations, the indicator includes a “momentum box” that captures the range of the stochastic-derived values over recent bars, as well as radial lines that provide a visual connection from the box’s reference point to current values. These elements together offer a structured, multi-faceted view of market dynamics.
#### Significance and Effects
This indicator takes a measured approach to integrating multiple aspects of market analysis. By combining price-based mapping with traditional stochastic and momentum measurements, it provides traders with:
- **A structured framework** to assess market range and momentum changes.
- **Visual cues** (such as the dynamic label and color changes) that highlight conditions warranting closer attention.
- **Tangible, calculated metrics**—triangle areas and velocity RSIs—that may assist in identifying potential reversal points.
Stochastic Momentum Triangles is intended to serve as a supplementary tool for traders who appreciate a quantitative perspective on market behavior. Its design focuses on clear, measurable outputs rather than relying on broad claims, allowing for a calm and thoughtful evaluation of market conditions.
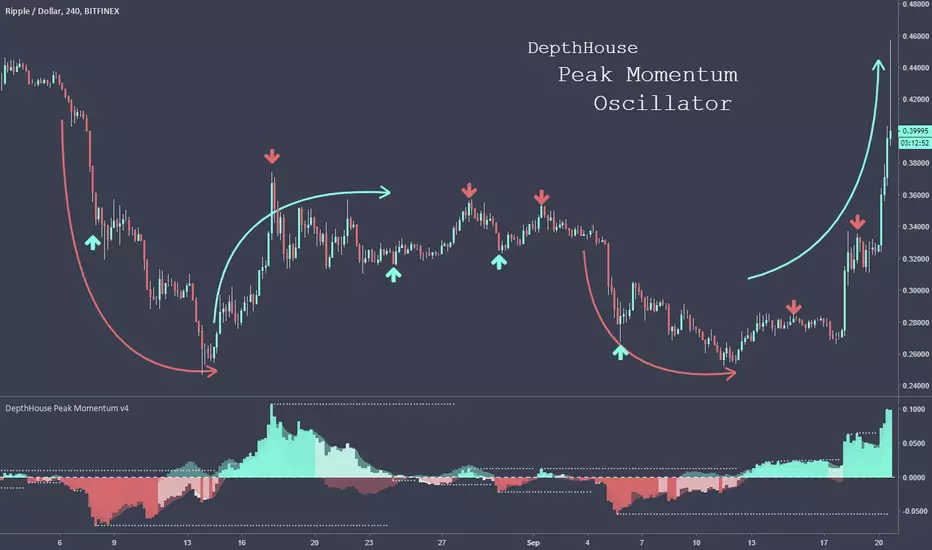
DepthHouse - Peak Momentum OscillatorDepthHouse Peak Momentum Oscillator uses advance calculations of linear regression to help determine price momentum and momentum peaks.
How to read it:
The least opaque columns represent general momentum direction.
When these columns are above the zero line, generally there is more bullish momentum in the market.
When they are below the zero line, generally there is more bearish momentum in the market.
When these columns turn white, it means the price could be losing its bullish or bearish momentum.
The more transparent columns in the background represent the lead band, which reacts faster than the general momentum columns.
This could be used to as a leading indication of where the market could be heading.
Swap Momentum Bands option:
This option removes the white columns from the general momentum histogram and in turn only gives signals when strong momentum is present.
How to use this Indicator:
For 30 days from this release (9/20/18) this indicator will be free to use! Either leave a comment below or feel free to send me a PM
After the 30 days from the release you can still
try this indicator for FREE! Just leave a comment, or feel free to send me a PM
PRO MomentumINVITE ONLY SCRIPT:
FEATURES:
As its name suggests, PRO Momentum provides non-subjective momentum analysis to traders through automatic pattern detections, covering a wide range of statistically relevant structures in both ranging and trending contexts. Our goal was to provide a professional grade risk management tool capable of providing various signals, which guide the trader in its decision to engage or not in a certain price area filtered by Framework. Nevertheless, both indicators are complex tools requiring extensive learning. To support students in their journey, there is a wide open online community of users in our Discord channel, providing peer-to-peer assistance to progress with the strategy as well as tutored courses.
OUTPUTS:
To share a brief description of the PRO Momentum functioning, we will scroll through the major set of outputs that are presented to the user. Please note that the indicator is meant to assist from Junior to Senior expertise, to achieve this we have set different base templates right into the indicators. To keep this description simple, we will present the outputs you’ll see with the beginner setup:
Momentum Signals: As shown on the chart, there are multiple types of output signals, each corresponding to different momentum patterns. Detailed documentation is available on our website for those seeking in-depth information. Here's a high-level overview: The patterns are divided into three categories, each represented by different colors. Blue and Red signals are used in trending contexts, Gray signals are for ranging contexts, and dark-colored signals are exclusive to reversal contexts, suitable for more experienced traders. Momentum signals are binary outputs, making it easy for users to set alerts. The indicator includes built-in alerts for these groups to streamline the process. However, it’s crucial to remember that momentum signals are not standalone trading signals. The Framework indicator must first filter interesting prices and identify the context. Only then should traders use momentum signals to adjust risk.
Sinewave Oscillators: Cyclical analysis is a critical aspect of professional risk management. Markets naturally oscillate, and significant statistical probabilities can be derived from cycle studies. We use a custom-modified version of Ehlers’ sinewave methodology. Cyclical analysis, while somewhat predictive, scans past prices to predict probable future states. Since markets are inherently unpredictable, cycle analysis is used as a confirmation signal in our strategy. Essentially, we filter out all momentum signals that occur outside favorable cyclical conditions. Bearish signals are only exploited if the sinewave is in the top area of the oscillator, and vice-versa for bullish signals.
GENERAL STRATEGY:
Overall, the PRO Strategy combines two “core” indicators, Framework and Momentum. Framework is plotted on the main chart section as an overlay, it is definitely the most important as it guides the user through the hard process of filtering prices and timeframes that are suitable for technical analysis. On the other hand, PRO Momentum is on a separate oscillator tab under the chart section, it will study the momentum and cyclical structure, also offering automated pattern detection. Ultimately, our strategy is based on collecting and processing non-subjective rules, emanating from the indicators outputs. Essentially, this means that the indicator actually takes care of producing all the necessary binary outputs, leaving you with the remaining task of combining them correctly following the strategy’s patterns.
RISK LIMITATION:
Even if we provide automated momentum signal detection, there is no “one-click” or "easy-win” solution, the user still needs to carefully review the elements. When applicable pattern rules are confirmed, the user will gather risk-limitation information from both indicators (breakout targets, price confirmations, momentum and cyclical coordination) and decide whether or not to trade according to its own risk profile. If so, the position sizing, stop-loss positioning, risk management and profit targets will all be defined according to the same indicator’s outputs. This effectively suppresses most behavioral and personal biases the trader could introduce, creating a stable and statistical risk management structure aiming for a durable profitability.

Momentum Master v1# Momentum Master v1 - Multi-Strategy Trading System
## SCRIPT OVERVIEW
Momentum Master v1 is a multi-strategy trading system that integrates 6 distinct trading methodologies (EMA Crossover, RSI Mean Reversion, Breakout, MACD Crossover, Bollinger Bands, Volume Breakout) through a shared risk management pipeline. This script implements a proprietary integration framework that creates synergistic value beyond what individual indicators provide, combining advanced technical analysis techniques with institutional flow analysis.
## TECHNICAL METHODOLOGY
### Multi-Strategy Signal Generation Framework
The script operates on a shared execution framework where all six trading strategies share the same risk management system, but each strategy uses its own unique entry logic:
1. **EMA Crossover System**: Detects momentum shifts using configurable fast/slow EMA periods (Standard 9/21, Fast 7/17, Slow 13/26, or Custom)
2. **RSI Mean Reversion**: Identifies overbought/oversold conditions for counter-trend opportunities
3. **Breakout Detection**: Captures price breakouts from consolidation zones
4. **MACD Crossover**: Uses MACD line crossovers to confirm trend changes
5. **Bollinger Bands**: Trades bounces from band extremes and breakouts
6. **Volume Breakout**: Confirms moves with above-average volume
**Why This Integration Creates Unique Value:**
This is not a simple indicator mashup. The proprietary integration framework creates synergistic value through:
- **Shared Risk Management**: All strategies share ATR-based stop loss calculation and multiple take profit levels (TP1-TP6 with ratios 1:2, 1:4, 1:6, 1:8, 1:10, 1:12)
- **Adaptive Confidence Scoring**: The system evaluates market context from multiple perspectives simultaneously
- **Shared Filter System**: Optional filters (RSI extremes, ADX trend strength, Volume confirmation, POC proximity) apply uniformly across all strategies
## FLOW ANALYSIS INTEGRATION
### Fair Value Gap (FVG) Retracement Validation
The script implements proprietary FVG detection with retracement validation logic:
- **200-bar lookback** with **20% ATR tolerance** for gap identification
- **Retracement confirmation**: Signals can require price to retrace into a recent FVG before entry (optional filter)
- **Size filtering**: Only displays FVGs above minimum ATR threshold (configurable)
- **Visual tracking**: Shows last N FVGs with color-coded boxes (bullish green, bearish red)
**How FVG Integration Enhances Strategy Signals:**
When a strategy generates a signal, the FVG system validates whether price has recently retraced into an institutional order flow gap. This adds a layer of confirmation that the move is supported by institutional activity, not just retail momentum.
### Order Block Detection with Directional Alignment
- **Institutional accumulation/distribution zones**: Identifies the last bullish/bearish candle before a significant move
- **Directional filter**: Optional setting to only allow trades aligned with the most recent order block direction
- **ATR-based size filtering**: Filters out noise by requiring minimum order block size
- **Visual display**: Shows order blocks as colored boxes extending N bars forward
**Integration Logic:**
Order blocks represent areas where institutions accumulated or distributed positions. When a strategy signal occurs near an order block, it indicates higher probability that the move will continue in the block's direction.
### Multi-Timeframe POC (Point of Control) Analysis
The script calculates and displays POC levels from multiple timeframes:
- **Volume Profile POC**: Highest volume price over last N bars (configurable lookback)
- **Session POC**: Point of control for current trading session
- **Daily POC**: Daily volume-weighted average price
- **Weekly POC**: Weekly volume-weighted average price (optional)
**POC Proximity Filtering:**
Optional filters allow signals only when price is within X ATR of a POC level. This ensures entries occur at statistically significant price levels where liquidity is concentrated.
## FIBONACCI EXTENSION SYSTEM
### Dynamic Fibonacci Calculation
- **Swing-based detection**: Automatically identifies swing highs and lows using configurable lookback period
- **Extension levels**: Calculates Fibonacci extension levels (0.618, 0.786, 1.0, 1.272, 1.414, 1.618, 2.0, 2.618)
- **Retracement levels**: Shows standard retracement levels (0.236, 0.382, 0.5, 0.618, 0.786)
- **Negative levels**: Optional negative Fibonacci levels (-0.27, -0.618) for extended targets
**How Fibonacci Enhances Risk Management:**
Take profit levels are automatically calculated using Fibonacci extension mathematics. The system identifies the swing structure and projects potential reversal zones, allowing traders to set targets based on mathematical probability rather than arbitrary price levels.
## LIQUIDITY ZONE DETECTION
### Buy and Sell Side Liquidity
- **Swing-based liquidity zones**: Identifies recent swing highs (sell-side liquidity) and swing lows (buy-side liquidity)
- **Configurable lookback**: Adjustable period for liquidity zone detection
- **Visual display**: Horizontal lines extending N bars forward to show liquidity targets
- **Maximum zones**: Limits display to most recent N zones to avoid chart clutter
**Trading Application:**
Liquidity zones represent areas where stop losses are likely clustered. Price often moves to "sweep" these liquidity zones before reversing, creating high-probability entry opportunities.
## RISK MANAGEMENT SYSTEM
### ATR-Based Stop Loss Calculation
- **Dynamic stop placement**: Stop loss calculated using ATR (Average True Range) with configurable multiplier
- **Adaptive to volatility**: Stop loss automatically adjusts to current market volatility conditions
- **Configurable ATR period**: Default 14-period ATR, adjustable from 5-30 periods
- **SL multiplier**: Adjustable from 0.5x to 10x ATR for different risk profiles
### Multiple Take Profit Levels
The system supports up to 6 take profit levels with fixed risk-reward ratios:
- **TP1**: 1:2 risk-reward ratio
- **TP2**: 1:4 risk-reward ratio
- **TP3**: 1:6 risk-reward ratio
- **TP4**: 1:8 risk-reward ratio (optional)
- **TP5**: 1:10 risk-reward ratio (optional)
- **TP6**: 1:12 risk-reward ratio (optional)
**Why Multiple TP Levels:**
This allows partial profit-taking at key Fibonacci extension levels while letting winners run. The system tracks win rates for each TP level, helping traders optimize their exit strategy.
## SIGNAL FILTERS (OPTIONAL ENHANCEMENTS)
### RSI Extreme Filter
- **Avoid overbought/oversold extremes**: Prevents entries when RSI is in extreme zones (default: >70 overbought, <30 oversold)
- **Configurable thresholds**: Adjustable RSI levels and calculation period
- **Purpose**: Reduces false signals in exhausted moves
### ADX Trend Strength Filter
- **Avoid choppy markets**: Only allows trades when ADX indicates trending conditions (default: ADX > 20)
- **Configurable threshold**: Adjustable ADX minimum value (10-50)
- **Purpose**: Filters out low-probability trades in ranging markets
### Volume Confirmation
- **Volume multiplier**: Requires volume above X times average (default: 1.1x)
- **Purpose**: Ensures moves are supported by institutional participation
### POC Proximity Filters
- **Volume POC filter**: Only enter when price is near Volume Profile POC
- **Session POC filter**: Only enter when price is near Session POC
- **Daily POC filter**: Only enter when price is near Daily POC
- **Weekly POC filter**: Only enter when price is near Weekly POC
- **Proximity threshold**: Configurable ATR multiplier for "near" definition (default: 2.0x ATR)
---
## DIVERGENCE DETECTION
### MFI (Money Flow Index) Divergence
- **Bullish divergence**: Price makes lower low, MFI makes higher low (potential reversal up)
- **Bearish divergence**: Price makes higher high, MFI makes lower high (potential reversal down)
- **Configurable lookback**: Adjustable period for divergence detection (default: 100 bars)
- **Minimum bars between divergences**: Prevents duplicate signals (default: 10 bars)
- **Advanced thresholds**: Separate thresholds for RSI, price, and MFI divergence strength
**Note**: Divergence detection is visual-only and does not filter trades. It provides additional market context for discretionary traders.
## MARKET CONTEXT TOOLS
### Session High/Low Lines
- **Recent session extremes**: Displays horizontal lines for session high and low
- **Configurable lookback**: Adjustable period for session calculation (default: 10 bars)
- **Purpose**: Identifies key intraday support/resistance levels
### Swing Point Detection
- **Automatic swing identification**: Marks significant swing highs and lows
- **Visual reference**: Helps identify market structure and trend direction
### Signal Overview Table
Real-time technical analysis overview:
- **Current RSI**: Relative Strength Index value
- **ATR**: Current Average True Range
- **ADX**: Average Directional Index (trend strength)
- **EMA status**: Current fast/slow EMA relationship (Bullish/Bearish/Neutral)
- **POC levels**: Current price relative to POC levels
- **Confidence score**: Calculated confidence percentage based on confluence
- **Volume trend**: Current volume trend direction
## CHART DISPLAY OPTIONS
### Entry/SL/TP Lines
- **Visual trade management**: Displays entry price, stop loss, and all take profit levels as horizontal lines
- **Configurable length**: Lines extend N bars forward (default: 30 bars)
- **Color-coded**: Different colors for entry, stop loss, and each TP level
### Win/Loss Labels
- **Trade verification**: Displays up to 500 individual win/loss labels on chart
- **Visual feedback**: Green labels for wins, red labels for losses
- **Performance tracking**: Helps verify strategy performance visually
## USAGE INSTRUCTIONS
### Initial Setup
1. **Select Strategy Mode**: Choose your preferred trading strategy from the dropdown (EMA Crossover, RSI Mean Reversion, Breakout, MACD Crossover, Bollinger Bands, Volume Breakout, or Disabled)
2. **Configure Risk Management**:
- Set ATR Length for stop loss calculation (default: 14)
- Set SL ATR Multiplier (default: 1.0)
- Enable additional TP levels if desired (TP4-TP6 are optional)
3. **Adjust Strategy Parameters**: Each strategy has its own settings group. Configure EMA periods, RSI settings, MACD parameters, etc., based on your selected strategy.
### Recommended Settings by Market Type
**Forex/Crypto (High Volatility)**:
- EMA Mode: Fast (7/17) or Custom (3/21)
- SL ATR Multiplier: 1.5-2.0
- Enable FVG retracement filter
- Enable Order Block directional filter
**Stocks (Moderate Volatility)**:
- EMA Mode: Standard (9/21)
- SL ATR Multiplier: 1.0-1.5
- Enable ADX filter to avoid choppy markets
- Enable Volume confirmation
**Indices (Lower Volatility)**:
- EMA Mode: Slow (13/26)
- SL ATR Multiplier: 0.8-1.2
- Enable POC proximity filters
- Enable RSI extreme filter
### Advanced Configuration
1. **Enable Optional Filters**: Navigate to "Signal Filters" section and enable filters that match your trading style
2. **Configure Market Analysis Tools**: Adjust FVG, Order Block, Fibonacci, and POC settings in their respective sections
3. **Customize Display**: Toggle chart display options to show/hide various elements based on your preference
---
## WHY THIS INDICATOR COMBINATION CREATES UNIQUE VALUE
### Multi-Layered Confluence Analysis
This script is not a simple indicator mashup. It implements a proprietary integration framework that creates synergistic value through three layers of analysis:
**Layer 1: Fibonacci Mathematics**
- Golden Zone identification (61.8%-78.6% retracement zone) using three-point trend-based calculation
- Extension targets based on swing structure mathematics
- Statistically significant retracement areas where price is likely to reverse
**Layer 2: Institutional Flow Analysis**
- Fair Value Gaps (FVGs) identify order flow gaps where price must return
- Order Blocks mark institutional accumulation/distribution zones
- Multi-timeframe POC analysis shows where liquidity is concentrated
- Liquidity zones identify where stop losses cluster
**Layer 3: Multi-Strategy Signal Generation**
- Six different entry methodologies provide multiple perspectives
- Shared risk management ensures consistent position sizing
- Adaptive confidence scoring evaluates confluence from all three layers
- Optional filters allow customization for different market conditions
### Proprietary Integration Framework
The unique value comes from how these components work together:
1. **Strategy generates signal** → 2. **FVG/Order Block validates institutional support** → 3. **POC confirms liquidity level** → 4. **Fibonacci provides target zones** → 5. **Risk management calculates optimal SL/TP placement**
This creates a complete trading system, not just a collection of indicators.
---
## TECHNICAL SPECIFICATIONS
- **Pine Script Version**: v6
- **Chart Type**: Overlay (displays on price chart)
- **Max Bars Back**: 5000 (for historical analysis)
- **Max Labels**: 500 (for win/loss tracking)
- **Compatibility**: Works on all timeframes and instruments
- **Performance**: Optimized for real-time execution
---
## DISCLAIMER
This script is a technical analysis tool and does not constitute financial, investment, trading, or other types of advice. Past performance does not guarantee future results. Always use proper risk management and never risk more than you can afford to lose. The script's signals are based on mathematical calculations and should be used in conjunction with your own analysis and risk management practices.
---
## SUPPORT AND ACCESS
This is an invite-only script. To request access:
1. Visit: www.pinescriptedge.com
2. Include your TradingView username and brief trading experience
3. Access will be reviewed and granted within 24 hours
**Note**: TradingView does NOT recommend paying for or using a script unless you fully trust its author and understand how it works. You may also find free, open-source alternatives in our community scripts.
---
## VERSION INFORMATION
**Momentum Master v1** - Initial release with multi-strategy framework and institutional flow analysis integration.
For updates and new features, follow the script or check the author's profile for version announcements.

Momentum BarsMomentum Bars that show increasing momentum (blue bars) and negative momentum (red bars). The goal is to use breaches of the bars to show increased/decreased momentum. I tried to predict future positive momentum bars. These may be less accurate.
Note: This is Version 1, and limited testing has been done, so accuracy cannot be guaranteed will work to improve as time goes on.

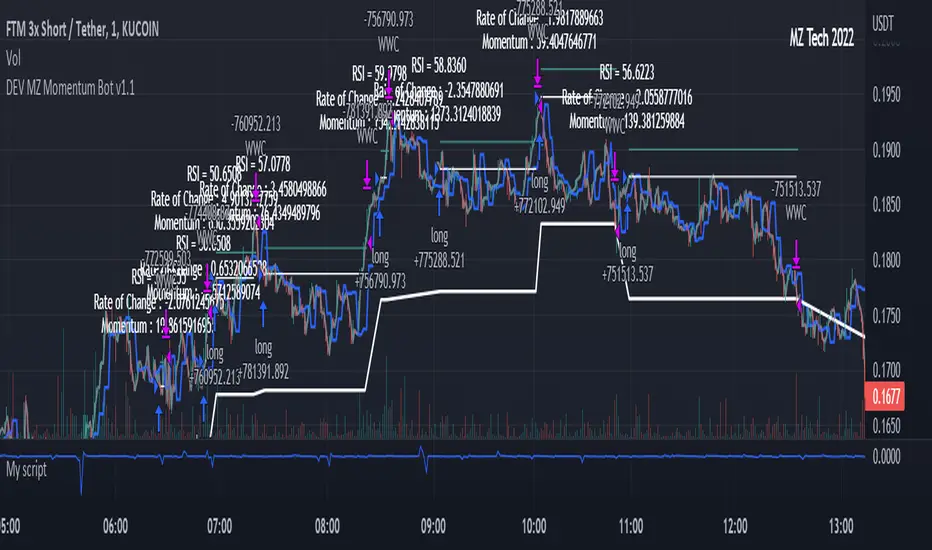
MZ Momentum Non Repainting HTF HFT Scalper BotThis is an original script meant to be a high frequency trader that works on higher time frame calculations. I came up with the idea that using calculus I can figure out the actual rate of change and momentum with different calculations than the momentum indicator that is provided by trading view. Once momentum is shifted on a small time frame, it will provide an entry signal. The script is meant to be used on an algorithmic trading system for scalping purposes. It should be run on a one minute time frame.
Set it up on a one minute chart - setup your bot on a one minute interval.
Find the source of your data. You can use any time frame, open, close. high, low, olc4. Open is pretty much guaranteed to not have any repainting issues - although all the other calcs use a custom isbarconfirmed security repaint calculation.
Set your rate of change period - typically I use a one minute time frame for this as well - but set my length fairly long (30-40).
Then set your period for momentum calculation. This will sample the rate of change data to figure out your momentum. I typically try a setting of 6-8. If that doesn't work, try setting it about the same as the rate of change period and add or subtract a few from there.
Unfortunately due to various plotting constraints in Pinescript, you cannot plot the rate of change and momentum and price in the same.
Set your trigger point. I try values -30, -20, -10, 0, 1. Then finesse to get an earlier entry signal. You should account for a slight delay from the signal to the actual entry. Your backtest should test well, but please note that does not gaurantee results. In my findings, I have seen that there is a slight minimal delay between signal to entry and that can make the difference whether your trade is profitable or not.
Use the show data to show you additional data when you are backtesting. This can allow you to try to filter out results or market conditions that do not work. I typically work with the RSI and use the 30 minute and 15 minute RSIs. I make sure that it is trading within a certain band - about 40-75. You can try the inverse and only buy during really low RSI's as well.
Use the enter and close messages to setup your webhook messages. But I recommend to allow the algo trading platform to close the trade for you based on their calcs since that platform knows the actual price level and when it has become profitable.
Filters have been setup for
Moving Average Variants - any time frame, any length.
RSI - Any time frame, any length,
Future Plans: ATR Filter so you can filter out low volatility periods.
Send me a message with any suggestions.
Whale Momentum Wave Oscillator//Credits: @Noldo - Whale Trading System @rumpypumpydumpy - ALMA Ribbons @QuantNomad - Elastic Volume Weighted Moving Average
Composite Indicator, created by taking QuantNomad's EVWMA and using that as input for a variation of rumpypumpydumpy's ALMA Ribbons. Each Ribbon had its sub ribbons summed up and then averaged. The averages were then fed through the ta.rsi and the ta.mom functions giving us our momentum waves. Signal line created from the close value being fed through the ta. ema into the ta.rsi then ta.wma then ta.mom function. Why those in that order? No reason in particular just what I stumbled upon after many variations. I then overlayed Noldo's Whale Trading System to view what "whales" were doing, giving us a good view of when capital is flowing into and out the asset which often contradicts the momentum waves prior to trend changes. Provides a nice visual for how capital is moving along with momentum. Can see when smart money is buying up a big dip or of they seem to still be waiting on the sidelines.

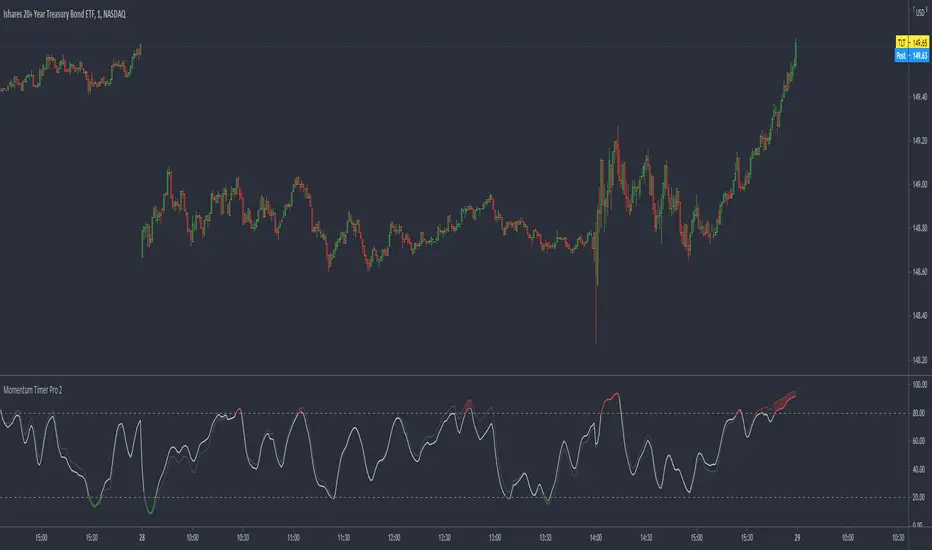
Momentum Timer Pro 2Momentum Timer Pro 2 calculates the momentum of the gradient of two exponential moving averages (one faster and one slower) and puts them through a relative strength index to signal momentum.
You may notice a rhythm to this indicator. Because relative strength indexes naturally drag the output signal toward middle of the range and the input of this indicator is the momentum of a gradient (a momentum indicator within a momentum indicator), the signal may imply an overbought or oversold countertrend condition despite an impulsive trend remaining intact.
This is a lagging indicator and I suggest you use it similarly to a regular RSI.
Enjoy!
Ehlers Smoothed Adaptive Momentum [CC]The Smoothed Adaptive Momentum indicator was created by John Ehlers and this indicator gives a lot of useful information. When the indicator is above 0 then there is very strong upward momentum and when the indicator falls below 0 then there is very strong downward momentum. A very profitable way to use this particular indicator is buy long when the indicator is below 0 and it crosses over it's signal line and then sell of course when you get the first sell signal. I have included strong buy and sell signals in addition to normal ones so darker colors mean strong signals and lighter colors are normal signals. Buy when the line turns green and sell when it turns red.
Let me know if you have any other scripts you would like to see me publish!

[RS][JR]RSI Momentum V1RSI Momentum
By Ricardo Santos and JR
This system is a clash of two indicators, Momentum and RSI. Strength of signals are viewed by both height and color. Dark Green or Light Red bars signal strong momentum. Light Red bar signals and Green bar signals reach an apex at the top of the indicator pane.

Momentum 8% 4% 9MMomentum 8% 4% 9M is a simple yet effective visual indicator designed to highlight significant daily price moves and high volume activity on your stock charts.
Features:
Daily Price Move Highlights:
Background turns green when the daily price gain is equal to or greater than 8%, signaling strong bullish momentum.
Background turns red when the daily price drop is equal to or less than -4%, indicating notable bearish moves.
High Volume Marker:
Displays a small yellow upward triangle below the bar on days when the trading volume exceeds 9 million, helping you easily spot volume spikes.
This indicator provides clear visual cues directly on your price chart, making it easier to spot days of unusual market activity without cluttering your chart with excessive labels. It is ideal for traders looking to quickly identify big moves and volume surges for further analysis or trading decisions.
How it works:
The script calculates the daily percentage change from the previous close and compares it with predefined thresholds (8% up, 4% down). Volume is checked against the threshold of 9 million shares. Appropriate background colors and shape markers are then plotted accordingly.

Stochastic MomentumThis RSI indicator uses the difference between the K and D values in the Stochastic RSI indicator. Using the same layered lengths of 12, 24, 48 and 96 intervals that the Avg Stoch RSI indicator, this offers a rate of change momentum measurement. Crossovers are at zero, this indicator gives a clearer indicator of market momentum.

Super Momentum StrategyThis is a strategy utilizing multiple of Evergets RMI (thanks to him for permission to publish) and a Chance Momentum.
It buys when 4 of the RMIs are below their thresholds and sells when they are above. There is a 5th one I added last night that works in Reverse - buy when its above and sell when below, which should work better for pyramiding strats by using it at the right rate to set the overall trend.
Very basic sample below, I could have set it up better as my example but just want to publish.

Romi Trend and Momentum Oscillator
Great oscillator which determines trend and momentum. So accurate it could be used as a stand alone indicator.

Point of Control + Momentum CandlesPOINT OF CONTROL + MOMENTUM CANDLES
A comprehensive technical analysis indicator combining volume-based Point of Control detection, momentum-graded candle coloring, higher timeframe buy/sell signals, and order block identification.
━━━━━━━━━━━━━━━━━━━━━━━━━━━━━━━━━━━━━━━━━━━━━━━━━━━━━━━━━━━━━━━━━━
WHAT THIS INDICATOR DOES
This indicator identifies key price levels where the most trading activity has occurred (Point of Control), colors candles based on momentum strength, generates buy/sell signals from a user-selected timeframe, and detects order blocks that may act as future support/resistance zones.
━━━━━━━━━━━━━━━━━━━━━━━━━━━━━━━━━━━━━━━━━━━━━━━━━━━━━━━━━━━━━━━━━━
FEATURES
1. POINT OF CONTROL (POC)
The POC represents the price level with the highest traded volume over a lookback period. This indicator calculates a volume profile by distributing volume across price levels and identifying where the most activity occurred.
- Orange horizontal line shows the current POC level
- Yellow box highlights the candles used in the POC calculation
- Break detection identifies when price closes decisively beyond the POC
- Rejection detection identifies when price tests but fails to break the POC
2. MOMENTUM CANDLE COLORING
Candles are colored based on a 6-level momentum system using EMA positioning and RSI values:
Bullish Levels (price above both EMAs):
- Bull Level 3 (Royal Blue): Strong momentum, RSI above 70
- Bull Level 2 (Cyan): Medium momentum, RSI above 60
- Bull Level 1 (Green): Weak momentum, above EMAs
Bearish Levels (price below both EMAs):
- Bear Level 1 (Yellow): Weak momentum, below EMAs
- Bear Level 2 (Orange): Medium momentum, RSI below 40
- Bear Level 3 (Red): Strong momentum, RSI below 30
Neutral (White): No clear directional momentum
3. BUY/SELL SIGNALS
Signals are generated from a user-selectable timeframe (default: 10 minutes) and appear on your current chart. This allows you to see higher timeframe signals while trading on lower timeframes.
Buy Signal Conditions:
- EMA crossover (fast crosses above slow) OR RSI exits oversold
- Bullish candle on the signal timeframe
- Close above both EMAs
Sell Signal Conditions:
- EMA crossunder (fast crosses below slow) OR RSI exits overbought
- Bearish candle on the signal timeframe
- Close below both EMAs
4. ORDER BLOCKS
Order blocks identify potential institutional entry zones that may act as future support or resistance.
- Bullish Order Block (Green zone): The last bearish candle before a bullish impulse move
- Bearish Order Block (Red zone): The last bullish candle before a bearish impulse move
- Blocks automatically extend forward and can be set to delete when mitigated (price closes through the zone)
5. DASHBOARD
A customizable info panel displays:
- Current POC price
- Distance from POC (percentage)
- Position relative to POC (Above/Below/At)
- Lookback period
- Current RSI value
- Current momentum level
- Signal timeframe
- Active order block count
━━━━━━━━━━━━━━━━━━━━━━━━━━━━━━━━━━━━━━━━━━━━━━━━━━━━━━━━━━━━━━━━━━
HOW TO USE
POC Trading:
- Watch for breaks above POC for potential long entries
- Watch for breaks below POC for potential short entries
- Rejections at POC can indicate reversal opportunities
Momentum Reading:
- Use candle colors to gauge trend strength at a glance
- Level 3 colors indicate strong momentum (potential continuation)
- Level 1 colors indicate weakening momentum (potential reversal)
- Neutral/white candles suggest consolidation or indecision
Signal Confirmation:
- Use buy/sell signals from a higher timeframe to confirm entries on your trading timeframe
- Combine signals with POC breaks/rejections for higher probability setups
Order Block Strategy:
- Look for price to return to bullish order blocks for potential long entries
- Look for price to return to bearish order blocks for potential short entries
- Mitigated blocks (price closes through) lose their significance
━━━━━━━━━━━━━━━━━━━━━━━━━━━━━━━━━━━━━━━━━━━━━━━━━━━━━━━━━━━━━━━━━━
SETTINGS OVERVIEW
POC Settings:
- Lookback Period: Number of bars for POC calculation (default: 20)
- Volume Resolution: Price level granularity (default: 50)
- Recalculation Frequency: How often POC updates (default: every 3 bars)
Break/Rejection Detection:
- Break Threshold: Minimum percentage move to confirm a break (default: 0.3%)
- Rejection Wick Ratio: Minimum wick-to-body ratio for rejections (default: 0.5)
Momentum Settings:
- Fast/Slow EMA lengths for trend determination
- RSI length and threshold levels for momentum grading
Buy/Sell Signals:
- Signal Timeframe: The timeframe used for signal calculation
- Separate EMA and RSI parameters for signal generation
Order Blocks:
- Order Block Timeframe: Timeframe for OB detection
- Max Blocks Per Side: Limits displayed order blocks
- Delete Mitigated: Automatically removes invalidated blocks
All visual elements (colors, sizes, line styles) are fully customizable.
━━━━━━━━━━━━━━━━━━━━━━━━━━━━━━━━━━━━━━━━━━━━━━━━━━━━━━━━━━━━━━━━━━
ALERTS
10 alert conditions are available:
- Bullish/Bearish POC Break
- Bullish/Bearish POC Rejection
- Any POC Break
- Any POC Rejection
- Buy Signal
- Sell Signal
- Bullish Order Block Formed
- Bearish Order Block Formed
━━━━━━━━━━━━━━━━━━━━━━━━━━━━━━━━━━━━━━━━━━━━━━━━━━━━━━━━━━━━━━━━━━
NOTES
- The indicator uses request.security() to fetch data from the signal and order block timeframes. This is designed to work when viewing charts at timeframes equal to or lower than your selected signal/OB timeframes.
- POC calculations are based on the visible volume data. Assets with limited volume data may produce less reliable POC levels.
- Order blocks are detected using a simplified algorithm based on candle patterns and displacement. They represent potential zones of interest, not guaranteed support/resistance levels.
━━━━━━━━━━━━━━━━━━━━━━━━━━━━━━━━━━━━━━━━━━━━━━━━━━━━━━━━━━━━━━━━━━
DISCLAIMER
This indicator is provided for educational and informational purposes only. It does not constitute financial advice or a recommendation to buy or sell any security. Trading involves substantial risk of loss. Past performance is not indicative of future results. Always conduct your own analysis and consider your risk tolerance before making trading decisions. Use this tool as part of a comprehensive trading strategy, not as a standalone signal generator.

Momentum Pro [FluxQuant]Momentum Pro — Adaptive Momentum & Regime Filter
Overview
Momentum Pro is a next-generation oscillator that combines rate-of-change (ROC), relative-strength (RSI), and stochastic-momentum frameworks into a unified adaptive model. It dynamically filters momentum through volatility, directional-movement, and trend-strength conditions to highlight only qualified signals in changing market regimes.
🔹 Key Features
Selectable Core Algorithm: Choose between ROC, RSI, or Stochastic momentum engines
Adaptive Signal System: Cross-based entries gated by volatility and trend filters
Quality Filters: Volatility, momentum intensity, and directional bias validation
Overbought / Oversold Zones: Automatic detection with background visualization
Multi-Timeframe Sync: Confirm intraday signals with higher-timeframe momentum
Divergence Scanner: Pivot-based detection of regular bullish / bearish divergences
Smart Dashboard: Real-time summary of market state, momentum strength, and filter status
Dynamic Visual Themes: Gradient, Premium, and Glassmorphism histogram modes
🧠 How It Works
Momentum Pro calculates normalized momentum using your selected algorithm and applies layered filters to ensure that only statistically significant moves are emphasized.
The volatility filter measures current vs. average ATR to confirm expansion.
The trend filter assesses DI +/ DI – differentials for directional bias.
The momentum gate suppresses signals during consolidation or low-range conditions.
Optional higher-timeframe data aligns local momentum with broader bias for cleaner entries.
When these filters agree, momentum crossovers or divergences are visually highlighted as potential study points — not trade instructions.
📈 Interpreting the Dashboard
Field Meaning
Market State Identifies current regime (Bullish, Bearish, Overbought, Oversold, Ranging)
Momentum Current oscillator value (0–100 normalized scale)
Change Recent acceleration / deceleration in momentum
Filter Whether volatility and trend criteria are satisfied
Signal Active cross or directional alignment
Trend / Vol / Intensity Strength metrics (Elite mode)
HTF Sync Confirms alignment with higher-timeframe momentum bias
Use the dashboard as a contextual overlay — not as a mechanical signal generator.
🧩 Configuration Guide
Algorithm: Select ROC for reactive speed, RSI for balanced smoothness, or Stochastic for cyclical range focus.
Signal Line: Enable to visualize crossovers. “Glow” style enhances contrast for clarity.
Filters: Keep “Enable Filter” active to limit noise. Adjust Volatility & Trend thresholds for sensitivity.
Zones: Use background fills to mark overbought / oversold regions and regime shifts.
Divergence: Turn on for automatic pivot-based divergence marking.
Multi-Timeframe: Enable HTF confirmation to study alignment with larger trend context.
Dashboard: Choose Minimal → Elite modes depending on information density preference.
🧭 Best Practices
Works on all markets — equities, futures, crypto, FX
Ideal for 15 m – 4 h – Daily timeframes
Pairs well with structure or liquidity analysis for confirmation
Use filters to isolate expansion phases; avoid trading during neutral states
⚠️ Disclaimer
Momentum Pro is an educational and analytical tool intended for research and visualization only.
It does not provide financial advice, trade signals, or guaranteed outcomes.
Always conduct independent analysis and risk assessment before making trading decisions.
🛠 Release Notes
v 1.0 — Initial Public Release
Multi-algorithm momentum core (ROC / RSI / Stochastic)
Volatility + trend quality filter system
Multi-timeframe synchronization and ribbon overlay
Divergence scanner and contextual dashboard
Dynamic visualization modes

Multi Momentum 10/21/42/63 — Histogram + 2xSMAMY MM INDICATOR INDIRED BY KARADI
It averages four rate-of-change snapshots of price, all anchored at today’s close.
If “Show as %” is on, the value is multiplied by 100.
Each term is a simple momentum/ROC over a different lookback.
Combining 10, 21, 42, 63 bars blends short, medium, and intermediate horizons into one number.
Positive MM → average upward pressure across those horizons; negative MM → average downward pressure.
Why those lengths?
They roughly stack into ~2× progression (10→21≈2×10, 21→42=2×21, 63≈1.5×42). That creates a “multi-scale” momentum that’s less noisy than a single fast ROC but more responsive than a long ROC alone.
How to read the panel
Gray histogram = raw Multi-Momentum value each bar.
SMA Fast/Slow lines (defaults 12 & 26 over the MM values) = smoothing of the histogram to show the trend of momentum itself.
Typical signals
Zero-line context:
Above 0 → bullish momentum regime on average.
Below 0 → bearish regime.
Crosses of SMA Fast & Slow: momentum trend shifts (fast above slow = improving momentum; fast below slow = deteriorating).
Histogram vs SMA lines: widening distance suggests strengthening momentum; narrowing suggests momentum is fading.
Divergences: price makes a new high/low but MM doesn’t → potential exhaustion.
Compared to a classic ROC
A single ROC(20) is very sensitive to that one window.
MM averages several windows, smoothing idiosyncrasies (e.g., a one-off spike 21 bars ago) and reducing “lookback luck.”
Settings & customization
Lookbacks (10/21/42/63): you can tweak for your asset/timeframe; the idea is to mix short→medium horizons.
Percent vs raw ratio: percent is easier to compare across symbols.
SMA lengths: shorter = more reactive but choppier; longer = smoother but slower.
Practical tips
Use regime + signal: trade longs primarily when MM>0 and fast SMA>slow SMA; consider shorts when MM<0 and fast

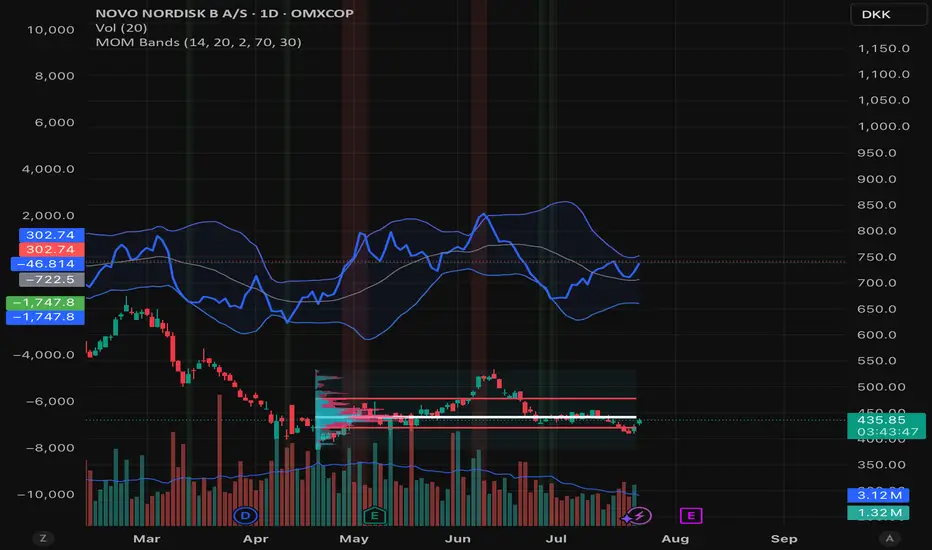
Momentum BandsMomentum Bands indicator-->technical tool that measures the rate of price change and surrounds this momentum with adaptive bands to highlight overbought and oversold zones. Unlike Bollinger Bands, which track price, these bands track momentum itself, offering a unique view of market strength and exhaustion points. At its core, it features a blue momentum line that calculates the rate of change over a set period, an upper red band marking dynamic resistance created by adding standard deviations to the momentum average, a lower green band marking dynamic support by subtracting standard deviations, and a gray middle line representing the average of momentum as a central anchor. When the momentum line touches or moves beyond the upper red band, it often signals that the market may be overbought and a pullback or reversal could follow; traders might lock in profits or watch for short setups. Conversely, when it drops below the lower green band, it can suggest an oversold market primed for a bounce, prompting traders to look for buying opportunities. If momentum remains between the bands, it typically indicates balanced conditions where waiting for stronger signals at the extremes is wise. The indicator can be used in contrarian strategies—buying near the lower band and selling near the upper—or in trend-following setups by waiting for momentum to return toward the centerline before entering trades. For stronger confirmation, traders often combine it with volume spikes, support and resistance analysis, or other trend tools, and it’s useful to check multiple timeframes to spot consistent patterns. Recommended settings vary: short-term traders might use a 7–10 period momentum with 14-period bands; medium-term traders might keep the default 14-period momentum and 20-period bands; while long-term analysis might use 21-period momentum and 50-period bands. Visually, background colors help spot extremes: red for strong overbought, green for strong oversold, and no color for normal markets, alongside reference lines at 70, 30, and 0 to guide traditional overbought, oversold, and neutral zones. Typical bullish signals include momentum rebounding from the lower band, crossing back above the middle after being oversold, or showing divergence where price makes new lows but momentum doesn’t. Bearish signals might appear when momentum hits the upper band and weakens, drops below the middle after being overbought, or price makes new highs while momentum fails to follow. The indicator tends to work best in mean-reverting or sideways markets rather than strong trends, where overbought and oversold conditions tend to repeat.
Pure Price Action Momentum OscillatorComplete Trading Guide: Pure Price Action Momentum Oscillator
1. Script Overview
What It Does
Tracks real-time momentum strength (bullish/bearish acceleration)
Identifies dynamic support/resistance zones for momentum (not price)
Alerts when momentum breaks or holds critical levels
What It Doesn’t Do
Predict long-term trends (use with trend indicators)
Replace price-based S/R levels (use alongside them)
Work well in extreme choppiness (adjust settings or avoid)
2. Key Features & Components
Feature Purpose Visual Cue
Momentum Histogram Shows strength/direction of price acceleration Color-coded bars
Zero Line Bullish/bearish momentum baseline Gray line (0 level)
Support Zone (Blue) Momentum floor where bounces happen Blue horizontal line
Resistance Zone (Orange) Momentum ceiling where pullbacks start Orange horizontal line
Stateful Alerts Persistent signals until conditions reverse Green/Red labels
3. Best Timeframes & Markets
Market Recommended Timeframe Notes
Stocks 5min - 1H Works best with high liquidity
Forex 15min - 4H Avoid during major news spikes
Crypto 1H - 4H Use with volume confirmation
Futures 5min - 1H Ideal for intraday momentum trades
❌ Avoid: Tick charts, <1min (too noisy), >Daily (loses sensitivity).
4. Confirmation Tools (Must-Use Combos)
A. Trend Confirmation
200 EMA (Price Chart)
Only trade longs if price > 200 EMA + momentum supports
Only trade shorts if price < 200 EMA + momentum confirms
ADX (14)
Use when ADX > 25 (strong trend) + momentum aligns
B. Volume Confirmation
Volume Profile
Enter longs only if momentum breaks resistance at high-volume nodes
VWAP
Buy pullbacks when momentum holds support and price is above VWAP
C. Price Structure
Fibonacci Retracements
Look for momentum breaks at 61.8% Fib levels for high-probability trades
Market Structure (Higher Lows/Lower Highs)
Momentum breakouts work best when price confirms trend
5. Trading Signals & Execution Rules
A. Breakout Trades (High Momentum)
Signal Conditions Action
Resistance Broken Histogram > Orange Zone + Price > Key S/R Enter Long
Support Broken Histogram < Blue Zone + Price < Key S/R Enter Short
Stop Loss:
Longs: 1 tick below nearest swing low
Shorts: 1 tick above nearest swing high
Take Profit:
Trail using the opposite zone (exit long when momentum drops below support)
B. Reversal Trades (Momentum Exhaustion)
Signal Conditions Action
Resistance Holding Histogram rejects Orange Zone + Bearish candle Short Entry
Support Holding Histogram bounces off Blue Zone + Bullish candle Long Entry
Stop Loss:
Beyond the recent swing high/low
Take Profit:
At next key S/R level
6. Advanced Interpretation
A. Divergence Trading
Hidden Bullish Divergence:
Price makes higher low, but momentum makes lower low → Potential reversal up
Hidden Bearish Divergence:
Price makes lower high, but momentum makes higher high → Potential reversal down
B. Session-Based Trading
London Open (3 AM EST): Watch for momentum breaks with volume surge
NY Midday (10 AM - 12 PM EST): Best for trend continuation
Crypto (UTC Midnight): Often sees volatility spikes
7. Risk Management & Position Sizing
Risk per trade: 1-2% of account
Leverage: ≤5x for intraday, ≤2x for swing
Avoid trading:
First 15 mins after major news
Low-volume periods (e.g., forex after 5 PM EST)
8. Pro Tips for Consistency
✅ Wait for Close: Don’t trade wicks, wait for candle close beyond zones.
✅ Combine with Price Action: Only trade if momentum aligns with candlestick patterns (e.g., pin bars, engulfing).
✅ Adjust Lookback: Increase in choppy markets, decrease in trends.
9. Limitations & Fixes
Issue Solution
Whipsaws in choppy markets Increase Min Lookback to 30+
Slow reaction in trends Reduce Max Lookback to 50
False breakouts Require volume confirmation
Final Verdict
This script is best used as a momentum filter – not a standalone system. Combine with:
✔ Trend indicators (200 EMA, ADX)
✔ Volume analysis (VWAP, Volume Profile)
✔ Price structure (S/R, Fibs)

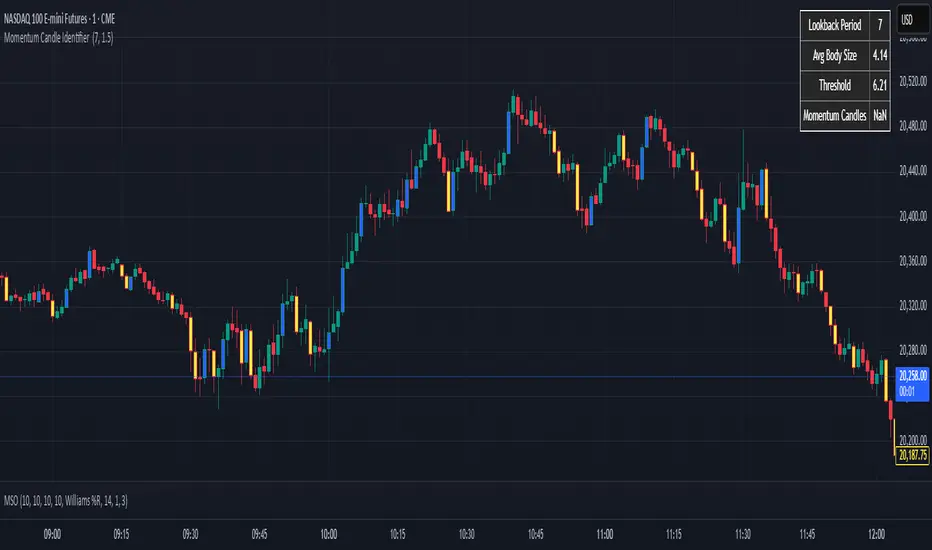
Momentum Candle Identifier # Momentum Candle Identifier
This indicator helps traders identify significant momentum candles by analyzing candle body size relative to recent price action (think after consolidation periods). Unlike traditional volatility indicators, this tool specifically focuses on price movement captured by the candle body (open to close distance), filtering out potentially misleading wicks.
## How It Works
- The indicator calculates the average candle body size over a user-defined lookback period
- Momentum candles are identified when their body size exceeds the average by a customizable threshold multiplier
- Bullish momentum candles (close > open) are highlighted in a user defined color
- Bearish momentum candles (close < open) are highlighted in a user defined color
- A real-time information panel displays key metrics including current average body size and threshold values
## Key Features
- Focus on candle body size rather than full range (high to low)
- Custom lookback period to adapt to different timeframes
- Adjustable threshold multiplier to fine-tune sensitivity
- Customizable colors for bullish and bearish momentum candles
- Optional labels for momentum candles
- Information panel showing lookback settings, average size, and momentum candle count
## Usage Tips
- Use shorter lookback periods (3-5) for more signals in choppy markets
- Use longer lookback periods (8-20) to identify only the most significant momentum moves
- Higher threshold multipliers (2.0+) will identify only the strongest momentum candles
- Combine with trend indicators to find potential reversal or continuation signals
- Look for clusters of momentum candles to identify strong shifts in market sentiment
This indicator helps identify candles that represent significant price movement relative to recent activity, potentially signaling changes in market momentum, sentiment shifts, or the beginning of new trends.
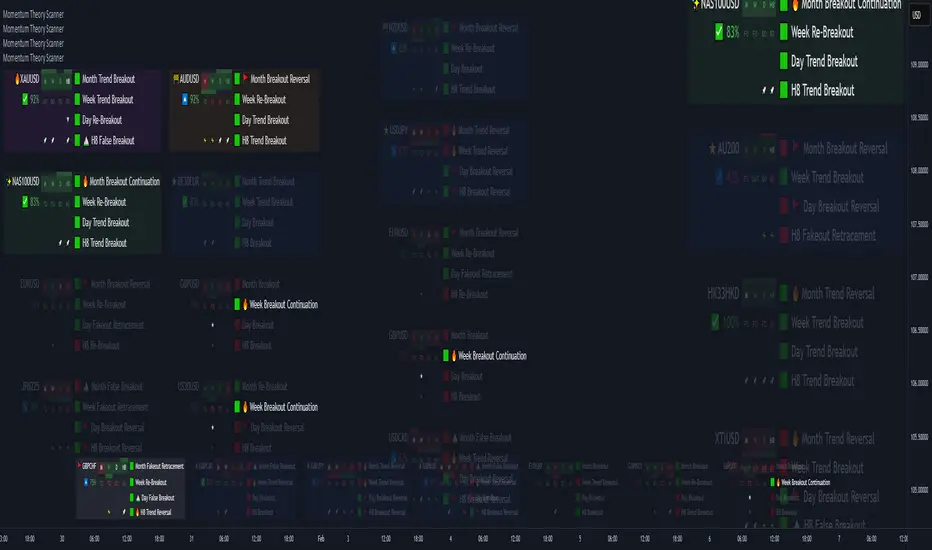
Momentum Theory ScannerMomentum Theory Scanner is a mechanical pattern-recognition watchlist screener that utilizes higher timeframe breakout and peak levels to determine if an asset fits the criteria for a range, continuation, or reversal setup. It searches for ideal higher timeframe conditions that are usually present in high probability setups in order to reduce pre-market analysis time. It can be equally useful for scalpers, day traders, and swing traders.
✅ 8 Symbol Watchlist Scanner
✅ Mechanical Setups for Ranges, Continuations, Reversals
✅ For Scalpers, Day Traders, and Swing Traders
⚠️ Momentum Theory Scanner searches for assets that have the ideal conditions to trade a specific setup. They are NOT signals to be taken blindly without further analysis.
--- 📷 INDICATOR GALLERY ---
--- ⚡ FEATURES ---
✔ Multi-Timeframe Analysis
Displays various higher timeframe information in order to read how an asset is moving with one quick glance. Utilizes icons that serve as visual cues.
Watchlist Pair - Symbol in the watchlist
Setup Type - Shows the icon of what setup has been found ⭐ Trend Breakout
✨ Trend Breakout (Continuation)
🔥 Continuation
🚧 Range
🚩 Reversal
Quick Analysis - Displays bullish / bearish confluence based on breakout / peak bias ↗️↘️ Breakout Bias Alignment
🔼🔽 Peak Bias Alignment
🔀 Breakout and Peak Bias Alignment, but opposite
✅ Breakout and Peak Bias Alignment
Previous Bar Close - Shows how the previous bar closed Breakout
Fakeout
Inside
Outside
Trigger Type - Shows whether there is a peak breakout or fakeout ⚡ Peak Fakeout
🚀 Peak Breakout
Breakout Continuation - Shows if a timeframe has pulled back to the breakout level ▲▼ Counter-Trend Breakout
★ Breakout Continuation
Momentum Cycles - Shows which part of the momentum cycle price is currently in 🚩 Breakout Reversal
⛰️ False Breakout
🔥 Trend Reversal / Breakout Continuation
Breakout / Peak Bias - Shows the breakout level bias and if the peak has been triggered
✔ Levels Analysis
Hover over the symbol name to view which timeframe levels are bullish or bearish and if peak levels have been triggered.
✔ Built-In Presets
Create your own custom watchlist or use one of the built-in ones (using Oanda charts)
It's recommended to use the same source for all assets in your watchlist whenever possible
✔ Plug-and-Play
Automatically changes the relevant levels depending on the viewed timeframe. Just fill in your watchlist, add it to your chart, and start trading!
Set the indicator to the following timeframes to view those setups. When the momentum timeframe's peak is triggered, the watchlist state changes.
Month Timeframe - 12M / 6M / 3M / Month Momentum
Week Timeframe - 6M / 3M / M / Week Momentum
H1 Timeframe - 3M / M / W / Day Momentum
M20 Timeframe - M / W / D / H12 Momentum
M15 Timeframe - M / W / D / H8 Momentum
M10 Timeframe - M / W / D / H4 Momentum
M5 Timeframe - W / D / H8 / H2 Momentum
M3 Timeframe - D / H8 / H4 / H1 Momentum
--- 🧰 WATCHLIST STATES ---
⭐ Trend Breakout Setup
✨ Trend Breakout (Continuation) Setup
🔥 Continuation Setup
🚧 Range Setup
🚩 Reversal Setup
✔ Signal Bar
Ideal conditions to trade this setup are present, but has not met full setup criteria yet
✔ Signal Cycle
Asset has pulled back towards breakout level and possibly getting ready for a continuation
✔ No Setups
--- 💡 MOMENTUM THEORY CONCEPT ---
The best trade setups are found at swing points for 3 reasons:
They are the highest probability point the market will continue pushing.
They provide the best Stop Loss protection.
They offer the greatest Risk-to-Reward.
The goal of trading is to identify when these swing points occur to take the best trade setups.
Every swing point consists of a push towards a peak, a peak formation, and a push away from a peak. There is no way to know how long a push towards or away from a peak will last, but the peak formation can be identified by 2 elements:
A fakeout of a previous peak level
A flip of its last breakout level
We can track the movement of the market by looking at which peak level is triggered relative to its breakout level. How price behaves at the previous peak levels shows where momentum is headed. It continues to build towards a new peak until it fakes out the previous peak level and flips its breakout level, creating a swing point.
Swing points on the higher timeframes show up as multiple swing points on the lower timeframes, but they often won't be moving in sync. When 2 timeframe swing points get in alignment, the market will move smoothly together. You find the lower timeframe swing point the exact same way you find the higher timeframe one.
The market is constantly moving from one swing point to the next in a repeatable cycle. By using higher timeframe breakout levels and peak levels triggered, we can track where we are in this cycle to anticipate its future movement. This is the Momentum Cycle and it repeats itself over and over.
By using the exact same concept, we can identify mechanical alignment patterns on the lower timeframes to create setups that work in every phase of the market cycle. Momentum Theory Scanner searches for these patterns inside the watchlist.
✔ Range Setups
✔ Continuation Setups
✔ Reversal Setups
--- 📝 HOW TO USE ---
⚠ Click on "Indicators > Invite-Only > Momentum Theory Scanner" to add it to your charts.
1) Create your watchlist or use one of the built-in presets and place it on the timeframe you want to scan for setups (see Features above).
Put multiple together if you want more than 8 items in the watchlist. If you don't want to see the price chart, go to "Object Tree and Data Window" and turn off chart visibility.
2) Signal bars / cycles indicate that ideal conditions exist, but are not fully triggered yet. These are the pairs that should initially be focused on.
3) Setups will trigger in real-time and push to the top of the column.
⚠️ Momentum Theory Scanner searches for assets that have the ideal conditions to trade a specific setup. They are NOT signals to be taken blindly without further analysis.