Worm *Public*This Pine Script code is designed to create a custom technical indicator called "Worm" that helps identify trends in the market based on momentum. Let's break down the code and its settings:
Indicator Title and Overlay:
The indicator is named "Worm (Clean)" and is set to be overlaid on the price chart.
Input Settings:
The code defines various input settings, which can be customized by the user. These settings include:
Indicator Settings (e.g., Alpha, Gap)
Backtest Settings (e.g., HighlightCrossovers, ApplyNorm)
Color Settings (e.g., Buy Color, Sell Color, Wait Color)
Location Settings for displaying the indicator above, below, or at the price.
Toggleable Inputs:
These settings allow you to choose whether the momentum indicator should be displayed above, below, or at the price chart. You can also specify the colors for buy, sell, and wait signals.
Indicator Calculations:
The code calculates momentum using various formulas involving the source price data (e.g., open, high, low, close). Momentum values are stored in variables L0, L1, L2, L3, and lrsi.
It also calculates the Color values for the indicator based on certain conditions and user-defined settings.
Bcolor and Scolor are used to determine the color of the plotted indicator based on buy and sell conditions.
Bollinger Bands (BB) and Keltner Channels (KC) Calculation:
The code calculates Bollinger Bands (UpperBB and LowerBB) and Keltner Channels (UpperKC and LowerKC) using the source price data.
It also determines whether the market is in a squeeze (SqzOn) or not (NoSqz) based on the relationship between BB and KC.
Signal Generation:
Buy and sell signals are generated based on various conditions, including momentum values and the squeeze state.
The color of the indicator line is determined based on the buy and sell signals.
LagF Calculation:
The LagF variable is calculated based on certain formulas involving the L0Line, L1Line, L2Line, and L3Line values.
Control Color:
The Color variable is used to control the color of the LagF indicator line based on certain conditions.
Plotting:
The momentum indicator (Val) is plotted on the chart with the specified colors and style.
The LagF indicator (Worm) is also plotted with a dynamic color based on market conditions.
Alerts are triggered when buy or sell signals are generated.
Experimental Section:
This section appears to be left for experimentation and may contain additional code or features.
Overall, this Pine Script code calculates and displays a custom momentum-based indicator called "Worm" on a price chart. It generates buy and sell signals based on momentum and squeeze conditions and allows users to customize various settings, including indicator location and colors. The code is designed for technical analysis and trend identification in financial markets.
Cerca negli script per "momentum"

Slight Swing Momentum Strategy.Introduction:
The Swing Momentum Strategy is a quantitative trading strategy designed to capture mid-term opportunities in the financial markets by combining swing trading principles with momentum indicators. It utilizes a combination of technical indicators, including moving averages, crossover signals, and volume analysis, to generate buy and sell signals. The strategy aims to identify market trends and capitalize on price momentum for profit generation.
Highlights:
The strategy offers several key highlights that make it unique and potentially attractive to traders:
Swing Trading with Momentum: The strategy combines the principles of swing trading, which aim to capture short-to-medium-term price swings, with momentum indicators that help identify strong price trends and potential breakout opportunities.
Technical Indicator Optimization: The strategy utilizes a selection of optimized technical indicators, including moving averages and crossover signals, to filter out the noise and focus on high-probability trading setups. This optimization enhances the strategy's ability to identify favourable entry and exit points.
Risk Management: The strategy incorporates risk management techniques, such as position sizing based on equity and dynamic stop loss levels, to manage risk exposure and protect capital. This helps to minimize drawdowns and preserve profits.
Buy Condition:
The buy condition in the strategy is determined by a combination of factors, including A1, A2, A3, XG, and weeklySlope. Let's break it down:
A1 Condition: The A1 condition checks for specific price relationships. It verifies that the ratio of the highest price to the closing price is less than 1.03, the ratio of the opening price to the lowest price is less than 1.03, and the ratio of the highest price to the previous day's closing price is greater than 1.06. This condition looks for a specific pattern indicating potential bullish momentum.
A2 Condition: The A2 condition checks for price relationships related to the closing price. It verifies that the ratio of the closing price to the opening price is greater than 1.05 or that the ratio of the closing price to the previous day's closing price is greater than 1.05. This condition looks for signs of upward price movement and momentum.
A3 Condition: The A3 condition focuses on volume. It checks if the current volume crosses above the highest volume over the last 60 periods. This condition aims to identify increased buying interest and potentially confirms the strength of the potential upward price movement.
XG Condition: The XG condition combines the A1 and A2 conditions and checks if they are true for both the current and previous bars. It also verifies that the ratio of the closing price to the 5-period EMA crosses above the 9-period SMA of the same ratio. This condition helps identify potential buy signals when multiple factors align, indicating a strong bullish momentum and potential entry point.
Weekly Trend Factor: The weekly slope condition calculates the slope of the 50-period SMA over a weekly timeframe. It checks if the slope is positive, indicating an overall upward trend on a weekly basis. This condition provides additional confirmation that the stock is in an upward trend.
When all of these conditions align, the buy condition is triggered, indicating a favourable time to enter a long position.
Sell Condition:
The sell condition is relatively straightforward in the strategy:
Sell Signal: The sell condition simply checks if the closing price crosses below the 10-period EMA. When this condition is met, it indicates a potential reversal or weakening of the upward price momentum, and a sell signal is generated.
Backtest Outcome:
The strategy was backtested over the period from January 22nd, 1999 to May 3rd, 2023, using daily candlestick charts for the NASDAQ: NVDA. The strategy used an initial capital of 1,000,000 USD, The order quantity is defined as 10% of the equity. The strategy allows for pyramiding with 1 order, and the transaction fee is set at 0.03% per trade. Here are the key outcomes of the backtest:
Net Profit: 539,595.84 USD, representing a return of 53.96%.
Percent Profitable: 48.82%
Total Closed Trades: 127
Profit Factor: 2.331
Max Drawdown: 68,422.70 USD
Average Trade: 4,248.79 USD
Average Number of Bars in Trades: 11, indicating the average duration of the trades.
Conclusion:
In conclusion, the Swing Momentum Strategy is a quantitative trading approach that combines swing trading principles with momentum indicators to identify and capture mid term trading opportunities. The strategy has demonstrated promising results during backtesting, including a significant net profit and a favourable profit factor.

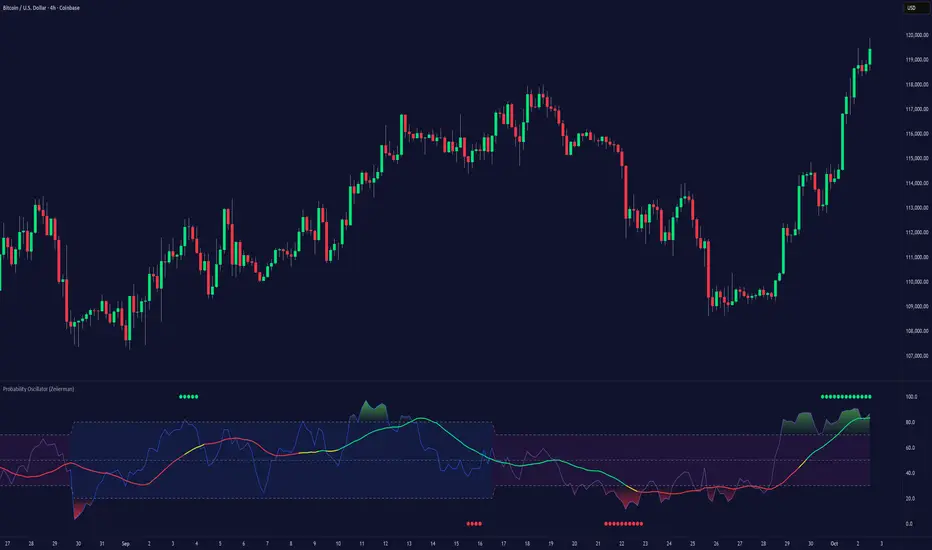
Probability Oscillator (Zeiierman)█ Overview
The Probability Oscillator (Zeiierman) turns price dynamics into a regime-aware probability map of continuation vs. reversal. Rather than treating momentum as a single, fixed signal, it adapts its core estimator to current market conditions—favoring trend persistence in calm regimes and oscillation/reversion in volatile regimes.
You get a fast Probability line, a slower Signal line, dynamic OB/OS bounds, midline bias, color-coded trend probability, background regime cues, and Momentum Impulse dots that reveal concentrated bursts of directional intent. Beneath the surface, the Probability line functions as a sequential Bayesian filter — continuously updating a regime-conditioned prior (trend or volatility) with new market evidence. The resulting posterior odds are then expressed as a bounded oscillator for intuitive interpretation. In stable markets, the prior favors continuity; in volatile markets, it reweights toward mean reversion.
⚪ Why This One Is Unique
The Probability Oscillator operates within a self-adaptive probabilistic framework that continuously reshapes itself in response to the market’s evolving structure. Rather than relying on fixed formulas or static thresholds, it employs a context-aware Bayesian core that interprets flow dynamics through an adaptive regime model.
Its internal architecture blends state recognition, probability normalization, and dynamic envelope mapping, allowing it to adjust between conditions of directional stability and volatility-driven reversion fluidly. The result is an intelligent, self-adjusting probability field that remains stable in trends, reactive in consolidations, and contextually aware across all market states—delivering a refined sense of probabilistic direction without exposing raw computational structure.
█ Main Features
⚪ Probability Oscillator
At the core lies a probability-driven oscillator that continuously adapts its internal weighting to evolving market behavior. It translates incoming price evidence into a smooth probability curve that distinguishes between continuation and reversion phases, providing a refined view of conviction beneath price action.
The Probability Oscillator estimates the likelihood of trend continuation while dynamically adjusting to the surrounding volatility regime:
Probability Line (fast) – Captures short-term probability shifts, weighted by current market conditions — calm or volatile.
Signal Line (slow) – A smoothed probability filter that defines the prevailing bias and confirms directional persistence.
Momentum Impulse Dots – Small markers highlighting bursts of positive (green) or negative (red) momentum, indicating transitions in conviction strength.
The oscillator’s probabilistic framework automatically transitions between two self-adaptive modes:
Low-Volatility Mode – Prioritizes directional momentum and smooth trend continuity, ideal for trending markets.
High-Volatility Mode – Emphasizes oscillatory probability swings and reversals, optimized for range-bound or transitional conditions.
This dual-regime behavior allows the Probability Oscillator to remain stable in directional trends yet responsive in volatile ranges, producing a coherent probabilistic signal across any timeframe.
⚪ Trend Probability Coloring
The Trend Probability Coloring system transforms the Signal Line into a live confidence gauge. Its adaptive hue reflects the underlying probabilistic bias — green for sustained bullish pressure, red for bearish control, and yellow during transitional uncertainty. Behind the scenes, it applies curvature-sensitive weighting and probabilistic smoothing to display a visually coherent measure of directional conviction.
⚪ Impulse Dots
Impulse Dots identify moments of concentrated momentum expansion — short bursts of probabilistic acceleration that often precede shifts in structure. Each impulse represents a localized jump in directional confidence, isolating meaningful change-points from background noise. The result is a precise visualization of where probability and price begin to align, revealing early cues of strength, exhaustion, or imminent rotation.
█ How to Use
⚪ Trend Following
The Signal Line acts as the long-term probabilistic trend gauge, revealing when the market is building or losing directional conviction. Its slope and color communicate both bias and transition strength:
Green → bullish probability bias (trend continuation likely).
Red → bearish probability bias (downside continuation likely).
Yellow → transitional or indecisive phase (potential regime shift).
Use the Signal Line to confirm directional alignment:
A transition from red → yellow → green signals that the market is turning bullish and probability is shifting toward continuation on the upside.
A transition from green → yellow → red signals that bullish conviction is fading and bearish control is emerging.
⚪ Overbought & Oversold
The Probability Oscillator can also be used to identify overbought and oversold conditions by observing when the Probability Line moves above its upper bound or below its lower bound. These events often signal potential market slowdowns, pullbacks, or even broader reversals depending on context and regime.
The OB/OS levels automatically adapt to the prevailing market mode:
Trend Mode (~70/30) – Optimized for riding trends and timing pullbacks within directional continuations.
Volatility Mode (~80/20) – Tailored for fading extremes and capturing fast mean-reversion moves during consolidation phases.
Signals: Reclaims from oversold zones within a bullish bias, or rejections from overbought zones in a bearish bias, represent high-probability inflection points — especially when confirmed by Impulse Dots or regime-aligned Signal Line color transitions.
⚪ Using Volatility Modes to Choose Strategy
The Probability Oscillator automatically adapts its behavior to the active volatility regime, enabling traders to align their approach with the current market state. One of the most effective ways to use the tool is to select a trading strategy that aligns with the prevailing market mode.
Trend Mode (purple fill) – Represents low-volatility, directional environments where markets move smoothly and sustain momentum over time. In these conditions, a trend-following approach is most effective. Focus on the broader direction, participate on Probability-over-Signal crossups above 50, and trail positions as long as the Signal Line remains green. These calm phases often persist before volatility expansion, making them ideal for riding steady continuation waves rather than reacting to short-term fluctuations.
Volatility Mode (blue switch bar) – Activates in high-volatility conditions, signaling increased market agitation and sharper price swings. In this regime, trading becomes more tactical. Mean-reversion and scalping strategies perform best—fade OB/OS extremes, use midline reclaims for timing, or trade Impulse confirmations to capture breakout accelerations and short-term momentum surges.
⚪ Impulse
The Momentum Impulses highlight periods when the market experiences sharp bursts of directional momentum, marking transitions in conviction strength and energy expansion.
Green top dots → Indicate strong bullish impulses, often signaling the onset or acceleration of upward momentum.
Red bottom dots → Indicate strong bearish impulses, highlighting pressure buildup or downside continuation.
These impulses are particularly useful in two contexts:
During ranging markets , they help confirm overbought and oversold conditions, signaling when reversals or exhaustion points are highly probable.
During regime transitions , they validate breakout strength, confirming that new directional phases are supported by genuine momentum rather than noise.
In essence, Impulse Dots visualize the heartbeat of market conviction—pinpointing where momentum surges align with probabilistic bias, whether to confirm a breakout or warn of exhaustion in choppy conditions.
█ How It Works
⚪ Regime Switch Engine
At the foundation lies a Bayesian regime adaptation process that treats volatility as evolving market evidence. The system continuously updates a prior belief about whether the market favors directional persistence or oscillatory reversion. In calm states, it maintains a continuity-biased belief structure that favors smoother probability propagation.
Calculation: Employs a volatility-normalized Bayesian comparator, generating a posterior distribution over regime likelihoods. This ensures the oscillator remains statistically invariant to scale and consistent across instruments and timeframes.
⚪ Trend Probability Coloring (Conviction Layer)
The Trend Probability Coloring system visualizes Bayesian posterior confidence in real time. It continuously updates the Signal Line’s color as new evidence shifts the model’s belief between bullish, neutral, and bearish states.
When the posterior probability leans strongly upward, the line turns green; as uncertainty grows, it fades to yellow; and when conviction turns negative, it transitions to red. Each color change represents a probabilistic reweighting — the model’s evolving assessment of directional dominance.
Calculation: Applies posterior-weighted smoothing and curvature-based confidence mapping to translate Bayesian belief strength into a fluid visual gradient.
⚪ Momentum Impulse Engine
The Momentum Impulse Engine detects sudden bursts in probabilistic conviction — moments when the Bayesian posterior sharply reweights toward one directional outcome. These impulses represent statistically significant shifts in belief, where new evidence rapidly alters the model’s assessment of market direction.
Green impulses highlight surges in bullish probability; red impulses mark spikes in bearish conviction. Each impulse reflects a brief phase of directional dominance, revealing where probability momentum begins to accelerate or exhaust.
Calculation: Employs nonlinear Bayesian change detection and extreme-value gating to isolate abrupt posterior inflections.
-----------------
Disclaimer
The content provided in my scripts, indicators, ideas, algorithms, and systems is for educational and informational purposes only. It does not constitute financial advice, investment recommendations, or a solicitation to buy or sell any financial instruments. I will not accept liability for any loss or damage, including without limitation any loss of profit, which may arise directly or indirectly from the use of or reliance on such information.
All investments involve risk, and the past performance of a security, industry, sector, market, financial product, trading strategy, backtest, or individual's trading does not guarantee future results or returns. Investors are fully responsible for any investment decisions they make. Such decisions should be based solely on an evaluation of their financial circumstances, investment objectives, risk tolerance, and liquidity needs.
Script a pagamento
Price change scalping short and long strategy indicatorPrice change scalping Short and Long indicator uses a rate of change momentum oscillator to calculate the percent change in price between a period of time. Rate of change calculation takes the current price and compares it to a price of "n" periods while the period of time can be defined by a user. The calculated rate of change value is then compared to the upper threshold and the lower threshold values to determine if a position should be opened. If the threshold is crossed and filtering conditions are met a strategy position will be triggered. Entry, take profit, and stop loss prices are calculated and displayed on the chart as well as positions directions. Once the entry price is crossed, a long or short position is created and once the take profit price is crossed, the stop loss price will begin to trail behind the price action using the close of the previous bar. Once the trailing stop price is crossed, the position is closed. If the entry price is not crossed and the price action crosses the stop level, the trade setup is cancelled. The indicator is enhanced by DCA algorithm which allows to average entry price with safety orders. The script also allows to use Martingale coefficient to increase averaging power
Advantages of this script:
The indicator has custom alert settings for each strategy action
The indicator can be used with 3Commas, Cryptohopper, Alertatron or Zignaly bots
High frequency and low duration of trades
Can be used with short-term timeframes ranging from 5 to 60 minutes
Indicator is sustainable to market slumps due to DCA implementation
Can be used for short and long positions (can be adjusted to long only, short only or both)
Can be applied to any market and quote currency
Easy to configure user interface settings
Built in detailed statistic menu
How to use?
1. Apply the indicator to a trading pair your are interested in using 5 to 60 minutes timeframe chart
2. Configure the indicator: change layer values, order size multiple and take profit/stop loss values according to current market cycle stage
3. Set up a TradingView custom alert using the indicator settings to trigger on a condition you are interested in
4. indicator will send alerts when to enter and when to exit positions which can be applied to your portfolio using external trading platforms
5. Update settings once market conditions are changed using backtests on a monthly period
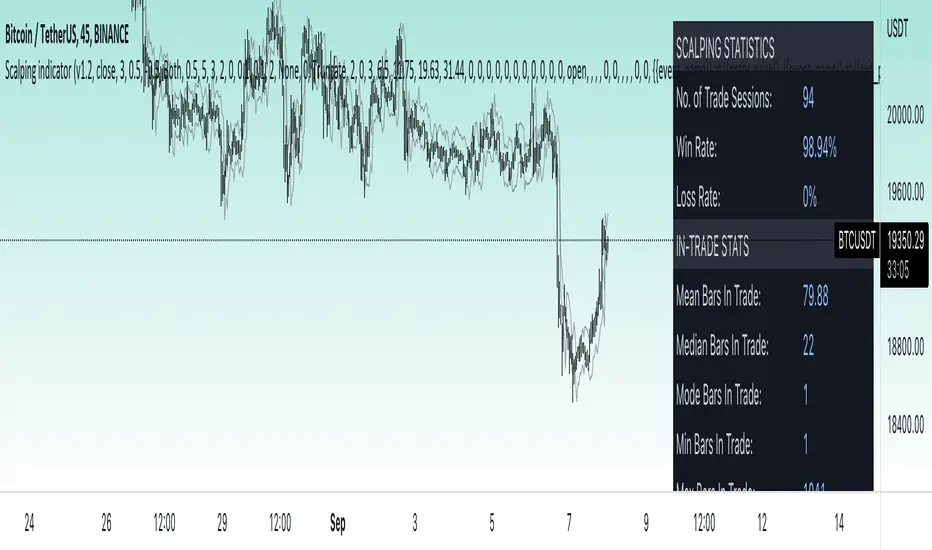
Price change scalping short and long strategyPrice change scalping Short and Long strategy uses a rate of change momentum oscillator to calculate the percent change in price between a period of time. Rate of change calculation takes the current price and compares it to a price of "n" periods while the period of time can be defined by a user. The calculated rate of change value is then compared to the upper threshold and the lower threshold values to determine if a position should be opened. If the threshold is crossed and filtering conditions are met a strategy position will be triggered. Entry, take profit, and stop loss prices are calculated and displayed on the chart as well as positions directions. Once the entry price is crossed, a long or short position is created and once the take profit price is crossed, the stop loss price will begin to trail behind the price action using the close of the previous bar. Once the trailing stop price is crossed, the position is closed. If the entry price is not crossed and the price action crosses the stop level, the trade setup is cancelled. The strategy is enhanced by DCA algorithm which allows to average entry price with safety orders. The script also allows to use Martingale coefficient to increase averaging power
Advantages of this script:
Strategy has high net profit of 293% at backtests
Backtests show high accuracy around 71%
High frequency and low duration of trades
Can be used with short-term timeframes ranging from 5 to 60 minutes
Strategy is sustainable to market slumps due to DCA implementation
Can be used for short and long positions (can be adjusted to long only, short only or both)
Can be applied to any market and quote currency
Easy to configure user interface settings
Built in detailed statistic menu
How to use?
1. Apply the strategy to a trading pair your are interested in using 5 to 60 minutes timeframe chart
2. Configure the strategy: change layer values, order size multiple and take profit/stop loss values according to current market cycle stage
3. Set up a TradingView alert to trigger when strategy conditions are met
4. Strategy will send alerts when to enter and when to exit positions which can be applied to your portfolio using external trading platforms
5. Update settings once market conditions are changed using backtests on a monthly period

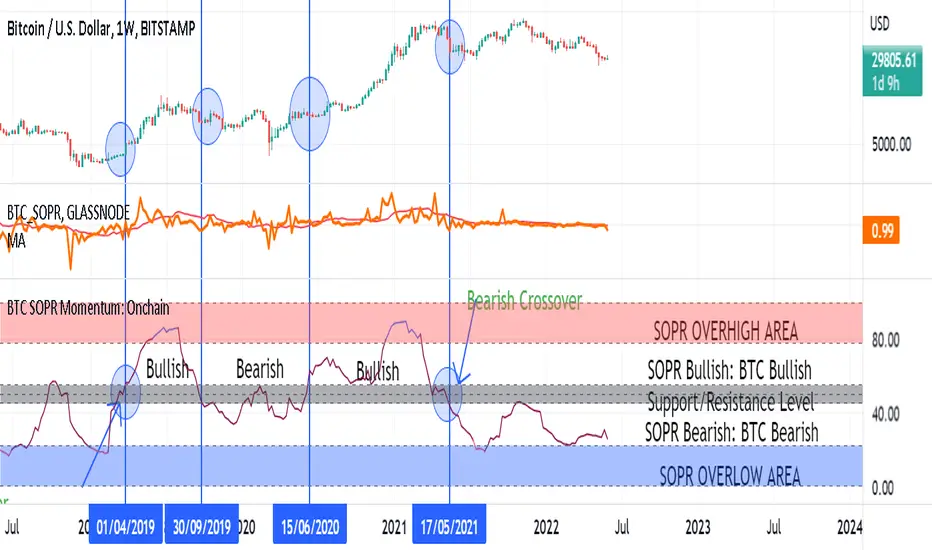
BTC SOPR Momentum: OnchainThis Onchin metric is based on SOPR data
Use this metric on daily and weekly timeframes:
SOPR:
The Spent Output Profit Ratio (SOPR) is computed by dividing the realized value (in USD) divided by the value at creation (USD) of a spent output. Or simply: price sold / price paid. Renato Shirakashi created this metric. When SOPR > 1, it means that the owners of the spent outputs are in profit at the time of the transaction; otherwise, they are at a loss. You can find "SOPR" in tradingview indicators
BTC SOPR Momentum: Onchain
This metric is based on SOPR Momentum. I made some changes to it so that its momentum can be checked.
Interpretation:
If the indicator is above the gray level of resistance/support, bitcoin has an uptrend and Bullish bias
If the indicator is below the resistance/ support level, bitcoin has a downtrend and Bearish Bias
Crossup the gray level is a long signal
Cross-down the gray level is a shorts signal
Entering and exit of the indicator to the overhigh area means creating a top
Entering and leaving the indicator to the overflow area means creating a bottom
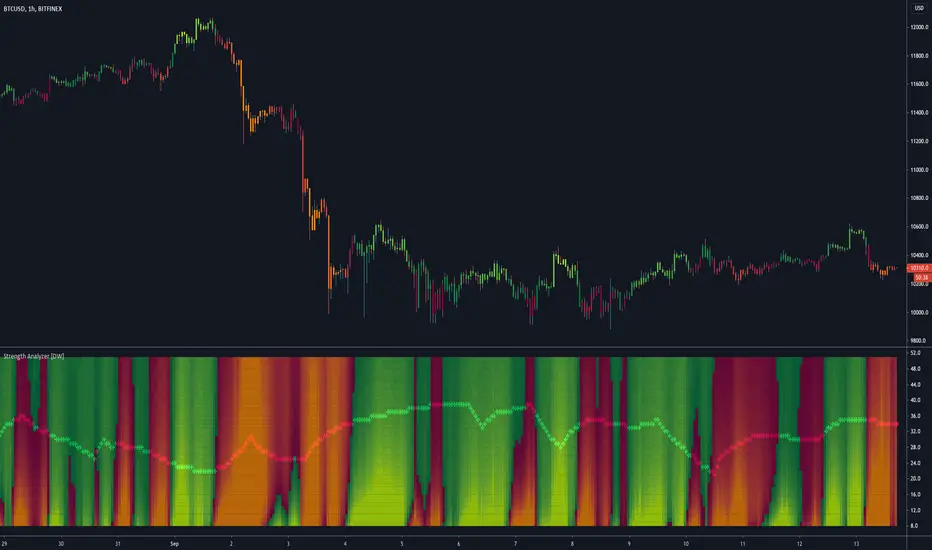
Strength Analyzer [DW]This is an experimental hybrid between relative strength and spectrum analysis methods aimed to deliver useful insights about cyclical dominance and momentum.
This study utilizes a modified RSI formula and a modified Goertzel algorithm to determine relative strength and spectral dominance for periods 8 through 50.
These periods are theorized by many analysts to be the main cyclical components of market movement.
In this study, you are given the option to apply equalization (EQ) to the dataset before estimating strength.
This enables you to transform your data and observe how strength estimates changes as well.
Whether you want to give emphasis to some frequencies, isolate specific bands, or completely alter the shape of your waveform, EQ filtration makes for an interesting experience.
The default EQ preset in this script cuts low end presence, dampens high frequency oscillations, and cleanly passes main cyclic components.
There are many ways to use EQ to transform your dataset, so play around with the settings and find the presets that work best for your analysis setup.
After EQ processing, the data is then passed through the modified RSI algorithm to generate momentum information
The modified RSI in this script is rescaled to oscillate between -1 and 1, and has the option to pass through a 2 pole Butterworth low pass filter before and after processing for a smoother output.
The strength thresholds are determined by the threshold value, which quantifies distance above and below 0.
The threshold value can also be thought of as conventional RSI distance from 50 rescaled so that an increment of 0.1 is equivalent to an increment of 5 on a conventional RSI.
A threshold value of 0.4 is equivalent to thresholds of 70 and 30 on a conventional RSI, so this is the default. The maximum threshold value is 1, which is equivalent to thresholds of 100 and 0.
This script plots colored sections for each period value using a gradient color scheme based on their respective strength estimates.
The color scheme in this script is a multicolored gradient that shows green scaled colors for bullish strength and red scaled colors for bearish strength.
Darker, less vibrant colors indicate lower strength. Brighter, more vibrant colors indicate higher strength.
Strength values near 0 will show the darkest colors, and values near the positive or negative threshold value will show the brightest.
The data is fed parallel through the modified Goertzel algorithm to obtain cyclic power information and to estimate the dominant cycle.
Gerald Goertzel's algorithm is a unique Fourier related transform that identifies tonal properties by quantifying resonance in a set of second order IIR filters with direct-form structure.
It is computationally more efficient than typical DFT or FFT algorithms, and yields decent spectral resolution.
In this variation of the algorithm, data is first passed through a 2 pole high pass filter to attenuate spectral dilation, then passed through a Hamming Window to tidy up the frequency range.
The clean windowed data is then passed through a recursive resonance loop over the frequency block to calculate filter coefficients, which are then used to identify real and imaginary magnitude components.
From there, the magnitude components are used to calculate cyclic power.
The power outputs of each period are then compared for dominant cycle estimation, which is plotted over the gradient.
The dominant cycle can also be optionally smoothed or halved based on your preferences.
Bar colors are included in this script. The color scheme is a gradient based on dominant cycle momentum.
Signals and alert conditions are included in this script as well, and can be customized to your liking.
The two main signal types in this script are:
-> Dominant Cycle - Signals based on dominant cycle or half dominant cycle changes from positive to negative strength or vice versa.
-> Confluence - Signals based on confluence emergence. Based on the majority of measured cycles or all measured cycles showing positive or negative strength.
The signals in this are also externally accessible by other scripts.
The output format is 1 for long signals, and -1 for short signals.
To integrate these signals with your own system, use a source input in your script and assign it to this script's "Direction Signals" output variable from the dropdown tab.
In addition, I included two external output variables that show dominant cycle strength and average cycle strength.
They can be integrated into your own scripts by using a source input and selecting the proper output variable, just like the signals.
The Strength Analyzer is a versatile and powerful analytical tool to have in the arsenal for generating unique insights about momentum and cycle dominance.
By analyzing strength on a spectral basis, we can look at relative price movements on a deeper level and gain insights that aren't necessarily obvious from simply looking at a price chart.
------------------------------------------------
This is a premium script, and access is provided on an invite-only basis.
To gain access, get a copy of the script overview, or for any other inquiries, send me a direct message!
I look forward to hearing from you!
------------------------------------------------
General Disclaimer:
Trading stocks, futures, Forex, options, ETFs, cryptocurrencies or any other financial instrument has large potential rewards, but also large potential risk.
You must be aware of the risks and be willing to accept them in order to invest in stocks, futures, Forex, options, ETFs or cryptocurrencies.
Don’t trade with money you can’t afford to lose.
This is neither a solicitation nor an offer to Buy/Sell stocks, futures, Forex, options, ETFs, cryptocurrencies or any other financial instrument.
No representation is being made that any account will or is likely to achieve profits or losses of any kind.
The past performance of any trading system or methodology is not necessarily indicative of future results.
------------------------------------------------
Note:
Because TV's UI can't handle displaying style options for 43 fills with 42 colors, the color scheme of the analyzer is currently not editable.
However, no other sacrifices to functionality or quality were made in this project.
As the TV team performs updates on the platform, the ability to customize this color scheme will likely come as well.
Also, it's important to note that this script uses a heavy amount of calculations to generate this output.
At times (very infrequently), TV will throw an error message saying "Calculation Takes Too Long", likely due to a momentary lull in available server space.
If you receive this error, simply hide then unhide the indicator, and everything should function as expected.
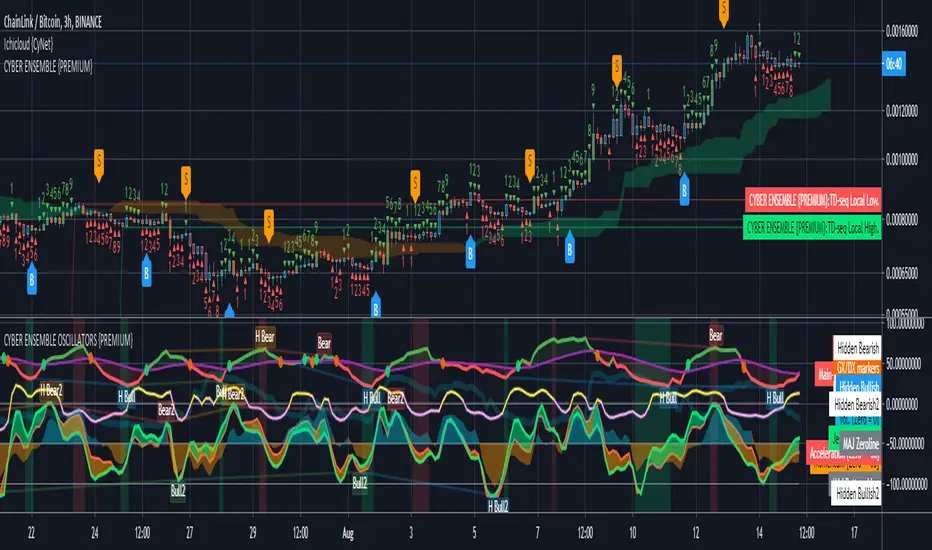
CYBER ENSEMBLE OSCILLATORS {PREMIUM}The CYBER ENSEMBLE OSCILLATORS is a companion to the CYBER ENSEMBLE buy/sell indiator.
It is based on the algorithms powering the PRISM OSCILLATORS SET, where instead of the pRSI, the main-oscillator ( main-osc ) is instead powered by an oscillator modulated by the sophisticated scoring engine of the CYBER ENSEMBLE buy/sell indicator.
In Summary
The Snap oscillator (yellow/pink) pulls the Jerk oscillator (lime), which in turns pulls the Acceleration oscillator (red), which then pulls the momentum oscillator (blue/orange fill). These constitutes the MAJeStic-Oscillators (or the MAJs) which are modulated by the main-osc .
These reveals the underlying movement of the main-osc (green/red). The Stochs of the main-osc (Stoch( main-osc )) is hidden by default, but can be made visible in the settings; and the background color fill/shading (green/red) suggests overbought/oversold states of the Stoch( main-osc ).
See PRISM OSCILLATORS SET for more detailed descriptions of the various derived oscillators modulated by the main-osc .
{PM me in TradingView to arrange subscription access}
RSI Hybrid Momentum (RSI + SMA SHORT + SMA LONG)RSI Hybrid Momentum Indicator
Overview
The RSI Hybrid Momentum Indicator is a custom technical analysis tool designed to enhance traditional RSI readings by incorporating short-, medium-, and long-term momentum signals using SMA overlays. It delivers clear visualization, trend interpretation, and an at-a-glance momentum state table for traders.
This indicator is optimized for dark/black chart backgrounds, offering well-contrasted colors and lightly shaded momentum regimes.
RSI Levels (Demarcation Lines)
Three important RSI thresholds are visually highlighted:
70 — Overbought (Red dashed line)
50 — Midline (Blue dotted line)
30 — Oversold (Green dashed line)
These levels help traders recognize trend strength, reversals, and potential price exhaustion zones.
Regime Shading
The indicator lightly shades the entire RSI panel based on overall momentum alignment:
Light Green Background → All three momentums are Bullish
Light Red Background → All three momentums are Bearish
No Shading → Mixed or neutral momentum conditions
This shading allows quick identification of strong trend periods.
Momentum Table
A clean, minimalistic 2-column table appears in the top-right of the panel.
Columns:
Type (Short, Medium, Long Momentum)
State (Bullish / Bearish)
Color Coding:
Green background → Bullish
Red background → Bearish
Light blue header for visibility on dark charts
This provides an instant snapshot of momentum alignment across time horizons.
Summary
This RSI Hybrid Momentum Indicator combines RSI and its moving averages into a powerful, visually clean analytical tool. With:
Clear distinctions between short, medium, and long-term momentum
Smart color choices for black backgrounds
Lightly shaded trend regimes
A neat summarizing table
…it provides both clarity and depth, making RSI analysis more robust and actionable.

EchoPulse – Trend Oscillator v1 [QuayLade]Harness the Pulse. Surf the Trend.
EchoPulse™ is a precision-crafted Trend Oscillator designed to visualize the cyclic rhythm of market movements while keeping you contextually aligned with Higher Timeframe Influence Zones. Whether you're a scalper, swing trader, or systematic strategist, EchoPulse brings clarity to trend dynamics by filtering out noise and spotlighting pivotal trade opportunities.
Core Features & Innovations:
Surge Markers (Counter-Trend Oscillation Bursts):
Identify statistically unsustainable counter-trend surges with high precision. These Aqua & Orange crosses mark potential exhaustion points during pullbacks, perfect for strategic pyramiding and re-entry setups.
Exhaustion Markers (Trend Fatigue Signals):
Spot early signs of trend fatigue with Green & Red Circles. These markers appear when the market's internal cyclic rhythm shows signs of a structural unwind, assisting in managing exits or preparing for trend reversals.
Synchronized Cyclic Lines (Short, Mid, Long):
Visualize the market’s multi-speed oscillations through dynamically flowing Cycle Lines that latch to extreme zones during strong trends. Their stickiness/persistence offers valuable clues into the trend’s strength or weakening momentum.
Higher Timeframe Influence Zone (Contextual Alignment):
A soft overlay reflecting the directional bias of the Higher Timeframe, ensuring you stay aligned with macro flows without adding visual clutter. Greenish for bullish bias, reddish for bearish, and transparent during indecisive phases.
Adaptive Volatility Intelligence (Noise Suppression):
EchoPulse™ dynamically adjusts its sensitivity based on current market volatility, making it effective across various instruments and timeframes — from scalping to positional trading.
Ideal For:
Trend Traders seeking pullback confirmation within trend continuations.
Swing & Position Traders needing clear alignment with higher timeframe structures.
Scalpers] who require real-time directional cues without lag.
Systematic Traders looking to integrate a dynamic, responsive trend oscillator.
Quick User Guide
Trend Bias Confirmation:
Use the HTF Influence Zone background colour to establish directional bias. Prioritize setups aligned with this macro trend.
Entry Triggers with Surge Markers:
Spot Surge Markers appearing against the HTF bias during pullbacks — a signal of possible exhaustion in counter-trend moves and a potential entry opportunity.
Monitor Cyclic Stickiness:
Persistent latching of Cycle Lines to extreme zones indicates a strong trend continuation. Unlatching and normalization could signal consolidation or a pause in trend momentum.
Exhaustion Markers & Reversals:
Exhaustion Markers highlight when a trend leg may be overextended. Combine them with Price Divergence or Key S/R Levels for stronger reversal signals.
Best Practices:
Use EchoPulse™ as a Trend Continuation and Exhaustion Timing Tool .
Combine with Price Action, Divergence Analysis, and Multi-Timeframe Confluence for high-probability setups.
Adjust chart timeframe based on your trading style — Intraday, Swing, or Positional.
Compliance & Acknowledgement Statement:
EchoPulse™ is an original indicator concept meticulously developed by QuayLade using proprietary techniques that visualize dynamic oscillations, adaptive latching behaviours, and multi-timeframe contextual alignment. While the indicator draws inspiration from universally known mathematical constructs such as Rate of Change (RoC) for assessing price momentum, its computational framework, signal derivations, and visualization structures are uniquely crafted and not direct derivatives of any standard or public domain indicators.
All methodologies implemented are original intellectual property, tailored to offer traders an innovative perspective on market rhythm, trend surges, and exhaustion zones. EchoPulse™ is fully committed to be compliant with TradingView’s Vendor Agreements and House Rules regarding originality, fair usage, and responsible adaptation of foundational market analysis concepts.
Script License & Usage Disclaimer:
The EchoPulse™– Trend Oscillator is a proprietary invite-only script. Unauthorized distribution, reverse engineering, or decompilation of this script is strictly prohibited.
This indicator is provided for informational and educational purposes only and does not constitute financial advice or a trading recommendation. Trading and investing involve substantial risks, and the creator assumes no responsibility for financial losses or damages resulting from its use.
By accessing this script, users agree to use it at their own discretion and understand that the author makes no guarantees regarding its performance or suitability for any specific trading objective.
Support & Assistance:
For any queries, feedback, or assistance with usage:
Contact @QuayLade via TradingView DM.
Documentation, usage guides, and walkthroughs will be provided progressively based on user feedback.

Stochastic Z-Score [AlgoAlpha]🟠 OVERVIEW
This indicator is a custom-built oscillator called the Stochastic Z-Score , which blends a volatility-normalized Z-Score with stochastic principles and smooths it using a Hull Moving Average (HMA). It transforms raw price deviations into a normalized momentum structure, then processes that through a stochastic function to better identify extreme moves. A secondary long-term momentum component is also included using an ALMA smoother. The result is a responsive oscillator that reacts to sharp imbalances while remaining stable in sideways conditions. Colored histograms, dynamic oscillator bands, and reversal labels help users visually assess shifts in momentum and identify potential turning points.
🟠 CONCEPTS
The Z-Score is calculated by comparing price to its mean and dividing by its standard deviation—this normalizes movement and highlights how far current price has stretched from typical values. This Z-Score is then passed through a stochastic function, which further refines the signal into a bounded range for easier interpretation. To reduce noise, a Hull Moving Average is applied. A separate long-term trend filter based on the ALMA of the Z-Score helps determine broader context, filtering out short-term traps. Zones are mapped with thresholds at ±2 and ±2.5 to distinguish regular momentum from extreme exhaustion. The tool is built to adapt across timeframes and assets.
🟠 FEATURES
Z-Score histogram with gradient color to visualize deviation intensity (optional toggle).
Primary oscillator line (smoothed stochastic Z-Score) with adaptive coloring based on momentum direction.
Dynamic bands at ±2 and ±2.5 to represent regular vs extreme momentum zones.
Long-term momentum line (ALMA) with contextual coloring to separate trend phases.
Automatic reversal markers when short-term crosses occur at extremes with supporting long-term momentum.
Built-in alerts for oscillator direction changes, zero-line crosses, overbought/oversold entries, and trend confirmation.
🟠 USAGE
Use this script to track momentum shifts and identify potential reversal areas. When the oscillator is rising and crosses above the previous value—especially from deeply negative zones (below -2)—and the ALMA is also above zero, this suggests bullish reversal conditions. The opposite holds for bearish setups. Reversal labels ("▲" and "▼") appear only when both short- and long-term conditions align. The ±2 and ±2.5 thresholds act as momentum warning zones; values inside are typical trends, while those beyond suggest exhaustion or extremes. Adjust the length input to match the asset’s volatility. Enable the histogram to explore underlying raw Z-Score movements. Alerts can be configured to notify key changes in momentum or zone entries.

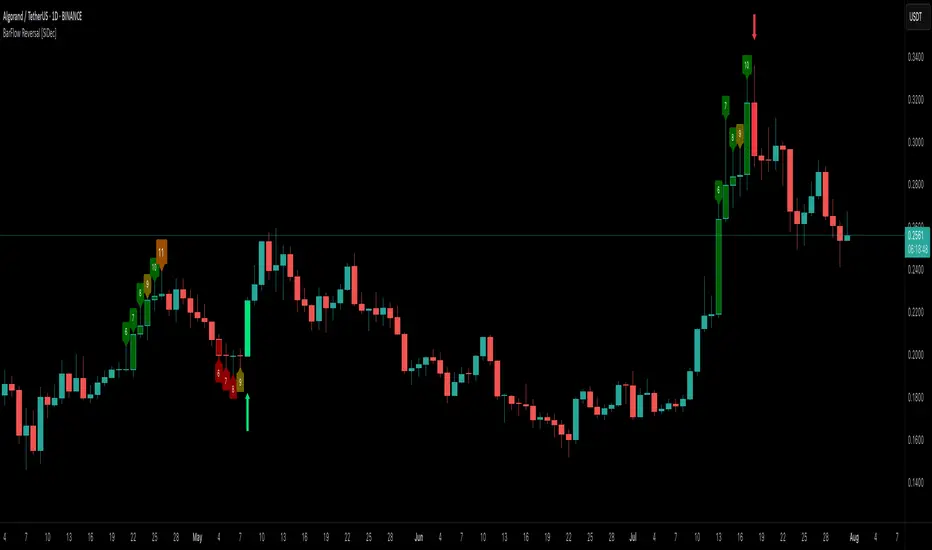
BarFlow Reversal [SiDec]BarFlow Reversal is a powerful indicator designed to help traders spot momentum exhaustion and potential turning points using consecutive candle streaks. It tracks up- and down-runs, highlights key exhaustion counts (like 9, 11, 13, 15), and provides clean visual signals alongside an optional multi-timeframe dashboard — giving you a powerful, customisable momentum map right on your chart.
Overview
Main Components
1. Run Counters
gCnt increments on up‑closes or dojis; rCnt increments on down‑closes or dojis.
seqCount is the larger of those two, and only streaks at or above your Min Consecutive
Special “strong” counts are emphasised with larger labels and unique colours.
2. Reversal Signals
➡️ An arrow plots when a streak of at least your Reversal Threshold is followed by:
A candle closing opposite the streak
Volume above a configurable multiple of its 25‑bar average
ATR expanding
➡️ Arrows come in three strengths (Weak, Strong, Max) based on the prior streak length and your predefined “strong” counts.
3. Bar Shading
Optionally tint each bar during an active run for instant visual feedback on trend direction and strength.
4. Multi‑Timeframe Dashboard
Displays current vs. previous run counts on 1H, 4H, 12H, Daily, Weekly, and Monthly.
Colour‑coded cells show direction and highlight special counts, so you can quickly assess broader momentum.
5. Clean Label Management
Automatically removes outdated streak labels to keep your chart uncluttered.
Labels are positioned just above or below bars and offset slightly to avoid overlap.
Inputs at a Glance
Appearance: Choose Classic, Mono, or Manual theme; set Dark/Light background.
Counting: Define minimum streak length, list of strong counts, and toggle bar shading.
Trend & Filters: Adjust volume multiplier, reversal threshold, and enable/disable arrow plotting.
Dashboard & Cleanup: Show or hide the multi‑timeframe table; auto‑clear old labels.
Colours: Fully customise run labels, special counts, arrows, and dashboard.
Important Trading Note
BarFlow Reversal is not a standalone indicator.
It’s designed to be used in combination with other confluence factors — such as key support/resistance levels, supply/demand zones, VWAP, Fibonacci, liquidity zones, or your preferred price action setups.
While BarFlow Reversal can help you identify moments of exhaustion or likely reversals, it does not provide full trade signals on its own.
Make sure to combine it with proper confirmation tools and risk management before entering trades.
Here are some example screenshots of this indicator in action:
Quick Start
Once you click “Add to favorites,” you’ll find BarFlow Reversal under Indicators for quick use on any chart.
Tweak inputs to match your trading style: set streak lengths, arrow sensitivity, and colour themes.
Watch as BarFlow Reversal highlights exhaustion points and reversal opportunities—across all your favorite timeframes.
If you find it helpful, feel free to leave a like or comment and let me know how you use BarFlow Reversal in your own trading!
Happy trading! 📈
Bollinger Band Breakout With Volatility StoplossDetailed Explanation of the Bollinger Band Breakout With Volatility Stoploss System
Introduction
The "Bollinger Band Breakout With Volatility Stoploss" system is a trading strategy designed to exploit price volatility in financial markets using the Bollinger Bands indicator, a widely recognized tool developed by John Bollinger. This system adapts the traditional Bollinger Bands framework into a Volatility Breakout strategy, focusing on capturing significant price movements by leveraging customized parameters and precise trading rules. The system operates exclusively on long positions, employs a daily timeframe, and incorporates dynamic risk management techniques to optimize trade outcomes while preserving capital.
System Parameters
The system modifies the standard Bollinger Bands configuration to suit its breakout methodology:
Standard Deviation (SD): Set to 1x, determining the width of the bands relative to the central moving average. This tighter setting enhances sensitivity to price movements, making the system responsive to smaller volatility shifts compared to the conventional 2x SD.
Period: A 30-day (1-month) lookback period is used to calculate the bands, providing a balance between capturing medium-term price trends and avoiding excessive noise from shorter timeframes.
Moving Average Type: The system uses an Exponential Moving Average (EMA) instead of the Simple Moving Average (SMA). The EMA places greater weight on recent price data, making it more responsive to current market conditions and better suited for detecting breakout opportunities in dynamic markets.
Core Concept
The Bollinger Band Breakout system is built on the principle of Volatility Breakout, which seeks to capitalize on significant price movements when the price breaks out of a defined volatility range. The Bollinger Bands, consisting of an EMA as the central line and two bands (Upper and Lower) calculated as the EMA plus or minus 1x SD, define this range. The system operates on a Daily Chart (D) timeframe, making it suitable for traders who prefer analyzing and executing trades based on daily price action. By focusing solely on Long Positions (buying low and selling high), the system avoids short-selling, aligning with strategies that capitalize on upward price momentum.
The core idea is to use the 1x SD multiplier over a 30-day period to establish a dynamic price range that reflects recent market volatility. Breakouts above the Upper Band signal potential buying opportunities, while penetrations below the Lower Band indicate exits, ensuring trades are aligned with significant price movements.
Trading Signals
The system generates clear entry and exit signals based on price interactions with the Bollinger Bands:
Buy Signal: A buy signal is triggered when the closing price of a daily candle exceeds the Upper Bollinger Band (EMA + 1x SD over 30 days). The trade is entered at the opening price of the subsequent candle, ensuring the breakout is confirmed by the close of the prior day. This approach minimizes false signals by waiting for a definitive breach of the volatility threshold.
Sell Signal: A sell signal occurs when the closing price falls below the Lower Bollinger Band (EMA - 1x SD over 30 days). The position is exited at the opening price of the next candle, allowing the trader to lock in profits or limit losses when the price reverses or loses momentum.
Risk Management
Risk management is a cornerstone of the system, ensuring capital preservation and disciplined trade execution:
Initial Stoploss: The stoploss is set at the Lower Bollinger Band of the candle that triggered the buy signal. This level acts as a volatility-based threshold, below which the trade is deemed invalid, prompting an immediate exit to protect capital. Traders have two options for implementing the stoploss:
Pending Stoploss: A predefined stoploss order placed at the Lower Band level.
Conditional Exit: Using the sell signal condition (price closing below the Lower Band) as the exit trigger, effectively aligning the stoploss with the system’s exit rules.
Position Sizing: The system employs Fixed Fractional Position Sizing with a risk per trade capped at 3% of the account balance. The position size is calculated based on the distance between the entry price and the Initial Stoploss, incorporating Volatility Position Sizing. This method adjusts the trade size according to the market’s volatility, ensuring that risk remains consistent across varying market conditions. Two options are available for managing capital:
Gear Up Option: Profits from previous trades are reinvested into the account’s capital, increasing the base for calculating the next position size. This compounding approach can amplify returns but also increases risk exposure.
Fixed Equity Option: Profits from previous trades are withdrawn, and only the remaining capital is used for calculating the next position size. This conservative approach prioritizes capital preservation by not compounding gains.
Trailing Stop: The system uses the Lower Bollinger Band as a dynamic trailing stop, which adjusts with price movements and volatility. This ensures that profits are protected during favorable trends while allowing the trade to remain open as long as the price stays above the Lower Band. The trailing stop aligns with the sell signal condition, maintaining consistency in the system’s exit strategy.
Supporting Indicators
The system incorporates two additional indicators to enhance market analysis and decision-making:
Bollinger Band Width (BBW): BBW measures the distance between the Upper and Lower Bollinger Bands relative to the EMA, serving as a proxy for market volatility.
A high BBW indicates significant price volatility, often associated with strong trends or large price movements, which may confirm the strength of a breakout.
A low BBW suggests low volatility, potentially signaling a period of consolidation or "squeeze" that could precede a breakout. This can help traders anticipate potential trade setups.
The BBW calculation uses the EMA to maintain consistency with the system’s core parameters.
Bollinger Band Ratio (BBR) or %B: BBR measures the price’s position relative to the Bollinger Bands, providing insight into market conditions.
BBR > 1: The price is above the Upper Band, indicating potential overbought conditions or strong upward momentum, which aligns with the system’s buy signal.
BBR < 0: The price is below the Lower Band, suggesting oversold conditions or downward momentum, corresponding to the sell signal or stoploss trigger.
BBR between 0 and 1: The price is within the bands, indicating a neutral state where no immediate action is required.
Like BBW, BBR is calculated using the EMA for consistency.
Backtesting and Implementation
To evaluate the system’s performance, traders can utilize the Backtest Parameter function, which allows for testing the strategy across user-defined time periods. This feature enables traders to assess the system’s effectiveness under various market conditions, optimize parameters, and refine their approach based on historical data.
Conclusion
The Bollinger Band Breakout With Volatility Stoploss system is a robust, volatility-driven trading strategy that combines the predictive power of Bollinger Bands with disciplined risk management. By focusing on long positions, using a 1x SD multiplier, and incorporating EMA-based calculations, the system is designed to capture significant price breakouts while minimizing risk through dynamic stoplosses and volatility-adjusted position sizing. The inclusion of BBW and BBR indicators provides additional context for assessing market conditions, enhancing the trader’s ability to make informed decisions. With its structured approach and backtesting capabilities, this system is well-suited for traders seeking a systematic, data-driven method to trade in volatile markets.

MTF Signal XpertMTF Signal Xpert – Detailed Description
Overview:
MTF Signal Xpert is a proprietary, open‑source trading signal indicator that fuses multiple technical analysis methods into one cohesive strategy. Developed after rigorous backtesting and extensive research, this advanced tool is designed to deliver clear BUY and SELL signals by analyzing trend, momentum, and volatility across various timeframes. Its integrated approach not only enhances signal reliability but also incorporates dynamic risk management, helping traders protect their capital while navigating complex market conditions.
Detailed Explanation of How It Works:
Trend Detection via Moving Averages
Dual Moving Averages:
MTF Signal Xpert computes two moving averages—a fast MA and a slow MA—with the flexibility to choose from Simple (SMA), Exponential (EMA), or Hull (HMA) methods. This dual-MA system helps identify the prevailing market trend by contrasting short-term momentum with longer-term trends.
Crossover Logic:
A BUY signal is initiated when the fast MA crosses above the slow MA, coupled with the condition that the current price is above the lower Bollinger Band. This suggests that the market may be emerging from a lower price region. Conversely, a SELL signal is generated when the fast MA crosses below the slow MA and the price is below the upper Bollinger Band, indicating potential bearish pressure.
Recent Crossover Confirmation:
To ensure that signals reflect current market dynamics, the script tracks the number of bars since the moving average crossover event. Only crossovers that occur within a user-defined “candle confirmation” period are considered, which helps filter out outdated signals and improves overall signal accuracy.
Volatility and Price Extremes with Bollinger Bands
Calculation of Bands:
Bollinger Bands are calculated using a 20‑period simple moving average as the central basis, with the upper and lower bands derived from a standard deviation multiplier. This creates dynamic boundaries that adjust according to recent market volatility.
Signal Reinforcement:
For BUY signals, the condition that the price is above the lower Bollinger Band suggests an undervalued market condition, while for SELL signals, the price falling below the upper Bollinger Band reinforces the bearish bias. This volatility context adds depth to the moving average crossover signals.
Momentum Confirmation Using Multiple Oscillators
RSI (Relative Strength Index):
The RSI is computed over 14 periods to determine if the market is in an overbought or oversold state. Only readings within an optimal range (defined by user inputs) validate the signal, ensuring that entries are made during balanced conditions.
MACD (Moving Average Convergence Divergence):
The MACD line is compared with its signal line to assess momentum. A bullish scenario is confirmed when the MACD line is above the signal line, while a bearish scenario is indicated when it is below, thus adding another layer of confirmation.
Awesome Oscillator (AO):
The AO measures the difference between short-term and long-term simple moving averages of the median price. Positive AO values support BUY signals, while negative values back SELL signals, offering additional momentum insight.
ADX (Average Directional Index):
The ADX quantifies trend strength. MTF Signal Xpert only considers signals when the ADX value exceeds a specified threshold, ensuring that trades are taken in strongly trending markets.
Optional Stochastic Oscillator:
An optional stochastic oscillator filter can be enabled to further refine signals. It checks for overbought conditions (supporting SELL signals) or oversold conditions (supporting BUY signals), thus reducing ambiguity.
Multi-Timeframe Verification
Higher Timeframe Filter:
To align short-term signals with broader market trends, the script calculates an EMA on a higher timeframe as specified by the user. This multi-timeframe approach helps ensure that signals on the primary chart are consistent with the overall trend, thereby reducing false signals.
Dynamic Risk Management with ATR
ATR-Based Calculations:
The Average True Range (ATR) is used to measure current market volatility. This value is multiplied by a user-defined factor to dynamically determine stop loss (SL) and take profit (TP) levels, adapting to changing market conditions.
Visual SL/TP Markers:
The calculated SL and TP levels are plotted on the chart as distinct colored dots, enabling traders to quickly identify recommended exit points.
Optional Trailing Stop:
An optional trailing stop feature is available, which adjusts the stop loss as the trade moves favorably, helping to lock in profits while protecting against sudden reversals.
Risk/Reward Ratio Calculation:
MTF Signal Xpert computes a risk/reward ratio based on the dynamic SL and TP levels. This quantitative measure allows traders to assess whether the potential reward justifies the risk associated with a trade.
Condition Weighting and Signal Scoring
Binary Condition Checks:
Each technical condition—ranging from moving average crossovers, Bollinger Band positioning, and RSI range to MACD, AO, ADX, and volume filters—is assigned a binary score (1 if met, 0 if not).
Cumulative Scoring:
These individual scores are summed to generate cumulative bullish and bearish scores, quantifying the overall strength of the signal and providing traders with an objective measure of its viability.
Detailed Signal Explanation:
A comprehensive explanation string is generated, outlining which conditions contributed to the current BUY or SELL signal. This explanation is displayed on an on‑chart dashboard, offering transparency and clarity into the signal generation process.
On-Chart Visualizations and Debug Information
Chart Elements:
The indicator plots all key components—moving averages, Bollinger Bands, SL and TP markers—directly on the chart, providing a clear visual framework for understanding market conditions.
Combined Dashboard:
A dedicated dashboard displays key metrics such as RSI, ADX, and the bullish/bearish scores, alongside a detailed explanation of the current signal. This consolidated view allows traders to quickly grasp the underlying logic.
Debug Table (Optional):
For advanced users, an optional debug table is available. This table breaks down each individual condition, indicating which criteria were met or not met, thus aiding in further analysis and strategy refinement.
Mashup Justification and Originality
MTF Signal Xpert is more than just an aggregation of existing indicators—it is an original synthesis designed to address real-world trading complexities. Here’s how its components work together:
Integrated Trend, Volatility, and Momentum Analysis:
By combining moving averages, Bollinger Bands, and multiple oscillators (RSI, MACD, AO, ADX, and an optional stochastic), the indicator captures diverse market dynamics. Each component reinforces the others, reducing noise and filtering out false signals.
Multi-Timeframe Analysis:
The inclusion of a higher timeframe filter aligns short-term signals with longer-term trends, enhancing overall reliability and reducing the potential for contradictory signals.
Adaptive Risk Management:
Dynamic stop loss and take profit levels, determined using ATR, ensure that the risk management strategy adapts to current market conditions. The optional trailing stop further refines this approach, protecting profits as the market evolves.
Quantitative Signal Scoring:
The condition weighting system provides an objective measure of signal strength, giving traders clear insight into how each technical component contributes to the final decision.
How to Use MTF Signal Xpert:
Input Customization:
Adjust the moving average type and period settings, ATR multipliers, and oscillator thresholds to align with your trading style and the specific market conditions.
Enable or disable the optional stochastic oscillator and trailing stop based on your preference.
Interpreting the Signals:
When a BUY or SELL signal appears, refer to the on‑chart dashboard, which displays key metrics (e.g., RSI, ADX, bullish/bearish scores) along with a detailed breakdown of the conditions that triggered the signal.
Review the SL and TP markers on the chart to understand the associated risk/reward setup.
Risk Management:
Use the dynamically calculated stop loss and take profit levels as guidelines for setting your exit points.
Evaluate the provided risk/reward ratio to ensure that the potential reward justifies the risk before entering a trade.
Debugging and Verification:
Advanced users can enable the debug table to see a condition-by-condition breakdown of the signal generation process, helping refine the strategy and deepen understanding of market dynamics.
Disclaimer:
MTF Signal Xpert is intended for educational and analytical purposes only. Although it is based on robust technical analysis methods and has undergone extensive backtesting, past performance is not indicative of future results. Traders should employ proper risk management and adjust the settings to suit their financial circumstances and risk tolerance.
MTF Signal Xpert represents a comprehensive, original approach to trading signal generation. By blending trend detection, volatility assessment, momentum analysis, multi-timeframe alignment, and adaptive risk management into one integrated system, it provides traders with actionable signals and the transparency needed to understand the logic behind them.

MTF SqzMom [tradeviZion]Credits:
John Carter for creating the TTM Squeeze and TTM Squeeze Pro.
Lazybear for the original interpretation of the TTM Squeeze: Squeeze Momentum Indicator.
Makit0 for evolving Lazybear's script by incorporating TTM Squeeze Pro upgrades – Squeeze PRO Arrows.
MTF SqzMom - Multi-Timeframe Squeeze & Momentum Tool
MTF SqzMom is a tool designed to help traders easily monitor squeeze and momentum signals across multiple timeframes in a simple, organized format. Built using Pine Script 5, it ensures that data remains consistent, even when switching between different time intervals on the chart.
Key Features:
Multi-Timeframe Monitoring: Track squeeze and momentum signals across various timeframes, all in one view. This includes key timeframes like 1-minute, 5-minute, hourly, and daily.
Dynamic Table Display: A color-coded table that automatically adjusts based on the selected timeframes, offering a clear view of market conditions.
Alerts for Key Market Events: Get notifications when a squeeze starts or fires across your chosen timeframes, so you can stay informed without needing to monitor the chart continuously.
Customizable Appearance: Tailor the look of the table by selecting colors for squeeze levels and momentum shifts, and choose the best position on your chart for easy access.
How It Works:
MTF SqzMom is based on the concept of the squeeze, which signals periods of lower volatility where price breakouts may occur. The tool tracks this by monitoring the contraction of Bollinger Bands within Keltner Channels. Along with this, it provides momentum analysis to help you gauge the potential direction of the market after a squeeze.
Squeeze Conditions: The script tracks four levels of squeeze conditions (no squeeze, low, mid, and high), each represented by a different color in the table.
Momentum Analysis: Momentum is visually represented by colors indicating four stages: up increasing, up decreasing, down increasing, and down decreasing. This color coding helps you quickly assess whether the market is gaining or losing momentum.
Using Alerts:
You can enable two types of alerts: when a squeeze starts (indicating consolidation) and when a squeeze fires (indicating a breakout). These alerts cover all timeframes you’ve selected, so you never miss important signals.
How to Set It Up:
1. Enable Alerts in Settings: Turn on "Alert for Squeeze Start" and "Alert for Squeeze Fire" in the settings.
2. Add Alerts to Your Chart:
Click the three dots next to the indicator name.
Select "Add alert on tradeviZion - MTF SqzMom."
3. Customize and Save: Adjust alert options, choose your notification type, and click "Create."
Why Use MTF SqzMom ?
Consistent Data: The tool ensures that squeeze and momentum data remain consistent, even when you switch between chart intervals.
Real-Time Alerts: Stay updated with alerts for squeeze conditions without needing to constantly watch the chart.
Simple to Use, Customizable to Fit: You can easily adjust the table’s look and choose the timeframes and colors that best suit your trading style.
Acknowledgment:
While this tool builds on the TTM Squeeze concept developed by John Carter of Simpler Trading, it offers added flexibility through multi-timeframe analysis, alerts, and customizability to make monitoring market conditions more accessible.

Trend Tide Oscillator [UAlgo]🔶 Description:
The "Trend Tide Oscillator " is a technical analysis tool designed to identify potential trend reversals and overbought/oversold conditions in the market. It calculates an oscillator based on the Commodity Channel Index (CCI) and then applies smoothing techniques to provide a clearer view of market momentum.
🔶 Key Features:
Oscillator Calculation : The indicator calculates an oscillator based on the Commodity Channel Index (CCI), which is a momentum-based oscillator used to identify overbought and oversold conditions.
Smoothing : Smoothing techniques are applied to the oscillator to reduce noise and provide a clearer view of market momentum. This helps traders in identifying trends more effectively.
Support and Resistance Zones : The indicator plots support and resistance zones based on the highest and lowest values of the oscillator over a specified lookback (default 50) period. These zones can help traders identify potential areas of price reversal. The indicator considers volatility when plotting the support and resistance zones. This aims to create more adaptable levels that account for fluctuating market conditions.
Visualization : The indicator visually represents overbought and oversold conditions with shapes (⚠️), aiding traders in quickly identifying potential entry or exit points.
Customization : Users can adjust parameters such as oscillator length, smoothing, and overbought/oversold levels, support and resistance lookbacks according to their trading preferences.
🔶 Disclaimer :
This indicator is provided for informational and educational purposes only and should not be considered as financial advice. Trading in the financial markets involves risk, and users should conduct their own research and analysis before making any investment decisions.

Swing Trading Indicators (Improved)This "Swing Trading Indicators" script is a sophisticated trading tool designed for traders who wants to use technical analysis for identifying optimal entry points, safeguarding profits, and protect their capital. With foundations loosely based on the momentum burst strategy by Pradeep Bonde, Kristjan Kullamaggie's trading methodologies, and incorporating automatic stop-losses based on Average Daily Range (ADR) and Average True Range (ATR), this script offers a comprehensive solution if you want to capitalize on short-term market movements.
Key Features:
Indicators and Moving Averages: Includes EMA (5, 10, 20, 50 days), SMA (200 days), and the highest and lowest prices over 200 days to provide a multifaceted view of market trends and momentum.
Thrust Indicator: Central to the script, the thrust indicator signals a buy point when a candlestick bar closes above the highs of the last two days, indicating a momentum burst. This feature is particularly inspired by Pradeep Bonde's 4% breakout strategy, highlighting the script's capability to identify range expansion and upward thrusts as key entry moments.
Automatic Stop-Levels: Utilizes ADR and ATR to set dynamic stop-losses, helping traders to manage risk effectively by adapting to market volatility.
Comprehensive Market Analysis : Through volume analysis, RSI, closing range, and other parameters, the script offers a deep dive into market dynamics, aiding in decision-making.
Who Should Use It:
This tool is ideal for swing traders and momentum traders focused on short to medium-term gains. Its robust set of features makes it suitable for those who prefer a data-driven approach to identify buying opportunities and manage risk.
Trading Style Compatibility:
The thrust indicator shines in momentum trading strategies, providing clear signals for entering trades ahead of potential price jumps. The integration of moving averages and volume analysis supports a variety of trading styles, including day trading and swing trading, by offering insights into trend strength and potential reversals.
How the Thrust Indicator Works:
When you see a thrust indicator (green upwards arrow below a candle) when the price is moving out of a consolidation or low volatility price-range , that's the buy point.
The thrust indicator is NOT indended as an indicator for long term positions or trend reversals, but for entries at a good price while capturing the first day of a potential 5-20% move in the coming 3-5 days.
The thrust indicator pinpoints moments when a stock shows a strong upward momentum, characterized by a candlestick closing above the highs of the preceding two days. This identifies a momentum burst, signaling an optimal entry point for traders looking to profit from a short-term price movement, typically ranging from 5-20% over the following 3-5 days. Such precision in identifying entry points is invaluable for traders focusing on capturing quick gains from market volatility.
"Top / Watch out" Indicator:
In addition to the script's core functionality, the "WatchOut" indicator plays a crucial role in identifying potential reversals after significant price movements. By analyzing conditions such as recent price increases compared to the average daily range, RSI levels, and the opening price distance from the EMA, the "WatchOut" indicator alerts traders to exercise caution. This feature is pivotal for those looking to avoid entering trades that might be on the verge of a pullback or reversal, enhancing the script's utility in managing risk.

Weighted Oscillator Convergence DivergenceThe Weighted Oscillator Convergence Divergence (WOCD) aims to help traders identify potential trend reversals or momentum shifts in financial markets by calculating and visualizing the difference between a smoothed oscillator (WMA) value and its exponential moving average (EMA) and simple moving average (SMA) counterparts. This indicator is particularly useful for traders who want an alternative perspective on price momentum and divergence.
Key Features:
Inputs:
Length: The user can specify the number of bars to consider for calculations (default is 9).
Smoothing 1: Defines the smoothing factor for the first smoothed value (default is 5).
Smoothing 2: Specifies the smoothing factor for the second smoothed value (default is 7).
Ma Type: There are three types of moving averages you can choose (Wilder, non-lag, Weighted is by default).
Color Settings: Users can customize the indicator's colors for various elements, such as length, smoothing values, and different sections of the histogram.
Calculation:
WOCD calculates the raw oscillator value by subtracting the close price from a 3-period High, Low, Close (HLC3) moving average.
It then applies smoothing to this raw oscillator value using two different methods: exponential moving average (EMA) and simple moving average (SMA) with user-defined smoothing periods.
Histogram Plot:
The indicator plots a histogram based on the difference between the smoothed oscillator and the first smoothed value.
When the histogram is above zero and rising, it is colored according to the "Above Grow" color setting. When it's above zero and falling, it uses the "Fall" color for visualization.
Similarly, when the histogram is below zero and rising, it is colored according to the "Below Grow" color setting, and when it's below zero and falling, it uses the "Fall" color.
Oscillator and Smoothed Values:
The indicator also plots the smoothed oscillator, smoothed value 1 (EMA-based), and smoothed value 2 (SMA-based) on the chart.
Zero Line:
A horizontal line at zero is drawn on the chart for reference.
How to Use the WOCD Indicator:
Trend Identification: Observe the histogram's direction and color. A rising histogram above zero may indicate bullish momentum, while a falling histogram below zero could signal bearish momentum.
Divergence: Look for divergences between price action and the histogram. When the histogram and price move in opposite directions, it can be a potential reversal signal.
Crossovers: Pay attention to crossovers between the smoothed oscillator and its smoothed counterparts (EMA and SMA). These crossovers can indicate changes in trend strength or direction.
Zero Line: The zero line can act as a reference point. Positive histogram values suggest bullish sentiment, while negative values indicate bearish sentiment.
Comparison to MACD Indicator:
The WOCD indicator shares some similarities with the Moving Average Convergence Divergence (MACD) indicator but also has distinct differences:
Similarities:
Both WOCD and MACD are momentum oscillators designed to identify potential trend reversals and divergences.
They use moving averages (EMA in the case of MACD) to smooth the raw oscillator values.
Both indicators provide histogram representations of the difference between the oscillator and its smoothed counterpart.
Differences:
WOCD uses a 3-period High, Low, Close (HLC3) moving average to calculate the raw oscillator value, whereas MACD uses the difference between two exponential moving averages (usually 12-period and 26-period EMAs).
The smoothing in WOCD employs both EMA and SMA, while MACD exclusively uses EMA.
WOCD allows users to customize colors for various elements, enhancing visual clarity.

Pro Momentum CalculatorThe Pro Momentum Calculator Indicator is a tool for traders seeking to gauge market momentum and predict future price movements. It achieves this by counting consecutive candle periods above or below a chosen Simple Moving Average (SMA) and then providing a percentage-based probability for the direction of the next candle.
Here's how this principle works:
1. Counting Consecutive Periods: The indicator continuously tracks whether the closing prices of candles are either above or below the chosen SMA.
- When closing prices are above the SMA, it counts consecutive periods as "green" or indicating potential upward momentum.
- When closing prices are below the SMA, it counts consecutive periods as "red" or suggesting potential downward momentum.
2. Assessing Momentum: By monitoring these consecutive periods, the indicator assesses the strength and duration of the current market trend.
This is important information for traders looking to understand the market's behavior.
3. Predicting the Next Candle: Based on the historical data of consecutive green and red periods, the indicator calculates a percentage probability for the direction of the next candle:
- If there have been more consecutive green periods, it suggests a higher likelihood of the next candle being green (indicating a potential upward movement).
- If there have been more consecutive red periods, it suggests a higher likelihood of the next candle being red (indicating a potential downward movement).
The Pro Momentum Calculator indicator's versatility makes it suitable for a wide range of financial markets, including stocks, Forex, indices, commodities, cryptocurrencies...
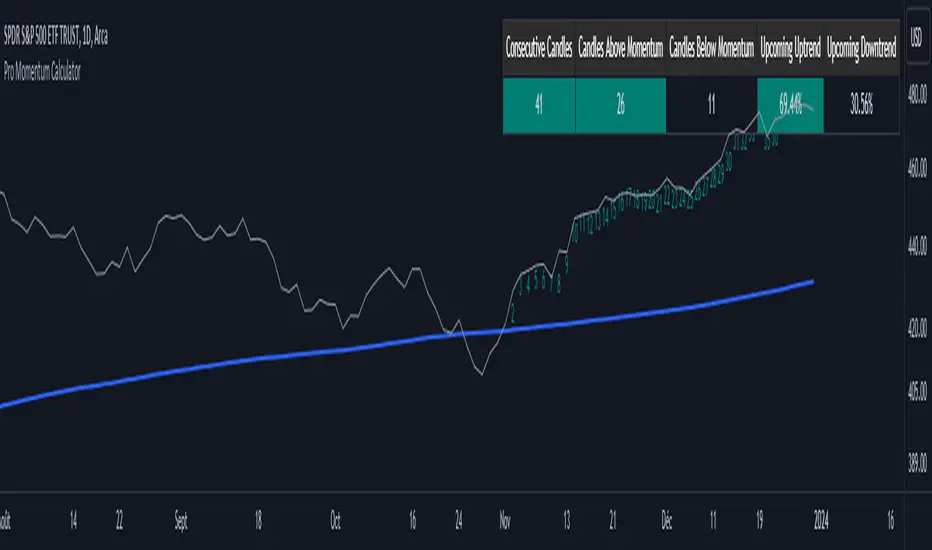
LNL Squeeze ArrowsIf you struggle with the entries, low % win rate or trading the squeeze setup overall, this indicator is for you!
If you look closely at your losing trades, chances are the losers have one thing in common = inverse momentum. I created this tool after I found out that Stacked EMAs and picture perfect trend is not the only thing you need for a squeeze setup. Squeeze arrows pinpoint the exact moment where the squeeze momentum change happens (momentum change is absolutely crucial for the squeeze setup). These arrows will help you stay out of "everything was aligned but still failed" type of setups.
Squeeze Arrows:
1. Momentum Arrows (cyan blue/red) - Showing the best possible moment for an entry during the squeeze (after you see one, you can expect the squeeze to fire soon).
2. Slingshot Arrows (yellow) - Even though you can trade off of them, these arrows work mostly as a confirmation & caution tool. If an inverse slingshot arrow is plotted during a squeeze that means caution = you should wait because momentum is not on your side thus there there is a quite high probability that the squeeze can fire the other direction.
Squeeze Dots Trigger:
Represents the number of red dots (squeeze) after which the arrows should plot. Default = 5 (only after 5 red dots, arrows will appear), some traders like to set it on 3 or even 1.
Tips & Tricks:
1.Breakout or Bailout Mentality
- The big advantage of the arrows is the fact that they either work straight away or they don't. This is where you can apply the breakout or bailout mentality and really focus exclusively on the breakout part of the whole squeeze move. You can minimize the risk by putting mental stops just a few points below the last low of the candle where the arrows appeared. That way you can be stopped out even during the squeeze = won't hurt as much as when the squeeze fire the opposite direction. Reward may be the same but the risk is lower.
2. Yellow Flags
- Use the slingshot arrows as a caution tool. Even if all your squeeze criteria are met. Yellow inverse arrow = caution (wait for the true momentum change). Once the slingshot arrow appears in the conext of the trend, you are good to go.
3. Last Arrow Rule
- Sometimes you will see a lot of arrows during the longer squeezes. This is where the last arrow rule come in handy. The last arrow you see on chart can be canceled anytime by a new one. The last arrow is the valid one!
Hope you can squeeze from these squeeze arrows as much as there is to squeeze so you can finally trade the squeeze with ease.
Hope it helps.

Scalper's Paradise Tool For NQThis powerful scalping tool was specifically designed for NQ and MNQ. Scalper's Paradise adds buy and sell signals to the chart using a proprietary blend of confluence trading principals that are incredibly accurate. Many of the settings can be customized for uses on higher time-frames and different markets. Along with the buy and sell signals, this indicator offers weakness signaling (seen as dots on the chart), along with potential exit points marked as 'EX' on the chart over a diamond shape.
How To Use:
This indicator is designed for intra-day scalping. When a buy or sell signal is marked on the chart, it's safe to enter a position. Exit the position when you see weakness in the trend or where the EX (exits) are marked.
The Trend Cloud offers great visibility for trend strength and overall volatility and can be used in conjunction with the entries and exits for added confidence that your trade is a worthwhile trade.
The red and green backgrounds on the chart are a filtering tool designed to save you from trades that otherwise don't carry enough momentum to be worth entering the market. This part of the indicator has 3 major adjustable settings that allow you to truly dial in your risk.
Identify momentum areas and trade with confidence using Scalper's Paradise!
Trend Cloud for momentum and confidence
Buy and Sell Signals
Marked Exits and Trend Weakness dots on the chart
ADX Based Clean Trade Filter allows for full customization of your trading risk profile. This part of the indicator will SUPPRESS any and all signals while the chart's background is red.
The Safer Trades Filtering in the settings allows further confidence by suppressing riskier trade signals
Limitations:
This script does not mark reversals. It will only identify safe trade zones during periods of strong momentum.
Disclaimer:
The information contained in my scripts/indicators/ideas does not constitute financial advice or a solicitation to buy or sell any securities of any type. I will not accept liability for any loss or damage, including without limitation any loss of profit, which may arise directly or indirectly from the use of or reliance on such information.
All investments involve risk, and the past performance of a security, industry, sector, market, financial product, trading strategy, or individual’s trading does not guarantee future results or returns. Investors are fully responsible for any investment decisions they make. Such decisions should be based solely on an evaluation of their financial circumstances, investment objectives, risk tolerance, and liquidity needs.
My scripts/indicators/strategies/ideas are only for educational purposes!
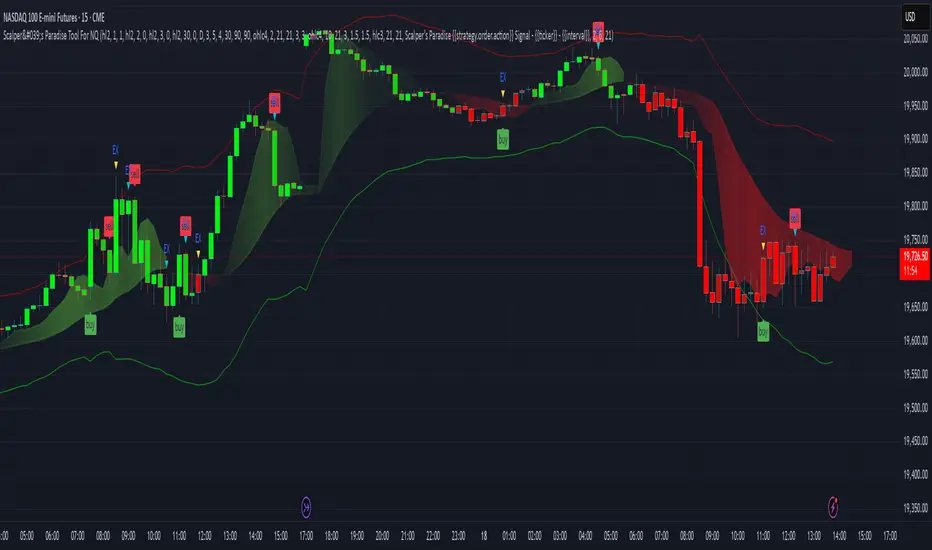
+ WaveTrend OscillatorI'm guessing most of you are familir with LazyBear's adaptation of the Wavetrend Oscillator; it's one of the most popular indicators on TradingView. I know others have done adaptations of it, but I thought I might as well, because that's kind of a thing I like doing.
In this version I've added a second Wavetrend plot. This is a thing I like to do. The longer plot gives you a longer timeframe momentum bias, and the shorter plot gives you entries and/or exits. Here we have one plot with a lookback period of 55, and another with the default set to 6 (change this to 14 if you think you might prefer something slower and that will plot similarly to the default RSI settings). With the traditional Wavetrend Oscillator there is a simple moving average on the WTO that is to help provide entries and exits. I've done away with this as there are already two plots, and I felt more would just clutter the indicator. Instead of plotting the SMA I've plotted the crosses along the bottom and top of the indicator. Also, as is not the case in LazyBear's version, this SMA length is adjustable. By default it is set to 3, which is the default setting on the original indicator.
I've also plotted background colors for when there is what I call a momentum shift. If one or the other oscillators crosses the centerline a colored bar is plotted. By default it is turned on for both WTOs, though in practice you might only want it on for the longer one.
I would say use of the indicator is similar to the original WTO or many other oscillators. Buying oversold and selling overbought, but being mindful of the momentum of the market. If the longer WTO is above the centerline it's best to be looking for dips to the centerline, or for an overbought signal by the faster WTO, and vice versa if the longer WTO is below the centerline. That said, you can also adjust the length of the SMA on the faster WTO to fine tune entries or exits, which is kind of how you would trade LazyBear's version. In this case you have that additional confirmation of market momentum.
You can set colored candles to either of the WTO plots via a dropdown menu.
There are alerts for overbought and oversold situations, centerline crosses, and Wavetrend crosses.
That's about it. Hope you enjoy this particular implementation of LazyBear's well known indicator.
Ah yes, last thing: Original version the source is set to hlc3. I've given you the opportunity to change that, so if you prefer using close you can, or whatever you want.

Premium Volume Divergence Signals [Stansbooth]Advanced Divergence Indicator
This indicator is designed to uncover the hidden relationship between price action and momentum. By accurately detecting when price and momentum move in different directions, it highlights bullish and bearish divergences at critical market points — often before reversals or strong continuations occur.
🔹 Key Features:
Precise detection of Regular and Hidden Divergence
Helps identify early market reversals
Clean, clear, and easy-to-read visual signals
Works across Forex, Crypto, and Stock markets
Suitable for all timeframes and trading styles
This indicator empowers traders to make smarter entries, confident exits, and better risk management decisions. Instead of chasing the market, it allows you to anticipate price movement with confidence.
Trade smarter, not harder — let divergence reveal the real market strength.
