MA Crossover Strategy with TP/SL (5 EMA Filter)How the Strategy Works on a 5-Minute Chart:
Data Input (5-Minute Candles):
Every single data point (candle) on your chart will represent 5 minutes of price action (Open, High, Low, Close for that 5-minute period).
All calculations (MAs, EMA, signals) will be based on these 5-minute price data points.
Moving Average Calculations:
Fast MA (10-period SMA): This will be the Simple Moving Average of the closing prices of the last 10 five-minute candles. It reacts relatively quickly to recent price changes.
Slow MA (30-period SMA): This will be the Simple Moving Average of the closing prices of the last 30 five-minute candles. It represents a slightly longer-term trend compared to the Fast MA.
5 EMA (5-period EMA): This is the Exponential Moving Average of the closing prices of the last 5 five-minute candles. Being an EMA, it gives more weight to the most recent 5-minute prices, making it very responsive to immediate price action.
Signal Generation (Entry Conditions):
Long Entry Signal:
The 10-period SMA crosses above the 30-period SMA (indicating a potential bullish shift in the short-to-medium term trend).
AND the current 5-minute candle's closing price is above the 5-period EMA (confirming that the immediate price momentum is also bullish and supporting the crossover).
If both conditions are met at the close of a 5-minute candle, a "Buy" signal is generated.
Short Entry Signal:
The 10-period SMA crosses below the 30-period SMA (indicating a potential bearish shift).
AND the current 5-minute candle's closing price is below the 5-period EMA (confirming immediate bearish momentum).
If both conditions are met at the close of a 5-minute candle, a "Sell" signal is generated.
Trade Execution:
When a signal is triggered, the strategy enters a trade (long or short) at the closing price of that 5-minute candle.
Immediately upon entry, it places two contingent orders:
Take Profit (Target): Set at 2% (by default) away from your entry price. For a long trade, it's 2% above; for a short trade, 2% below.
Stop Loss: Set at 1% (by default) away from your entry price. For a long trade, it's 1% below; for a short trade, 1% above.
The trade will remain open until either the Take Profit or Stop Loss price is hit by subsequent 5-minute candles.
Implications for Trading on a 5-Minute Chart:
Increased Trade Frequency: You will likely see many more signals and trades compared to higher timeframes (like 1-hour or daily charts). This means more potential opportunities but also more transaction costs (commissions, slippage).
Sensitivity to Noise: Lower timeframes are more prone to "market noise" – small, random price fluctuations that don't indicate a true trend. While the 5 EMA filter helps, some false signals might still occur.
Faster Price Action: Price movements can be very rapid on a 5-minute chart. Your take profit or stop loss levels might be hit very quickly, sometimes within the same or next few candles.
Parameter Optimization is Crucial: The default MA lengths (10, 30) and EMA (5) might not be optimal for every asset or market condition on a 5-minute chart. You'll need to backtest extensively and potentially adjust these lengths, as well as the targetPerc and stopPerc, to find what works best for the specific instrument you're trading.
Risk Management: The fixed percentage stop loss is vital on a 5-minute chart due to its volatility. Without it, a few unfavorable moves could lead to significant losses.
Cerca negli script per "momentum"

ARSI – (VWAP & ATR) 3QKRAKThe ARSI Long & Short – Dynamic Risk Sizing (VWAP & ATR) indicator combines three core components—an adjusted RSI oscillator (ARSI), Volume‐Weighted Average Price (VWAP), and Average True Range (ATR)—so that entry/exit signals and position sizing are always tailored to current market conditions. ARSI, plotted from 0 to 100 with clearly marked overbought and oversold zones, is the primary signal driver: when ARSI falls below the lower threshold it indicates an excessive sell‐off and flags a long opportunity, whereas a break above the upper threshold signals overextended gains and foreshadows a short. A midpoint line at 50 can serve as an early exit or reduction signal when crossed against your position.
VWAP, showing the volume‐weighted average price over the chosen period, acts as a trend filter—long trades are only taken when price sits above VWAP, and shorts only when it’s below—ensuring each trade aligns with the prevailing market momentum. ATR measures current volatility and is used both to set safe stop‐loss levels and to dynamically size each position. In practice, this means positions automatically shrink in high‐volatility environments and grow in quieter markets, all while risking a fixed percentage of your capital.
Everything appears on a single chart: the ARSI pane below the price window with its reference levels; VWAP overlaid on the price; and the ATR‐based stop‐loss distances graphically displayed. Traders thus get a comprehensive, at-a-glance view of entries, exits, trend confirmation, and exactly how large a position they can safely take. The indicator runs in real time, removing the need for manual parameter calculations and letting you focus on strategic decision-making.

HMA Crossover + ATR + Curvature (Long & Short)📏 Hull Moving Averages (Trend Filters)
- fastHMA = ta.hma(close, fastLength)
- slowHMA = ta.hma(close, slowLength)
These two HMAs act as dynamic trend indicators:
- A bullish crossover of fast over slow HMA signals a potential long setup.
- A bearish crossunder triggers short interest.
⚡️ Curvature (Acceleration Filter)
- curv = ta.change(ta.change(fastHMA))
This calculates the second-order change (akin to the second derivative) of the fast HMA — effectively the acceleration of the trend. It serves as a filter:
- For long entries: curv > curvThresh (positive acceleration)
- For short entries: curv < -curvThresh (negative acceleration)
It helps eliminate weak or stagnating moves by requiring momentum behind the crossover.
📈 Volatility-Based Risk Management (ATR)
- atr = ta.atr(atrLength)
- stopLoss = atr * atrMult
- trailStop = atr * trailMult
These define your:
- Initial stop loss: scaled to recent volatility using ATR and atrMult.
- Trailing stop: also ATR-scaled, to lock in gains dynamically as price moves favorably.
💰 Position Sizing via Risk Percent
- capital = strategy.equity
- riskCapital = capital * (riskPercent / 100)
- qty = riskCapital / stopLoss
This dynamically calculates the position size (qty) such that if the stop loss is hit, the loss does not exceed the predefined percentage of account equity. It’s a volatility-adjusted position sizing method, keeping your risk consistent regardless of market conditions.
📌 Execution Logic
- Long Entry: on bullish HMA crossover with rising curvature.
- Short Entry: on bearish crossover with falling curvature.
- Exits: use ATR-based trailing stops.
- Position is closed when trend conditions reverse (e.g., bearish crossover exits the long).
This framework gives you:
- Trend-following logic (via HMAs)
- Momentum confirmation (via curvature)
- Volatility-aware execution and exits (via ATR)
- Risk-controlled dynamic sizing
Want to get surgical and test what happens if we use curvature on the difference between HMAs instead? That might give some cool insights into trend strength transitions.

Ticker Pulse Meter + Fear EKG StrategyDescription
The Ticker Pulse Meter + Fear EKG Strategy is a technical analysis tool designed to identify potential entry and exit points for long positions based on price action relative to historical ranges. It combines two proprietary indicators: the Ticker Pulse Meter (TPM), which measures price positioning within short- and long-term ranges, and the Fear EKG, a VIX-inspired oscillator that detects extreme market conditions. The strategy is non-repainting, ensuring signals are generated only on confirmed bars to avoid false positives. Visual enhancements, such as optional moving averages and Bollinger Bands, provide additional context but are not core to the strategy's logic. This script is suitable for traders seeking a systematic approach to capturing momentum and mean-reversion opportunities.
How It Works
The strategy evaluates price action using two key metrics:
Ticker Pulse Meter (TPM): Measures the current price's position within short- and long-term price ranges to identify momentum or overextension.
Fear EKG: Detects extreme selling pressure (akin to "irrational selling") by analyzing price behavior relative to historical lows, inspired by volatility-based oscillators.
Entry signals are generated when specific conditions align, indicating potential buying opportunities. Exits are triggered based on predefined thresholds or partial position closures to manage risk. The strategy supports customizable lookback periods, thresholds, and exit percentages, allowing flexibility across different markets and timeframes. Visual cues, such as entry/exit dots and a position table, enhance usability, while optional overlays like moving averages and Bollinger Bands provide additional chart context.
Calculation Overview
Price Range Calculations:
Short-Term Range: Uses the lowest low (min_price_short) and highest high (max_price_short) over a user-defined short lookback period (lookback_short, default 50 bars).
Long-Term Range: Uses the lowest low (min_price_long) and highest high (max_price_long) over a user-defined long lookback period (lookback_long, default 200 bars).
Percentage Metrics:
pct_above_short: Percentage of the current close above the short-term range.
pct_above_long: Percentage of the current close above the long-term range.
Combined metrics (pct_above_long_above_short, pct_below_long_below_short) normalize price action for signal generation.
Signal Generation:
Long Entry (TPM): Triggered when pct_above_long_above_short crosses above a user-defined threshold (entryThresholdhigh, default 20) and pct_below_long_below_short is below a low threshold (entryThresholdlow, default 40).
Long Entry (Fear EKG): Triggered when pct_below_long_below_short crosses under an extreme threshold (orangeEntryThreshold, default 95), indicating potential oversold conditions.
Long Exit: Triggered when pct_above_long_above_short crosses under a profit-taking level (profitTake, default 95). Partial exits are supported via a user-defined percentage (exitAmt, default 50%).
Non-Repainting Logic: Signals are calculated using data from the previous bar ( ) and only plotted on confirmed bars (barstate.isconfirmed), ensuring reliability.
Visual Enhancements:
Optional moving averages (SMA, EMA, WMA, VWMA, or SMMA) and Bollinger Bands can be enabled for trend context.
A position table displays real-time metrics, including open positions, Fear EKG, and Ticker Pulse values.
Background highlights mark periods of high selling pressure.
Entry Rules
Long Entry:
TPM Signal: Occurs when the price shows strength relative to both short- and long-term ranges, as defined by pct_above_long_above_short crossing above entryThresholdhigh and pct_below_long_below_short below entryThresholdlow.
Fear EKG Signal: Triggered by extreme selling pressure, when pct_below_long_below_short crosses under orangeEntryThreshold. This signal is optional and can be toggled via enable_yellow_signals.
Entries are executed only on confirmed bars to prevent repainting.
Exit Rules
Long Exit: Triggered when pct_above_long_above_short crosses under profitTake.
Partial exits are supported, with the strategy closing a user-defined percentage of the position (exitAmt) up to four times per position (exit_count limit).
Exits can be disabled or adjusted via enable_short_signal and exitPercentage settings.
Inputs
Backtest Start Date: Defines the start of the backtesting period (default: Jan 1, 2017).
Lookback Periods: Short (lookback_short, default 50) and long (lookback_long, default 200) periods for range calculations.
Resolution: Timeframe for price data (default: Daily).
Entry/Exit Thresholds:
entryThresholdhigh (default 20): Threshold for TPM entry.
entryThresholdlow (default 40): Secondary condition for TPM entry.
orangeEntryThreshold (default 95): Threshold for Fear EKG entry.
profitTake (default 95): Exit threshold.
exitAmt (default 50%): Percentage of position to exit.
Visual Options: Toggle for moving averages and Bollinger Bands, with customizable types and lengths.
Notes
The strategy is designed to work across various timeframes and assets, with data sourced from user-selected resolutions (i_res).
Alerts are included for long entry and exit signals, facilitating integration with TradingView's alert system.
The script avoids repainting by using confirmed bar data and shifted calculations ( ).
Visual elements (e.g., SMA, Bollinger Bands) are inspired by standard Pine Script practices and are optional, not integral to the core logic.
Usage
Apply the script to a chart, adjust input settings to suit your trading style, and use the visual cues (entry/exit dots, position table) to monitor signals. Enable alerts for real-time notifications.
Designed to work best on Daily timeframe.

Anomalous Holonomy Field Theory🌌 Anomalous Holonomy Field Theory (AHFT) - Revolutionary Quantum Market Analysis
Where Theoretical Physics Meets Trading Reality
A Groundbreaking Synthesis of Differential Geometry, Quantum Field Theory, and Market Dynamics
🔬 THEORETICAL FOUNDATION - THE MATHEMATICS OF MARKET REALITY
The Anomalous Holonomy Field Theory represents an unprecedented fusion of advanced mathematical physics with practical market analysis. This isn't merely another indicator repackaging old concepts - it's a fundamentally new lens through which to view and understand market structure .
1. HOLONOMY GROUPS (Differential Geometry)
In differential geometry, holonomy measures how vectors change when parallel transported around closed loops in curved space. Applied to markets:
Mathematical Formula:
H = P exp(∮_C A_μ dx^μ)
Where:
P = Path ordering operator
A_μ = Market connection (price-volume gauge field)
C = Closed price path
Market Implementation:
The holonomy calculation measures how price "remembers" its journey through market space. When price returns to a previous level, the holonomy captures what has changed in the market's internal geometry. This reveals:
Hidden curvature in the market manifold
Topological obstructions to arbitrage
Geometric phase accumulated during price cycles
2. ANOMALY DETECTION (Quantum Field Theory)
Drawing from the Adler-Bell-Jackiw anomaly in quantum field theory:
Mathematical Formula:
∂_μ j^μ = (e²/16π²)F_μν F̃^μν
Where:
j^μ = Market current (order flow)
F_μν = Field strength tensor (volatility structure)
F̃^μν = Dual field strength
Market Application:
Anomalies represent symmetry breaking in market structure - moments when normal patterns fail and extraordinary opportunities arise. The system detects:
Spontaneous symmetry breaking (trend reversals)
Vacuum fluctuations (volatility clusters)
Non-perturbative effects (market crashes/melt-ups)
3. GAUGE THEORY (Theoretical Physics)
Markets exhibit gauge invariance - the fundamental physics remains unchanged under certain transformations:
Mathematical Formula:
A'_μ = A_μ + ∂_μΛ
This ensures our signals are gauge-invariant observables , immune to arbitrary market "coordinate changes" like gaps or reference point shifts.
4. TOPOLOGICAL DATA ANALYSIS
Using persistent homology and Morse theory:
Mathematical Formula:
β_k = dim(H_k(X))
Where β_k are the Betti numbers describing topological features that persist across scales.
🎯 REVOLUTIONARY SIGNAL CONFIGURATION
Signal Sensitivity (0.5-12.0, default 2.5)
Controls the responsiveness of holonomy field calculations to market conditions. This parameter directly affects the threshold for detecting quantum phase transitions in price action.
Optimization by Timeframe:
Scalping (1-5min): 1.5-3.0 for rapid signal generation
Day Trading (15min-1H): 2.5-5.0 for balanced sensitivity
Swing Trading (4H-1D): 5.0-8.0 for high-quality signals only
Score Amplifier (10-200, default 50)
Scales the raw holonomy field strength to produce meaningful signal values. Higher values amplify weak signals in low-volatility environments.
Signal Confirmation Toggle
When enabled, enforces additional technical filters (EMA and RSI alignment) to reduce false positives. Essential for conservative strategies.
Minimum Bars Between Signals (1-20, default 5)
Prevents overtrading by enforcing quantum decoherence time between signals. Higher values reduce whipsaws in choppy markets.
👑 ELITE EXECUTION SYSTEM
Execution Modes:
Conservative Mode:
Stricter signal criteria
Higher quality thresholds
Ideal for stable market conditions
Adaptive Mode:
Self-adjusting parameters
Balances signal frequency with quality
Recommended for most traders
Aggressive Mode:
Maximum signal sensitivity
Captures rapid market moves
Best for experienced traders in volatile conditions
Dynamic Position Sizing:
When enabled, the system scales position size based on:
Holonomy field strength
Current volatility regime
Recent performance metrics
Advanced Exit Management:
Implements trailing stops based on ATR and signal strength, with mode-specific multipliers for optimal profit capture.
🧠 ADAPTIVE INTELLIGENCE ENGINE
Self-Learning System:
The strategy analyzes recent trade outcomes and adjusts:
Risk multipliers based on win/loss ratios
Signal weights according to performance
Market regime detection for environmental adaptation
Learning Speed (0.05-0.3):
Controls adaptation rate. Higher values = faster learning but potentially unstable. Lower values = stable but slower adaptation.
Performance Window (20-100 trades):
Number of recent trades analyzed for adaptation. Longer windows provide stability, shorter windows increase responsiveness.
🎨 REVOLUTIONARY VISUAL SYSTEM
1. Holonomy Field Visualization
What it shows: Multi-layer quantum field bands representing market resonance zones
How to interpret:
Blue/Purple bands = Primary holonomy field (strongest resonance)
Band width = Field strength and volatility
Price within bands = Normal quantum state
Price breaking bands = Quantum phase transition
Trading application: Trade reversals at band extremes, breakouts on band violations with strong signals.
2. Quantum Portals
What they show: Entry signals with recursive depth patterns indicating momentum strength
How to interpret:
Upward triangles with portals = Long entry signals
Downward triangles with portals = Short entry signals
Portal depth = Signal strength and expected momentum
Color intensity = Probability of success
Trading application: Enter on portal appearance, with size proportional to portal depth.
3. Field Resonance Bands
What they show: Fibonacci-based harmonic price zones where quantum resonance occurs
How to interpret:
Dotted circles = Minor resonance levels
Solid circles = Major resonance levels
Color coding = Resonance strength
Trading application: Use as dynamic support/resistance, expect reactions at resonance zones.
4. Anomaly Detection Grid
What it shows: Fractal-based support/resistance with anomaly strength calculations
How to interpret:
Triple-layer lines = Major fractal levels with high anomaly probability
Labels show: Period (H8-H55), Price, and Anomaly strength (φ)
⚡ symbol = Extreme anomaly detected
● symbol = Strong anomaly
○ symbol = Normal conditions
Trading application: Expect major moves when price approaches high anomaly levels. Use for precise entry/exit timing.
5. Phase Space Flow
What it shows: Background heatmap revealing market topology and energy
How to interpret:
Dark background = Low market energy, range-bound
Purple glow = Building energy, trend developing
Bright intensity = High energy, strong directional move
Trading application: Trade aggressively in bright phases, reduce activity in dark phases.
📊 PROFESSIONAL DASHBOARD METRICS
Holonomy Field Strength (-100 to +100)
What it measures: The Wilson loop integral around price paths
>70: Strong positive curvature (bullish vortex)
<-70: Strong negative curvature (bearish collapse)
Near 0: Flat connection (range-bound)
Anomaly Level (0-100%)
What it measures: Quantum vacuum expectation deviation
>70%: Major anomaly (phase transition imminent)
30-70%: Moderate anomaly (elevated volatility)
<30%: Normal quantum fluctuations
Quantum State (-1, 0, +1)
What it measures: Market wave function collapse
+1: Bullish eigenstate |↑⟩
0: Superposition (uncertain)
-1: Bearish eigenstate |↓⟩
Signal Quality Ratings
LEGENDARY: All quantum fields aligned, maximum probability
EXCEPTIONAL: Strong holonomy with anomaly confirmation
STRONG: Good field strength, moderate anomaly
MODERATE: Decent signals, some uncertainty
WEAK: Minimal edge, high quantum noise
Performance Metrics
Win Rate: Rolling performance with emoji indicators
Daily P&L: Real-time profit tracking
Adaptive Risk: Current risk multiplier status
Market Regime: Bull/Bear classification
🏆 WHY THIS CHANGES EVERYTHING
Traditional technical analysis operates on 100-year-old principles - moving averages, support/resistance, and pattern recognition. These work because many traders use them, creating self-fulfilling prophecies.
AHFT transcends this limitation by analyzing markets through the lens of fundamental physics:
Markets have geometry - The holonomy calculations reveal this hidden structure
Price has memory - The geometric phase captures path-dependent effects
Anomalies are predictable - Quantum field theory identifies symmetry breaking
Everything is connected - Gauge theory unifies disparate market phenomena
This isn't just a new indicator - it's a new way of thinking about markets . Just as Einstein's relativity revolutionized physics beyond Newton's mechanics, AHFT revolutionizes technical analysis beyond traditional methods.
🔧 OPTIMAL SETTINGS FOR MNQ 10-MINUTE
For the Micro E-mini Nasdaq-100 on 10-minute timeframe:
Signal Sensitivity: 2.5-3.5
Score Amplifier: 50-70
Execution Mode: Adaptive
Min Bars Between: 3-5
Theme: Quantum Nebula or Dark Matter
💭 THE JOURNEY - FROM IMPOSSIBLE THEORY TO TRADING REALITY
Creating AHFT was a mathematical odyssey that pushed the boundaries of what's possible in Pine Script. The journey began with a seemingly impossible question: Could the profound mathematical structures of theoretical physics be translated into practical trading tools?
The Theoretical Challenge:
Months were spent diving deep into differential geometry textbooks, studying the works of Chern, Simons, and Witten. The mathematics of holonomy groups and gauge theory had never been applied to financial markets. Translating abstract mathematical concepts like parallel transport and fiber bundles into discrete price calculations required novel approaches and countless failed attempts.
The Computational Nightmare:
Pine Script wasn't designed for quantum field theory calculations. Implementing the Wilson loop integral, managing complex array structures for anomaly detection, and maintaining computational efficiency while calculating geometric phases pushed the language to its limits. There were moments when the entire project seemed impossible - the script would timeout, produce nonsensical results, or simply refuse to compile.
The Breakthrough Moments:
After countless sleepless nights and thousands of lines of code, breakthrough came through elegant simplifications. The realization that market anomalies follow patterns similar to quantum vacuum fluctuations led to the revolutionary anomaly detection system. The discovery that price paths exhibit holonomic memory unlocked the geometric phase calculations.
The Visual Revolution:
Creating visualizations that could represent 4-dimensional quantum fields on a 2D chart required innovative approaches. The multi-layer holonomy field, recursive quantum portals, and phase space flow representations went through dozens of iterations before achieving the perfect balance of beauty and functionality.
The Balancing Act:
Perhaps the greatest challenge was maintaining mathematical rigor while ensuring practical trading utility. Every formula had to be both theoretically sound and computationally efficient. Every visual had to be both aesthetically pleasing and information-rich.
The result is more than a strategy - it's a synthesis of pure mathematics and market reality that reveals the hidden order within apparent chaos.
📚 INTEGRATED DOCUMENTATION
Once applied to your chart, AHFT includes comprehensive tooltips on every input parameter. The source code contains detailed explanations of the mathematical theory, practical applications, and optimization guidelines. This published description provides the overview - the indicator itself is a complete educational resource.
⚠️ RISK DISCLAIMER
While AHFT employs advanced mathematical models derived from theoretical physics, markets remain inherently unpredictable. No mathematical model, regardless of sophistication, can guarantee future results. This strategy uses realistic commission ($0.62 per contract) and slippage (1 tick) in all calculations. Past performance does not guarantee future results. Always use appropriate risk management and never risk more than you can afford to lose.
🌟 CONCLUSION
The Anomalous Holonomy Field Theory represents a quantum leap in technical analysis - literally. By applying the profound insights of differential geometry, quantum field theory, and gauge theory to market analysis, AHFT reveals structure and opportunities invisible to traditional methods.
From the holonomy calculations that capture market memory to the anomaly detection that identifies phase transitions, from the adaptive intelligence that learns and evolves to the stunning visualizations that make the invisible visible, every component works in mathematical harmony.
This is more than a trading strategy. It's a new lens through which to view market reality.
Trade with the precision of physics. Trade with the power of mathematics. Trade with AHFT.
I hope this serves as a good replacement for Quantum Edge Pro - Adaptive AI until I'm able to fix it.
— Dskyz, Trade with insight. Trade with anticipation.

Zero Lag MACD + Kijun-sen + EOM StrategyThis strategy offers a robust approach to identifying high-probability trading opportunities in the fast-paced cryptocurrency markets, particularly on lower timeframes (e.g., 5-minute). It leverages the synergistic power of three distinct indicators to confirm entries, ensuring a disciplined approach to risk management.
Key Components:
Zero Lag MACD Enhanced Version 1.2: This core momentum indicator is used to identify precise shifts in trend and momentum, offering reduced lag compared to traditional MACD. Entry signals are filtered based on the histogram's position (below for buys, above for sells) to enhance signal reliability.
Kijun-sen (Ichimoku Cloud): Acting as a dynamic support/resistance and trend filter, the Kijun-sen line confirms the prevailing market direction. Long entries are confirmed when price is above Kijun-sen, and short entries when price is below.
Ease of Movement (EoM): This volume-based oscillator provides crucial confirmation of price movements by measuring the ease with which price changes. Positive EoM confirms buying pressure, while negative confirms selling pressure, adding an essential layer of validation to trade setups.
How it Works:
The strategy generates entry signals only when all three indicators align simultaneously:
For Long Entries: A Zero Lag MACD buy signal (crossover below histogram) must coincide with price trading above the Kijun-sen, and the Ease of Movement indicator being above its zero line.
For Short Entries: A Zero Lag MACD sell signal (crossover above histogram) must coincide with price trading below the Kijun-sen, and the Ease of Movement indicator being below its zero line.
Entries are executed at the open of the candle immediately following the signal confirmation.
Risk Management:
Disciplined risk management is paramount to this strategy:
Dynamic Stop-Loss: An Average True Range (ATR) based stop-loss is implemented, set at 2.5 times the current ATR. This adapts the stop-loss distance to market volatility, ensuring sensible risk sizing.
Fixed Take-Profit: A consistent Risk-to-Reward (R:R) ratio of 1:1.2 is applied for all trades, promoting stable profit realization.
Customization & Optimization:
The strategy is built with fully customizable input parameters for each indicator (MACD lengths, Kijun-sen period, ATR period, ATR multiplier, and Risk-to-Reward ratio). This allows users to fine-tune the strategy for different assets, timeframes, and market conditions, facilitating robust backtesting and optimization.
Disclaimer: Trading involves substantial risk and is not suitable for all investors. Past performance is not indicative of future results. This strategy is provided for educational and informational purposes only. Always use proper risk management and conduct your own due diligence.

TrendMaster Pro 2.3 with Alerts
Hello friends,
A member of the community approached me and asked me how to write an indicator that would achieve a particular set of goals involving comprehensive trend analysis, risk management, and session-based trading controls. Here is one example method of how to create such a system:
Core Strategy Components
Multi-Moving Average System - Uses configurable MA types (EMA, SMA, SMMA) with short-term (9) and long-term (21) periods for primary signal generation through crossovers
Higher Timeframe Trend Filter - Optional trend confirmation using a separate MA (default 50-period) to ensure trades align with broader market direction
Band Power Indicator - Dynamic high/low bands calculated using different MA types to identify price channels and volatility zones
Advanced Signal Filtering
Bollinger Bands Volatility Filter - Prevents trading during low-volatility ranging markets by requiring sufficient band width
RSI Momentum Filter - Uses customizable thresholds (55 for longs, 45 for shorts) to confirm momentum direction
MACD Trend Confirmation - Ensures MACD line position relative to signal line aligns with trade direction
Stochastic Oscillator - Adds momentum confirmation with overbought/oversold levels
ADX Strength Filter - Only allows trades when trend strength exceeds 25 threshold
Session-Based Trading Management
Four Trading Sessions - Asia (18:00-00:00), London (00:00-08:00), NY AM (08:00-13:00), NY PM (13:00-18:00)
Individual Session Limits - Separate maximum trade counts for each session (default 5 per session)
Automatic Session Closure - All positions close at specified market close time
Risk Management Features
Multiple Stop Loss Options - Percentage-based, MA cross, or band-based SL methods
Risk/Reward Ratio - Configurable TP levels based on SL distance (default 1:2)
Auto-Risk Calculation - Dynamic position sizing based on dollar risk limits ($150-$250 range)
Daily Limits - Stop trading after reaching specified TP or SL counts per day
Support & Resistance System
Multiple Pivot Types - Traditional, Fibonacci, Woodie, Classic, DM, and Camarilla calculations
Flexible Timeframes - Auto-adjusting or manual timeframe selection for S/R levels
Historical Levels - Configurable number of past S/R levels to display
Visual Customization - Individual color and display settings for each S/R level
Additional Features
Alert System - Customizable buy/sell alert messages with once-per-bar frequency
Visual Trade Management - Color-coded entry, SL, and TP levels with fill areas
Session Highlighting - Optional background colors for different trading sessions
Comprehensive Filtering - All signals must pass through multiple confirmation layers before execution
This approach demonstrates how to build a professional-grade trading system that combines multiple technical analysis methods with robust risk management and session-based controls, suitable for algorithmic trading across different market sessions.
Good luck and stay safe!

Price Statistical Strategy-Z Score V 1.01
Price Statistical Strategy – Z Score V 1.01
Overview
A technical breakdown of the logic and components of the “Price Statistical Strategy – Z Score V 1.01”.
This script implements a smoothed Z-Score crossover mechanism applied to the closing price to detect potential statistical deviations from local price mean. The strategy operates solely on price data (close) and includes signal spacing control and momentum-based candle filters. No volume-based or trend-detection components are included.
Core Methodology
The strategy is built on the statistical concept of Z-Score, which quantifies how far a value (closing price) is from its recent average, normalized by standard deviation. Two moving averages of the raw Z-Score are calculated: a short-term and a long-term smoothed version. The crossover between them generates long entries and exits.
Signal Conditions
Entry Condition:
A long position is opened when the short-term smoothed Z-Score crosses above the long-term smoothed Z-Score, and additional entry conditions are met.
Exit Condition:
The position is closed when the short-term Z-Score crosses below the long-term Z-Score, provided the exit conditions allow.
Signal Gapping:
A minimum number of bars (Bars gap between identical signals) must pass between repeated entry or exit signals to reduce noise.
Momentum Filter:
Entries are prevented during sequences of three or more consecutively bullish candles, and exits are prevented during three or more consecutively bearish candles.
Z-Score Function
The Z-Score is calculated as:
Z = (Close - SMA(Close, N)) / STDEV(Close, N)
Where N is the base period selected by the user.
Input Parameters
Enable Smoothed Z-Score Strategy
Enables or disables the Z-Score strategy logic. When disabled, no trades are executed.
Z-Score Base Period
Defines the number of bars used to calculate the simple moving average and standard deviation for the Z-Score. This value affects how responsive the raw Z-Score is to price changes.
Short-Term Smoothing
Sets the smoothing window for the short-term Z-Score. Higher values produce smoother short-term signals, reducing sensitivity to short-term volatility.
Long-Term Smoothing
Sets the smoothing window for the long-term Z-Score, which acts as the reference line in the crossover logic.
Bars gap between identical signals
Minimum number of bars that must pass before another signal of the same type (entry or exit) is allowed. This helps reduce redundant or overly frequent signals.
Trade Visualization Table
A table positioned at the bottom-right displays live PnL for open trades:
Entry Price
Unrealized PnL %
Text colors adapt based on whether unrealized profit is positive, negative, or neutral.
Technical Notes
This strategy uses only close prices — no trend indicators or volume components are applied.
All calculations are based on simple moving averages and standard deviation over user-defined windows.
Designed as a minimal, isolated Z-Score engine without confirmation filters or multi-factor triggers.

MACD + RSI + EMA + BB + ATR Day Trading StrategyEntry Conditions and Signals
The strategy implements a multi-layered filtering approach to entry conditions, requiring alignment across technical indicators, timeframes, and market conditions .
Long Entry Requirements
Trend Filter: Fast EMA (9) must be above Slow EMA (21), price must be above Fast EMA, and higher timeframe must confirm uptrend
MACD Signal: MACD line crosses above signal line, indicating increasing bullish momentum
RSI Condition: RSI below 70 (not overbought) but above 40 (showing momentum)
Volume & Volatility: Current volume exceeds 1.2x 20-period average and ATR shows sufficient market movement
Time Filter: Trading occurs during optimal hours (9:30-11:30 AM ET) when market volatility is typically highest
Exit Strategies
The strategy employs multiple exit mechanisms to adapt to changing market conditions and protect profits :
Stop Loss Management
Initial Stop: Placed at 2.0x ATR from entry price, adapting to current market volatility
Trailing Stop: 1.5x ATR trailing stop that moves up (for longs) or down (for shorts) as price moves favorably
Time-Based Exits: All positions closed by end of trading day (4:00 PM ET) to avoid overnight risk
Best Practices for Implementation
Settings
Chart Setup: 5-minute timeframe for execution with 15-minute chart for trend confirmation
Session Times: Focus on 9:30-11:30 AM ET trading for highest volatility and opportunity

Trend Surge with Pullback FilterTrend Surge with Pullback Filter
Overview
Trend Surge with Pullback Filter is a price action-based strategy designed to enter strong trends not at the breakout, but at the first controlled pullback after a surge. It filters out noise by requiring momentum confirmation and low volatility conditions, aiming for better entry prices and reduced risk exposure.
How It Works
A strong upward trend is identified when the Rate of Change (ROC) exceeds a defined percentage (e.g., 2%).
Instead of jumping into the trend immediately, the strategy waits for a pullback: the price must drop at least 1% below its recent high (over the past 3 candles).
A low volatility environment is also required for entry — measured using ATR being below its 20-period average multiplied by a safety factor.
If all three conditions are met (trend + pullback + quiet volatility), the system enters a long position.
The trade is managed using a dynamic ATR-based stop-loss and a take-profit at 2x ATR.
An automatic exit occurs after 30 bars if neither SL nor TP is hit.
Key Features
- Momentum-triggered trend detection via ROC
- Smart pullback filter avoids overbought entries
- Volatility-based filter to eliminate noise and choppy conditions
- Dynamic risk-reward ratio with ATR-driven exit logic
- Time-limited exposure using bar-based exit
Parameter Explanation
ROC Length (10): Looks for short-term price surges
ROC Threshold (2.0%): Trend is considered valid if price increased more than 2%
Pullback Lookback (3): Checks last 3 candles for price retracement
Minimum Pullback % (1.0%): Entry only if price pulled back at least 1%
ATR Length (14): Measures current volatility
Low Volatility Multiplier (1.2): ATR must be below this multiple of its 20-period average
Risk-Reward (2.0): Target is set at 2x the stop-loss distance
Max Bars (30): Trade is closed automatically after 30 bars
Originality Statement
This strategy doesn’t enter at the trend start, unlike many momentum bots. Instead, it waits for the first market hesitation — a minor pullback under low volatility — before entering. This logic mimics how real traders often wait for a better entry after a breakout, avoiding emotional overbought buys. The combined use of ROC, dynamic pullback detection, and ATR-based environment filters makes it both practical and original for real-world trading.
Disclaimer
This strategy is intended for educational and research purposes. Backtest thoroughly and understand the logic before using with real capital.

SOXL Trend Surge v3.0.2 – Profit-Only RunnerSOXL Trend Surge v3.0.2 – Profit-Only Runner
This is a trend-following strategy built for leveraged ETFs like SOXL, designed to ride high-momentum waves with minimal interference. Unlike most short-term scalping scripts, this model allows trades to develop over multiple days to even several months, capitalizing on the full power of extended directional moves — all without using a stop-loss.
🔍 How It Works
Entry Logic:
Price is above the 200 EMA (long-term trend confirmation)
Supertrend is bullish (momentum confirmation)
ATR is rising (volatility expansion)
Volume is above its 20-bar average (liquidity filter)
Price is outside a small buffer zone from the 200 EMA (to avoid whipsaws)
Trades are restricted to market hours only (9 AM to 2 PM EST)
Cooldown of 15 bars after each exit to prevent overtrading
Exit Strategy:
Takes partial profit at +2× ATR if held for at least 2 bars
Rides the remaining position with a trailing stop at 1.5× ATR
No hard stop-loss — giving space for volatile pullbacks
⚙️ Strategy Settings
Initial Capital: $500
Risk per Trade: 100% of equity (fully allocated per entry)
Commission: 0.1%
Slippage: 1 tick
Recalculate after order is filled
Fill orders on bar close
Timeframe Optimized For: 45-minute chart
These parameters simulate an aggressive, high-volatility trading model meant for forward-testing compounding potential under realistic trading costs.
✅ What Makes This Unique
No stop-loss = fewer premature exits
Partial profit-taking helps lock in early wins
Trailing logic gives room to ride large multi-week moves
Uses strict filters (volume, ATR, EMA bias) to enter only during high-probability windows
Ideal for leveraged ETF swing or position traders looking to hold longer than the typical intraday or 2–3 day strategies
⚠️ Important Note
This is a high-risk, high-reward strategy meant for educational and testing purposes. Without a stop-loss, trades can experience deep drawdowns that may take weeks or even months to recover. Always test thoroughly and adjust position sizing to suit your risk tolerance. Past results do not guarantee future returns. Backtest range: May 8, 2020 – May 23, 2025

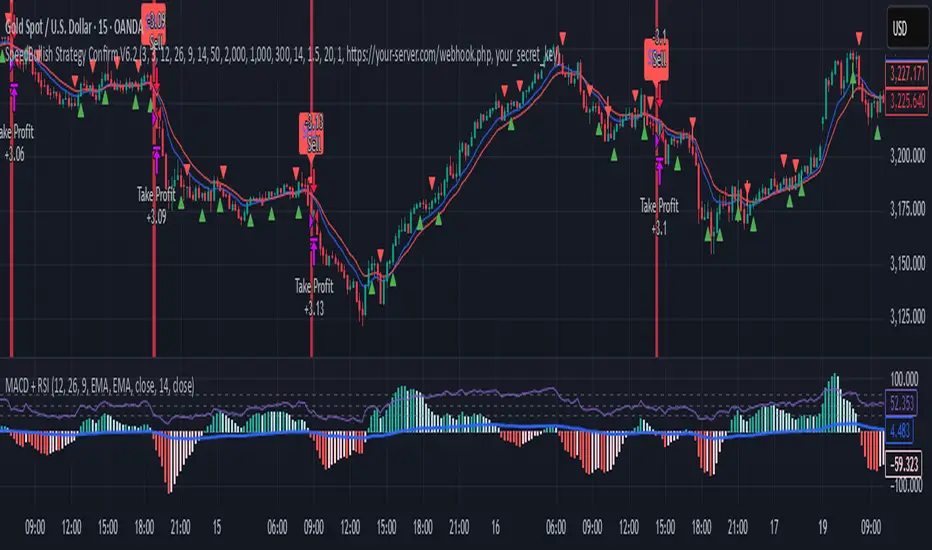
SpeedBullish Strategy Confirm V6.2SpeedBullish Strategy Confirm V6.2
SpeedBullish V6.2 is an advanced price-action + indicator-based strategy designed to confirm trend strength and signal entries with high precision. This version builds on the W/M pattern structure and adds dynamic filtering with EMA, MACD Histogram, RSI, ATR, and Volume.
✅ Signal Conditions
🔹 Buy Signal:
Price above EMA10 or EMA15
MACD Histogram crosses above 0
RSI > 50
(Optional) Higher low via Pivot Low
(Optional) ATR > ATR SMA * Multiplier
(Optional) Volume > SMA * Multiplier
🔻 Sell Signal:
Price below EMA10 or EMA15
MACD Histogram crosses below 0
RSI < 50
(Optional) Lower high via Pivot High
(Optional) Confirmed high volatility and volume
⚙️ Strategy Features
MACD Histogram for momentum shift detection
RSI filtering for momentum confirmation
EMA10/15 for trend direction
ATR-based volatility filter
Volume confirmation filter
Dynamic TP/SL + Trailing Stop
Webhook Integration for MT5 auto-trade
Visual signal markers + background highlight
🔔 Alerts
Alerts are sent in JSON format via alert() with the current symbol, action (buy/sell), and price. Webhook endpoint and secret key are configurable.
📈 How to Use
Attach the strategy to any symbol and timeframe
Customize filters and confirmations to fit your market conditions
Enable webhook alerts for integration with your MT5 Expert Advisor or trading bot
Backtest and optimize before live deployment
Big Mover Catcher BTC 4h🧠 Big Mover Catcher (BTC 4H Strategy) — Educational Tool
⚠️ Disclaimer: I am not a financial advisor. This script is for educational and testing purposes only. Cryptocurrency trading is highly volatile and involves significant risk. You can lose all of your invested capital.
📌 Overview
The Big Mover Catcher strategy is a work-in-progress trading system designed for Bitcoin (BTC) on the 4-hour chart. It aims to identify strong breakout moves by combining multiple technical indicators and conditions, allowing for high customization and filter-based confirmations.
This script is part of a personal project to learn Pine Script and backtesting on TradingView. It is currently in the testing and research phase.
🎯 Strategy Objective
Catch large, high-momentum breakout moves in the BTC market using:
Bollinger Band breakouts for entry signals
Momentum, volatility, and trend filters for trade confirmation
🧰 Features & Filters
The script provides a flexible set of filters that can be turned ON/OFF and adjusted directly from the settings panel:
✅ Entry Conditions
Price must break above or below Bollinger Bands
All selected filters must align before entry
🧪 Available Filters:
Relative Strength Index (RSI) with EMA/SMA smoothing
Average Directional Index (ADX) with EMA/SMA smoothing
Average True Range (ATR) with EMA/SMA smoothing
MACD Signal above or below zero
EMA 350 trend filter
ATR / ADX / RSI Threshold toggles for added control
🔥 Additional Feature:
Force Take Profit: Optionally closes the trade immediately if a candle closes with more than a defined % movement (default: 5%). This can help lock in quick profits during high volatility moves.
⚙️ Customizable Inputs
You can configure:
Stop loss percentage
All indicator lengths
Smoothing types (EMA/SMA)
Threshold activation toggles
Individual filter ON/OFF switches
This makes the strategy highly adaptable for educational exploration and optimization.
📊 Best Used For
Learning Pine Script and strategy structure
Testing filter combinations for BTC on the 4H timeframe
Understanding how different indicators interact in live markets
⚠️ Note: ❌ Short trades are currently disabled by default, as short-side logic is still under development.
❗ Final Reminder
This script is not financial advice. It is an educational tool. Use it to learn and explore trading logic. Trading cryptocurrencies carries high risk — only invest what you can afford to lose.

Gold Breakout Strategy - RR 4Strategy Name: Gold Breakout Strategy - RR 4
🧠 Main Objective
This strategy aims to capitalize on breakouts from the Donchian Channel on Gold (XAU/USD) by filtering trades with:
Volume confirmation,
A custom momentum indicator (LWTI - Linear Weighted Trend Index),
And a specific trading session (8 PM to 8 AM Quebec time — GMT-5).
It takes only one trade per day, either a buy or a sell, using a fixed stop-loss at the wick of the breakout candle and a 4:1 reward-to-risk (RR) ratio.
📊 Indicators Used
Donchian Channel
Length: 96
Detects breakouts of recent highs or lows.
Volume
Simple Moving Average (SMA) over 30 bars.
A breakout is only valid if the current volume is above the SMA.
LWTI (Linear Weighted Trend Index)
Measures momentum using price differences over 25 bars, smoothed over 5.
Used to confirm trend direction:
Buy when LWTI > its smoothed version (uptrend).
Sell when LWTI < its smoothed version (downtrend).
⏰ Time Filter
The strategy only allows entries between 8 PM and 8 AM (GMT-5 / Quebec time).
A timestamp-based filter ensures the system recognizes the correct trading session even across midnight.
📌 Entry Conditions
🟢 Buy (Long)
Price breaks above the previous Donchian Channel high.
The current channel high is higher than the previous one.
Volume is above its moving average.
LWTI confirms an uptrend.
The time is within the trading session (20:00 to 08:00).
No trade has been taken yet today.
🔴 Sell (Short)
Price breaks below the previous Donchian Channel low.
The current channel low is lower than the previous one.
Volume is above its moving average.
LWTI confirms a downtrend.
The time is within the trading session.
No trade has been taken yet today.
💸 Trade Management
Stop-Loss (SL):
For long entries: placed below the wick low of the breakout candle.
For short entries: placed above the wick high of the breakout candle.
Take-Profit (TP):
Set at a fixed 4:1 reward-to-risk ratio.
Calculated as 4x the distance between the entry price and stop-loss.
No trailing stop, no break-even, no scaling in/out.
🎨 Visuals
Green triangle appears below the candle on a buy signal.
Red triangle appears above the candle on a sell signal.
Donchian Channel lines are plotted on the chart.
The strategy is designed for the 5-minute timeframe.
🔄 One Trade Per Day Rule
Once a trade is taken (buy or sell), no more trades will be executed for the rest of the day. This prevents overtrading and limits exposure.

EMA 10/20/50 Alignment Strategy### 📘 **Strategy Name**
**EMA 10/20/50 Trend Alignment Strategy**
---
### 📝 **Description (for Publishing)**
This strategy uses the alignment of Exponential Moving Averages (EMAs) to identify strong bullish trends. It enters a long position when the short-term EMA is above the mid-term EMA, which is above the long-term EMA — a classic sign of trend strength.
#### 🔹 Entry Criteria:
* **EMA10 > EMA20 > EMA50**: A bullish alignment that signals momentum in an upward direction.
* The strategy enters a **long position** when this alignment occurs.
#### 🔹 Exit Criteria:
* The long position is closed when the EMA alignment breaks (i.e., the trend weakens or reverses).
#### 🔹 Additional Features:
* Includes a **date range filter**, allowing you to backtest the strategy over a specific period.
* Uses **100% of available capital** for each trade (position size auto-scales with account balance).
* No short positions, stop loss, or take profit are applied — this is a trend-following strategy meant to ride bullish moves.
---
### ✅ Best For:
* Traders looking for a **simple, trend-based entry system**
* Testing price momentum strategies during specific market regimes
* Visualizing EMA stacking patterns in historical data

Bober XM v2.0# ₿ober XM v2.0 Trading Bot Documentation
**Developer's Note**: While our previous Bot 1.3.1 was removed due to guideline violations, this setback only fueled our determination to create something even better. Rising from this challenge, Bober XM 2.0 emerges not just as an update, but as a complete reimagining with multi-timeframe analysis, enhanced filters, and superior adaptability. This adversity pushed us to innovate further and deliver a strategy that's smarter, more agile, and more powerful than ever before. Challenges create opportunity - welcome to Cryptobeat's finest work yet.
## !!!!You need to tune it for your own pair and timeframe and retune it periodicaly!!!!!
## Overview
The ₿ober XM v2.0 is an advanced dual-channel trading bot with multi-timeframe analysis capabilities. It integrates multiple technical indicators, customizable risk management, and advanced order execution via webhook for automated trading. The bot's distinctive feature is its separate channel systems for long and short positions, allowing for asymmetric trade strategies that adapt to different market conditions across multiple timeframes.
### Key Features
- **Multi-Timeframe Analysis**: Analyze price data across multiple timeframes simultaneously
- **Dual Channel System**: Separate parameter sets for long and short positions
- **Advanced Entry Filters**: RSI, Volatility, Volume, Bollinger Bands, and KEMAD filters
- **Machine Learning Moving Average**: Adaptive prediction-based channels
- **Multiple Entry Strategies**: Breakout, Pullback, and Mean Reversion modes
- **Risk Management**: Customizable stop-loss, take-profit, and trailing stop settings
- **Webhook Integration**: Compatible with external trading bots and platforms
### Strategy Components
| Component | Description |
|---------|-------------|
| **Dual Channel Trading** | Uses either Keltner Channels or Machine Learning Moving Average (MLMA) with separate settings for long and short positions |
| **MLMA Implementation** | Machine learning algorithm that predicts future price movements and creates adaptive bands |
| **Pivot Point SuperTrend** | Trend identification and confirmation system based on pivot points |
| **Three Entry Strategies** | Choose between Breakout, Pullback, or Mean Reversion approaches |
| **Advanced Filter System** | Multiple customizable filters with multi-timeframe support to avoid false signals |
| **Custom Exit Logic** | Exits based on OBV crossover of its moving average combined with pivot trend changes |
### Note for Novice Users
This is a fully featured real trading bot and can be tweaked for any ticker — SOL is just an example. It follows this structure:
1. **Indicator** – gives the initial signal
2. **Entry strategy** – decides when to open a trade
3. **Exit strategy** – defines when to close it
4. **Trend confirmation** – ensures the trade follows the market direction
5. **Filters** – cuts out noise and avoids weak setups
6. **Risk management** – controls losses and protects your capital
To tune it for a different pair, you'll need to start from scratch:
1. Select the timeframe (candle size)
2. Turn off all filters and trend entry/exit confirmations
3. Choose a channel type, channel source and entry strategy
4. Adjust risk parameters
5. Tune long and short settings for the channel
6. Fine-tune the Pivot Point Supertrend and Main Exit condition OBV
This will generate a lot of signals and activity on the chart. Your next task is to find the right combination of filters and settings to reduce noise and tune it for profitability.
### Default Strategy values
Default values are tuned for: Symbol BITGET:SOLUSDT.P 5min candle
Filters are off by default: Try to play with it to understand how it works
## Configuration Guide
### General Settings
| Setting | Description | Default Value |
|---------|-------------|---------------|
| **Long Positions** | Enable or disable long trades | Enabled |
| **Short Positions** | Enable or disable short trades | Enabled |
| **Risk/Reward Area** | Visual display of stop-loss and take-profit zones | Enabled |
| **Long Entry Source** | Price data used for long entry signals | hl2 (High+Low/2) |
| **Short Entry Source** | Price data used for short entry signals | hl2 (High+Low/2) |
The bot allows you to trade long positions, short positions, or both simultaneously. Each direction has its own set of parameters, allowing for fine-tuned strategies that recognize the asymmetric nature of market movements.
### Multi-Timeframe Settings
1. **Enable Multi-Timeframe Analysis**: Toggle 'Enable Multi-Timeframe Analysis' in the Multi-Timeframe Settings section
2. **Configure Timeframes**: Set appropriate higher timeframes based on your trading style:
- Timeframe 1: Default is now 15 minutes (intraday confirmation)
- Timeframe 2: Default is 4 hours (trend direction)
3. **Select Sources per Indicator**: For each indicator (RSI, KEMAD, Volume, etc.), choose:
- The desired timeframe (current, mtf1, or mtf2)
- The appropriate price type (open, high, low, close, hl2, hlc3, ohlc4)
### Entry Strategies
- **Breakout**: Enter when price breaks above/below the channel
- **Pullback**: Enter when price pulls back to the channel
- **Mean Reversion**: Enter when price is extended from the channel
You can enable different strategies for long and short positions.
### Core Components
### Risk Management
- **Position Size**: Control risk with percentage-based position sizing
- **Stop Loss Options**:
- Fixed: Set a specific price or percentage from entry
- ATR-based: Dynamic stop-loss based on market volatility
- Swing: Uses recent swing high/low points
- **Take Profit**: Multiple targets with percentage allocation
- **Trailing Stop**: Dynamic stop that follows price movement
## Advanced Usage Strategies
### Moving Average Type Selection Guide
- **SMA**: More stable in choppy markets, good for higher timeframes
- **EMA/WMA**: More responsive to recent price changes, better for entry signals
- **VWMA**: Adds volume weighting for stronger trends, use with Volume filter
- **HMA**: Balance between responsiveness and noise reduction, good for volatile markets
### Multi-Timeframe Strategy Approaches
- **Trend Confirmation**: Use higher timeframe RSI (mtf2) for overall trend, current timeframe for entries
- **Entry Precision**: Use KEMAD on current timeframe with volume filter on mtf1
- **False Signal Reduction**: Apply RSI filter on mtf1 with strict KEMAD settings
### Market Condition Optimization
| Market Condition | Recommended Settings |
|------------------|----------------------|
| **Trending** | Use Breakout strategy with KEMAD filter on higher timeframe |
| **Ranging** | Use Mean Reversion with strict RSI filter (mtf1) |
| **Volatile** | Increase ATR multipliers, use HMA for moving averages |
| **Low Volatility** | Decrease noise parameters, use pullback strategy |
## Webhook Integration
The strategy features a professional webhook system that allows direct connectivity to your exchange or trading platform of choice through third-party services like 3commas, Alertatron, or Autoview.
The webhook payload includes all necessary parameters for automated execution:
- Entry price and direction
- Stop loss and take profit levels
- Position size
- Custom identifier for webhook routing
## Performance Optimization Tips
1. **Start with Defaults**: Begin with the default settings for your timeframe before customizing
2. **Adjust One Component at a Time**: Make incremental changes and test the impact
3. **Match MA Types to Market Conditions**: Use appropriate moving average types based on the Market Condition Optimization table
4. **Timeframe Synergy**: Create logical relationships between timeframes (e.g., 5min chart with 15min and 4h higher timeframes)
5. **Periodic Retuning**: Markets evolve - regularly review and adjust parameters
## Common Setups
### Crypto Trend-Following
- MLMA with EMA or HMA
- Higher RSI thresholds (75/25)
- KEMAD filter on mtf1
- Breakout entry strategy
### Stock Swing Trading
- MLMA with SMA for stability
- Volume filter with higher threshold
- KEMAD with increased filter order
- Pullback entry strategy
### Forex Scalping
- MLMA with WMA and lower noise parameter
- RSI filter on current timeframe
- Use highest timeframe for trend direction only
- Mean Reversion strategy
## Webhook Configuration
- **Benefits**:
- Automated trade execution without manual intervention
- Immediate response to market conditions
- Consistent execution of your strategy
- **Implementation Notes**:
- Requires proper webhook configuration on your exchange or platform
- Test thoroughly with small position sizes before full deployment
- Consider latency between signal generation and execution
### Backtesting Period
Define a specific historical period to evaluate the bot's performance:
| Setting | Description | Default Value |
|---------|-------------|---------------|
| **Start Date** | Beginning of backtest period | January 1, 2025 |
| **End Date** | End of backtest period | December 31, 2026 |
- **Best Practice**: Test across different market conditions (bull markets, bear markets, sideways markets)
- **Limitation**: Past performance doesn't guarantee future results
## Entry and Exit Strategies
### Dual-Channel System
A key innovation of the Bober XM is its dual-channel approach:
- **Independent Parameters**: Each trade direction has its own channel settings
- **Asymmetric Trading**: Recognizes that markets often behave differently in uptrends versus downtrends
- **Optimized Performance**: Fine-tune settings for both bullish and bearish conditions
This approach allows the bot to adapt to the natural asymmetry of markets, where uptrends often develop gradually while downtrends can be sharp and sudden.
### Channel Types
#### 1. Keltner Channels
Traditional volatility-based channels using EMA and ATR:
| Setting | Long Default | Short Default |
|---------|--------------|---------------|
| **EMA Length** | 37 | 20 |
| **ATR Length** | 13 | 17 |
| **Multiplier** | 1.4 | 1.9 |
| **Source** | low | high |
- **Strengths**:
- Reliable in trending markets
- Less prone to whipsaws than Bollinger Bands
- Clear visual representation of volatility
- **Weaknesses**:
- Can lag during rapid market changes
- Less effective in choppy, non-trending markets
#### 2. Machine Learning Moving Average (MLMA)
Advanced predictive model using kernel regression (RBF kernel):
| Setting | Description | Options |
|---------|-------------|--------|
| **Source MA** | Price data used for MA calculations | Any price source (low/high/close/etc.) |
| **Moving Average Type** | Type of MA algorithm for calculations | SMA, EMA, WMA, VWMA, RMA, HMA |
| **Trend Source** | Price data used for trend determination | Any price source (close default) |
| **Window Size** | Historical window for MLMA calculations | 5+ (default: 16) |
| **Forecast Length** | Number of bars to forecast ahead | 1+ (default: 3) |
| **Noise Parameter** | Controls smoothness of prediction | 0.01+ (default: ~0.43) |
| **Band Multiplier** | Multiplier for channel width | 0.1+ (default: 0.5-0.6) |
- **Strengths**:
- Predictive rather than reactive
- Adapts quickly to changing market conditions
- Better at identifying trend reversals early
- **Weaknesses**:
- More computationally intensive
- Requires careful parameter tuning
- Can be sensitive to input data quality
### Entry Strategies
| Strategy | Description | Ideal Market Conditions |
|----------|-------------|-------------------------|
| **Breakout** | Enters when price breaks through channel bands, indicating strong momentum | High volatility, emerging trends |
| **Pullback** | Enters when price retraces to the middle band after testing extremes | Established trends with regular pullbacks |
| **Mean Reversion** | Enters at channel extremes, betting on a return to the mean | Range-bound or oscillating markets |
#### Breakout Strategy (Default)
- **Implementation**: Enters long when price crosses above the upper band, short when price crosses below the lower band
- **Strengths**: Captures strong momentum moves, performs well in trending markets
- **Weaknesses**: Can lead to late entries, higher risk of false breakouts
- **Optimization Tips**:
- Increase channel multiplier for fewer but more reliable signals
- Combine with volume confirmation for better accuracy
#### Pullback Strategy
- **Implementation**: Enters long when price pulls back to middle band during uptrend, short during downtrend pullbacks
- **Strengths**: Better entry prices, lower risk, higher probability setups
- **Weaknesses**: Misses some strong moves, requires clear trend identification
- **Optimization Tips**:
- Use with trend filters to confirm overall direction
- Adjust middle band calculation for market volatility
#### Mean Reversion Strategy
- **Implementation**: Enters long at lower band, short at upper band, expecting price to revert to the mean
- **Strengths**: Excellent entry prices, works well in ranging markets
- **Weaknesses**: Dangerous in strong trends, can lead to fighting the trend
- **Optimization Tips**:
- Implement strong trend filters to avoid counter-trend trades
- Use smaller position sizes due to higher risk nature
### Confirmation Indicators
#### Pivot Point SuperTrend
Combines pivot points with ATR-based SuperTrend for trend confirmation:
| Setting | Default Value |
|---------|---------------|
| **Pivot Period** | 25 |
| **ATR Factor** | 2.2 |
| **ATR Period** | 41 |
- **Function**: Identifies significant market turning points and confirms trend direction
- **Implementation**: Requires price to respect the SuperTrend line for trade confirmation
#### Weighted Moving Average (WMA)
Provides additional confirmation layer for entries:
| Setting | Default Value |
|---------|---------------|
| **Period** | 15 |
| **Source** | ohlc4 (average of Open, High, Low, Close) |
- **Function**: Confirms trend direction and filters out low-quality signals
- **Implementation**: Price must be above WMA for longs, below for shorts
### Exit Strategies
#### On-Balance Volume (OBV) Based Exits
Uses volume flow to identify potential reversals:
| Setting | Default Value |
|---------|---------------|
| **Source** | ohlc4 |
| **MA Type** | HMA (Options: SMA, EMA, WMA, RMA, VWMA, HMA) |
| **Period** | 22 |
- **Function**: Identifies divergences between price and volume to exit before reversals
- **Implementation**: Exits when OBV crosses its moving average in the opposite direction
- **Customizable MA Type**: Different MA types provide varying sensitivity to OBV changes:
- **SMA**: Traditional simple average, equal weight to all periods
- **EMA**: More weight to recent data, responds faster to price changes
- **WMA**: Weighted by recency, smoother than EMA
- **RMA**: Similar to EMA but smoother, reduces noise
- **VWMA**: Factors in volume, helpful for OBV confirmation
- **HMA**: Reduces lag while maintaining smoothness (default)
#### ADX Exit Confirmation
Uses Average Directional Index to confirm trend exhaustion:
| Setting | Default Value |
|---------|---------------|
| **ADX Threshold** | 35 |
| **ADX Smoothing** | 60 |
| **DI Length** | 60 |
- **Function**: Confirms trend weakness before exiting positions
- **Implementation**: Requires ADX to drop below threshold or DI lines to cross
## Filter System
### RSI Filter
- **Function**: Controls entries based on momentum conditions
- **Parameters**:
- Period: 15 (default)
- Overbought level: 71
- Oversold level: 23
- Multi-timeframe support: Current, MTF1 (15min), or MTF2 (4h)
- Customizable price source (open, high, low, close, hl2, hlc3, ohlc4)
- **Implementation**: Blocks long entries when RSI > overbought, short entries when RSI < oversold
### Volatility Filter
- **Function**: Prevents trading during excessive market volatility
- **Parameters**:
- Measure: ATR (Average True Range)
- Period: Customizable (default varies by timeframe)
- Threshold: Adjustable multiplier
- Multi-timeframe support
- Customizable price source
- **Implementation**: Blocks trades when current volatility exceeds threshold × average volatility
### Volume Filter
- **Function**: Ensures adequate market liquidity for trades
- **Parameters**:
- Threshold: 0.4× average (default)
- Measurement period: 5 (default)
- Moving average type: Customizable (HMA default)
- Multi-timeframe support
- Customizable price source
- **Implementation**: Requires current volume to exceed threshold × average volume
### Bollinger Bands Filter
- **Function**: Controls entries based on price relative to statistical boundaries
- **Parameters**:
- Period: Customizable
- Standard deviation multiplier: Adjustable
- Moving average type: Customizable
- Multi-timeframe support
- Customizable price source
- **Implementation**: Can require price to be within bands or breaking out of bands depending on strategy
### KEMAD Filter (Kalman EMA Distance)
- **Function**: Advanced trend confirmation using Kalman filter algorithm
- **Parameters**:
- Process Noise: 0.35 (controls smoothness)
- Measurement Noise: 24 (controls reactivity)
- Filter Order: 6 (higher = more smoothing)
- ATR Length: 8 (for bandwidth calculation)
- Upper Multiplier: 2.0 (for long signals)
- Lower Multiplier: 2.7 (for short signals)
- Multi-timeframe support
- Customizable visual indicators
- **Implementation**: Generates signals based on price position relative to Kalman-filtered EMA bands
## Risk Management System
### Position Sizing
Automatically calculates position size based on account equity and risk parameters:
| Setting | Default Value |
|---------|---------------|
| **Risk % of Equity** | 50% |
- **Implementation**:
- Position size = (Account equity × Risk %) ÷ (Entry price × Stop loss distance)
- Adjusts automatically based on volatility and stop placement
- **Best Practices**:
- Start with lower risk percentages (1-2%) until strategy is proven
- Consider reducing risk during high volatility periods
### Stop-Loss Methods
Multiple stop-loss calculation methods with separate configurations for long and short positions:
| Method | Description | Configuration |
|--------|-------------|---------------|
| **ATR-Based** | Dynamic stops based on volatility | ATR Period: 14, Multiplier: 2.0 |
| **Percentage** | Fixed percentage from entry | Long: 1.5%, Short: 1.5% |
| **PIP-Based** | Fixed currency unit distance | 10.0 pips |
- **Implementation Notes**:
- ATR-based stops adapt to changing market volatility
- Percentage stops maintain consistent risk exposure
- PIP-based stops provide precise control in stable markets
### Trailing Stops
Locks in profits by adjusting stop-loss levels as price moves favorably:
| Setting | Default Value |
|---------|---------------|
| **Stop-Loss %** | 1.5% |
| **Activation Threshold** | 2.1% |
| **Trailing Distance** | 1.4% |
- **Implementation**:
- Initial stop remains fixed until profit reaches activation threshold
- Once activated, stop follows price at specified distance
- Locks in profit while allowing room for normal price fluctuations
### Risk-Reward Parameters
Defines the relationship between risk and potential reward:
| Setting | Default Value |
|---------|---------------|
| **Risk-Reward Ratio** | 1.4 |
| **Take Profit %** | 2.4% |
| **Stop-Loss %** | 1.5% |
- **Implementation**:
- Take profit distance = Stop loss distance × Risk-reward ratio
- Higher ratios require fewer winning trades for profitability
- Lower ratios increase win rate but reduce average profit
### Filter Combinations
The strategy allows for simultaneous application of multiple filters:
- **Recommended Combinations**:
- Trending markets: RSI + KEMAD filters
- Ranging markets: Bollinger Bands + Volatility filters
- All markets: Volume filter as minimum requirement
- **Performance Impact**:
- Each additional filter reduces the number of trades
- Quality of remaining trades typically improves
- Optimal combination depends on market conditions and timeframe
### Multi-Timeframe Filter Applications
| Filter Type | Current Timeframe | MTF1 (15min) | MTF2 (4h) |
|-------------|-------------------|-------------|------------|
| RSI | Quick entries/exits | Intraday trend | Overall trend |
| Volume | Immediate liquidity | Sustained support | Market participation |
| Volatility | Entry timing | Short-term risk | Regime changes |
| KEMAD | Precise signals | Trend confirmation | Major reversals |
## Visual Indicators and Chart Analysis
The bot provides comprehensive visual feedback on the chart:
- **Channel Bands**: Keltner or MLMA bands showing potential support/resistance
- **Pivot SuperTrend**: Colored line showing trend direction and potential reversal points
- **Entry/Exit Markers**: Annotations showing actual trade entries and exits
- **Risk/Reward Zones**: Visual representation of stop-loss and take-profit levels
These visual elements allow for:
- Real-time strategy assessment
- Post-trade analysis and optimization
- Educational understanding of the strategy logic
## Implementation Guide
### TradingView Setup
1. Load the script in TradingView Pine Editor
2. Apply to your preferred chart and timeframe
3. Adjust parameters based on your trading preferences
4. Enable alerts for webhook integration
### Webhook Integration
1. Configure webhook URL in TradingView alerts
2. Set up receiving endpoint on your trading platform
3. Define message format matching the bot's output
4. Test with small position sizes before full deployment
### Optimization Process
1. Backtest across different market conditions
2. Identify parameter sensitivity through multiple tests
3. Focus on risk management parameters first
4. Fine-tune entry/exit conditions based on performance metrics
5. Validate with out-of-sample testing
## Performance Considerations
### Strengths
- Adaptability to different market conditions through dual channels
- Multiple layers of confirmation reducing false signals
- Comprehensive risk management protecting capital
- Machine learning integration for predictive edge
### Limitations
- Complex parameter set requiring careful optimization
- Potential over-optimization risk with so many variables
- Computational intensity of MLMA calculations
- Dependency on proper webhook configuration for execution
### Best Practices
- Start with conservative risk settings (1-2% of equity)
- Test thoroughly in demo environment before live trading
- Monitor performance regularly and adjust parameters
- Consider market regime changes when evaluating results
## Conclusion
The ₿ober XM v2.0 represents a significant evolution in trading strategy design, combining traditional technical analysis with machine learning elements and multi-timeframe analysis. The core strength of this system lies in its adaptability and recognition of market asymmetry.
### Market Asymmetry and Adaptive Approach
The strategy acknowledges a fundamental truth about markets: bullish and bearish phases behave differently and should be treated as distinct environments. The dual-channel system with separate parameters for long and short positions directly addresses this asymmetry, allowing for optimized performance regardless of market direction.
### Targeted Backtesting Philosophy
It's counterproductive to run backtests over excessively long periods. Markets evolve continuously, and strategies that worked in previous market regimes may be ineffective in current conditions. Instead:
- Test specific market phases separately (bull markets, bear markets, range-bound periods)
- Regularly re-optimize parameters as market conditions change
- Focus on recent performance with higher weight than historical results
- Test across multiple timeframes to ensure robustness
### Multi-Timeframe Analysis as a Game-Changer
The integration of multi-timeframe analysis fundamentally transforms the strategy's effectiveness:
- **Increased Safety**: Higher timeframe confirmations reduce false signals and improve trade quality
- **Context Awareness**: Decisions made with awareness of larger trends reduce adverse entries
- **Adaptable Precision**: Apply strict filters on lower timeframes while maintaining awareness of broader conditions
- **Reduced Noise**: Higher timeframe data naturally filters market noise that can trigger poor entries
The ₿ober XM v2.0 provides traders with a framework that acknowledges market complexity while offering practical tools to navigate it. With proper setup, realistic expectations, and attention to changing market conditions, it delivers a sophisticated approach to systematic trading that can be continuously refined and optimized.

HMA 200 + EMA 20 Crossover StrategyThis strategy combines a long-term trend filter using the Hull Moving Average (HMA 200) with a short-term entry trigger using the Exponential Moving Average (EMA 20).
📈 Entry Logic:
Buy Entry: When price is above the HMA 200 and crosses above the EMA 20.
Sell Entry: When price is below the HMA 200 and crosses below the EMA 20.
The strategy closes the current position and reverses on the opposite signal.
⚙️ Strategy Settings (Backtest Configuration):
Position size: 10% of equity per trade
Commission: 0.1% per trade (to simulate broker fees)
Slippage: 2 ticks (to reflect realistic fill conditions)
✅ Purpose:
This script is designed to identify high-probability trades in the direction of the overall trend, avoiding whipsaw conditions. It is useful for traders looking for a dynamic crossover-based system that filters trades based on longer-term momentum.
🔎 Make sure to test across multiple assets and timeframes. For best results, apply this strategy to liquid trending markets like major FX pairs, indices, or high-cap stocks.

Dskyz (DAFE) Aurora Divergence – Quant Master Dskyz (DAFE) Aurora Divergence – Quant Master
Introducing the Dskyz (DAFE) Aurora Divergence – Quant Master , a strategy that’s your secret weapon for mastering futures markets like MNQ, NQ, MES, and ES. Born from the legendary Aurora Divergence indicator, this fully automated system transforms raw divergence signals into a quant-grade trading machine, blending precision, risk management, and cyberpunk DAFE visuals that make your charts glow like a neon skyline. Crafted with care and driven by community passion, this strategy stands out in a sea of generic scripts, offering traders a unique edge to outsmart institutional traps and navigate volatile markets.
The Aurora Divergence indicator was a cult favorite for spotting price-OBV divergences with its aqua and fuchsia orbs, but traders craved a system to act on those signals with discipline and automation. This strategy delivers, layering advanced filters (z-score, ATR, multi-timeframe, session), dynamic risk controls (kill switches, adaptive stops/TPs), and a real-time dashboard to turn insights into profits. Whether you’re a newbie dipping into futures or a pro hunting reversals, this strat’s got your back with a beginner guide, alerts, and visuals that make trading feel like a sci-fi mission. Let’s dive into every detail and see why this original DAFE creation is a must-have.
Why Traders Need This Strategy
Futures markets are a battlefield—fast-paced, volatile, and riddled with institutional games that can wipe out undisciplined traders. From the April 28, 2025 NQ 1k-point drop to sneaky ES slippage, the stakes are high. Meanwhile, platforms are flooded with unoriginal, low-effort scripts that promise the moon but deliver noise. The Aurora Divergence – Quant Master rises above, offering:
Unmatched Originality: A bespoke system built from the ground up, with custom divergence logic, DAFE visuals, and quant filters that set it apart from copycat clutter.
Automation with Precision: Executes trades on divergence signals, eliminating emotional slip-ups and ensuring consistency, even in chaotic sessions.
Quant-Grade Filters: Z-score, ATR, multi-timeframe, and session checks filter out noise, targeting high-probability reversals.
Robust Risk Management: Daily loss and rolling drawdown kill switches, plus ATR-based stops/TPs, protect your capital like a fortress.
Stunning DAFE Visuals: Aqua/fuchsia orbs, aurora bands, and a glowing dashboard make signals intuitive and charts a work of art.
Community-Driven: Evolved from trader feedback, this strat’s a labor of love, not a recycled knockoff.
Traders need this because it’s a complete, original system that blends accessibility, sophistication, and style. It’s your edge to trade smarter, not harder, in a market full of traps and imitators.
1. Divergence Detection (Core Signal Logic)
The strategy’s core is its ability to detect bullish and bearish divergences between price and On-Balance Volume (OBV), pinpointing reversals with surgical accuracy.
How It Works:
Price Slope: Uses linear regression over a lookback (default: 9 bars) to measure price momentum (priceSlope).
OBV Slope: OBV tracks volume flow (+volume if price rises, -volume if falls), with its slope calculated similarly (obvSlope).
Bullish Divergence: Price slope negative (falling), OBV slope positive (rising), and price above 50-bar SMA (trend_ma).
Bearish Divergence: Price slope positive (rising), OBV slope negative (falling), and price below 50-bar SMA.
Smoothing: Requires two consecutive divergence bars (bullDiv2, bearDiv2) to confirm signals, reducing false positives.
Strength: Divergence intensity (divStrength = |priceSlope * obvSlope| * sensitivity) is normalized (0–1, divStrengthNorm) for visuals.
Why It’s Brilliant:
- Divergences catch hidden momentum shifts, often exploited by institutions, giving you an edge on reversals.
- The 50-bar SMA filter aligns signals with the broader trend, avoiding choppy markets.
- Adjustable lookback (min: 3) and sensitivity (default: 1.0) let you tune for different instruments or timeframes.
2. Filters for Precision
Four advanced filters ensure signals are high-probability and market-aligned, cutting through the noise of volatile futures.
Z-Score Filter:
Logic: Calculates z-score ((close - SMA) / stdev) over a lookback (default: 50 bars). Blocks entries if |z-score| > threshold (default: 1.5) unless disabled (useZFilter = false).
Impact: Avoids trades during extreme price moves (e.g., blow-off tops), keeping you in statistically safe zones.
ATR Percentile Volatility Filter:
Logic: Tracks 14-bar ATR in a 100-bar window (default). Requires current ATR > 80th percentile (percATR) to trade (tradeOk).
Impact: Ensures sufficient volatility for meaningful moves, filtering out low-volume chop.
Multi-Timeframe (HTF) Trend Filter:
Logic: Uses a 50-bar SMA on a higher timeframe (default: 60min). Longs require price > HTF MA (bullTrendOK), shorts < HTF MA (bearTrendOK).
Impact: Aligns trades with the bigger trend, reducing counter-trend losses.
US Session Filter:
Logic: Restricts trading to 9:30am–4:00pm ET (default: enabled, useSession = true) using America/New_York timezone.
Impact: Focuses on high-liquidity hours, avoiding overnight spreads and erratic moves.
Evolution:
- These filters create a robust signal pipeline, ensuring trades are timed for optimal conditions.
- Customizable inputs (e.g., zThreshold, atrPercentile) let traders adapt to their style without compromising quality.
3. Risk Management
The strategy’s risk controls are a masterclass in balancing aggression and safety, protecting capital in volatile markets.
Daily Loss Kill Switch:
Logic: Tracks daily loss (dayStartEquity - strategy.equity). Halts trading if loss ≥ $300 (default) and enabled (killSwitch = true, killSwitchActive).
Impact: Caps daily downside, crucial during events like April 27, 2025 ES slippage.
Rolling Drawdown Kill Switch:
Logic: Monitors drawdown (rollingPeak - strategy.equity) over 100 bars (default). Stops trading if > $1000 (rollingKill).
Impact: Prevents prolonged losing streaks, preserving capital for better setups.
Dynamic Stop-Loss and Take-Profit:
Logic: Stops = entry ± ATR * multiplier (default: 1.0x, stopDist). TPs = entry ± ATR * 1.5x (profitDist). Longs: stop below, TP above; shorts: vice versa.
Impact: Adapts to volatility, keeping stops tight but realistic, with TPs targeting 1.5:1 reward/risk.
Max Bars in Trade:
Logic: Closes trades after 8 bars (default) if not already exited.
Impact: Frees capital from stagnant trades, maintaining efficiency.
Kill Switch Buffer Dashboard:
Logic: Shows smallest buffer ($300 - daily loss or $1000 - rolling DD). Displays 0 (red) if kill switch active, else buffer (green).
Impact: Real-time risk visibility, letting traders adjust dynamically.
Why It’s Brilliant:
- Kill switches and ATR-based exits create a safety net, rare in generic scripts.
- Customizable risk inputs (maxDailyLoss, dynamicStopMult) suit different account sizes.
- Buffer metric empowers disciplined trading, a DAFE signature.
4. Trade Entry and Exit Logic
The entry/exit rules are precise, filtered, and adaptive, ensuring trades are deliberate and profitable.
Entry Conditions:
Long Entry: bullDiv2, cooldown passed (canSignal), ATR filter passed (tradeOk), in US session (inSession), no kill switches (not killSwitchActive, not rollingKill), z-score OK (zOk), HTF trend bullish (bullTrendOK), no existing long (lastDirection != 1, position_size <= 0). Closes shorts first.
Short Entry: Same, but for bearDiv2, bearTrendOK, no long (lastDirection != -1, position_size >= 0). Closes longs first.
Adaptive Cooldown: Default 2 bars (cooldownBars). Doubles (up to 10) after a losing trade, resets after wins (dynamicCooldown).
Exit Conditions:
Stop-Loss/Take-Profit: Set per trade (ATR-based). Exits on stop/TP hits.
Other Exits: Closes if maxBarsInTrade reached, ATR filter fails, or kill switch activates.
Position Management: Ensures no conflicting positions, closing opposites before new entries.
Built To Be Reliable and Consistent:
- Multi-filtered entries minimize false signals, a stark contrast to basic scripts.
- Adaptive cooldown prevents overtrading, especially after losses.
- Clean position handling ensures smooth execution, even in fast markets.
5. DAFE Visuals
The visuals are a DAFE hallmark, blending function with clean flair to make signals intuitive and charts stunning.
Aurora Bands:
Display: Bands around price during divergences (bullish: below low, bearish: above high), sized by ATR * bandwidth (default: 0.5).
Colors: Aqua (bullish), fuchsia (bearish), with transparency tied to divStrengthNorm.
Purpose: Highlights divergence zones with a glowing, futuristic vibe.
Divergence Orbs:
Display: Large/small circles (aqua below for bullish, fuchsia above for bearish) when bullDiv2/bearDiv2 and canSignal. Labels show strength (0–1).
Purpose: Pinpoints entries with eye-catching clarity.
Gradient Background:
Display: Green (bullish), red (bearish), or gray (neutral), 90–95% transparent.
Purpose: Sets the market mood without clutter.
Strategy Plots:
- Stop/TP Lines: Red (stops), green (TPs) for active trades.
- HTF MA: Yellow line for trend context.
- Z-Score: Blue step-line (if enabled).
- Kill Switch Warning: Red background flash when active.
What Makes This Next-Level?:
- Visuals make complex signals (divergences, filters) instantly clear, even for beginners.
- DAFE’s unique aesthetic (orbs, bands) sets it apart from generic scripts, reinforcing originality.
- Functional plots (stops, TPs) enhance trade management.
6. Metrics Dashboard
The top-right dashboard (2x8 table) is your command center, delivering real-time insights.
Metrics:
Daily Loss ($): Current loss vs. day’s start, red if > $300.
Rolling DD ($): Drawdown vs. 100-bar peak, red if > $1000.
ATR Threshold: Current percATR, green if ATR exceeds, red if not.
Z-Score: Current value, green if within threshold, red if not.
Signal: “Bullish Div” (aqua), “Bearish Div” (fuchsia), or “None” (gray).
Action: “Consider Buying”/“Consider Selling” (signal color) or “Wait” (gray).
Kill Switch Buffer ($): Smallest buffer to kill switch, green if > 0, red if 0.
Why This Is Important?:
- Consolidates critical data, making decisions effortless.
- Color-coded metrics guide beginners (e.g., green action = go).
- Buffer metric adds transparency, rare in off-the-shelf scripts.
7. Beginner Guide
Beginner Guide: Middle-right table (shown once on chart load), explains aqua orbs (bullish, buy) and fuchsia orbs (bearish, sell).
Key Features:
Futures-Optimized: Tailored for MNQ, NQ, MES, ES with point-value adjustments.
Highly Customizable: Inputs for lookback, sensitivity, filters, and risk settings.
Real-Time Insights: Dashboard and visuals update every bar.
Backtest-Ready: Fixed qty and tick calc for accurate historical testing.
User-Friendly: Guide, visuals, and dashboard make it accessible yet powerful.
Original Design: DAFE’s unique logic and visuals stand out from generic scripts.
How to Use
Add to Chart: Load on a 5min MNQ/ES chart in TradingView.
Configure Inputs: Adjust instrument, filters, or risk (defaults optimized for MNQ).
Monitor Dashboard: Watch signals, actions, and risk metrics (top-right).
Backtest: Run in strategy tester to evaluate performance.
Live Trade: Connect to a broker (e.g., Tradovate) for automation. Watch for slippage (e.g., April 27, 2025 ES issues).
Replay Test: Use bar replay (e.g., April 28, 2025 NQ drop) to test volatility handling.
Disclaimer
Trading futures involves significant risk of loss and is not suitable for all investors. Past performance is not indicative of future results. Backtest results may not reflect live trading due to slippage, fees, or market conditions. Use this strategy at your own risk, and consult a financial advisor before trading. Dskyz (DAFE) Trading Systems is not responsible for any losses incurred.
Backtesting:
Frame: 2023-09-20 - 2025-04-29
Fee Typical Range (per side, per contract)
CME Exchange $1.14 – $1.20
Clearing $0.10 – $0.30
NFA Regulatory $0.02
Firm/Broker Commis. $0.25 – $0.80 (retail prop)
TOTAL $1.60 – $2.30 per side
Round Turn: (enter+exit) = $3.20 – $4.60 per contract
Final Notes
The Dskyz (DAFE) Aurora Divergence – Quant Master isn’t just a strategy—it’s a movement. Crafted with originality and driven by community passion, it rises above the flood of generic scripts to deliver a system that’s as powerful as it is beautiful. With its quant-grade logic, DAFE visuals, and robust risk controls, it empowers traders to tackle futures with confidence and style. Join the DAFE crew, light up your charts, and let’s outsmart the markets together!
(This publishing will most likely be taken down do to some miscellaneous rule about properly displaying charting symbols, or whatever. Once I've identified what part of the publishing they want to pick on, I'll adjust and repost.)
Use it with discipline. Use it with clarity. Trade smarter.
**I will continue to release incredible strategies and indicators until I turn this into a brand or until someone offers me a contract.
Created by Dskyz, powered by DAFE Trading Systems. Trade fast, trade bold.

Breadth-Driven Swing StrategyWhat it does
This script trades the S&P 500 purely on market breadth extremes:
• Data source : INDEX:S5TH = % of S&P 500 stocks above their own 200-day SMA (range 0–100).
• Buy when breadth is washed-out.
• Sell when breadth is overheated.
It is long-only by design; shorting and ATR trailing stops have been removed to keep the logic minimal and transparent.
⸻
Signals in plain English
1. Long entry
A. A 200-EMA trough in breadth is printed and the trough value is ≤ 40 %.
or
B. A 5-EMA trough appears, its prominence passes the user threshold, and the lowest breadth reading in the last 20 bars is ≤ 20 %.
(Toggle this secondary trigger on/off with “ Enter also on 5-EMA trough ”.)
2. Exit (close long)
First 200-EMA peak whose breadth value is ≥ 70 %.
3. Risk control
A fixed stop-loss (% of entry price, default 8 %) is attached to every long trade.
⸻
Key parameters (defaults shown)
• Long EMA length 200 • Short EMA length 5
• Peak prominence 0.5 pct-pts • Trough prominence 3 pct-pts
• Peak level 70 % • Trough level 40 % • 5-EMA trough level 20 %
• Fixed stop-loss 8 %
• “Enter also on 5-EMA trough” = true (allows additional entries on extreme momentum reversals)
Feel free to tighten or relax any of these thresholds to match your risk profile or account for different market regimes.
⸻
How to use it
1. Load the script on a daily SPX / SPY chart.
(The price chart drives order execution; the breadth series is pulled internally and does not need to be on the chart.)
2. Verify the breadth feed.
INDEX:S5TH is updated after each session; your broker must provide it.
3. Back-test across several cycles.
Two decades of daily data is recommended to see how the rules behave in bear markets, range markets, and bull trends.
4. Adjust position sizing in the Properties tab.
The default is “100 % of equity”; change it if you prefer smaller allocations or pyramiding caps.
⸻
Why it can help
• Breadth signals often lead price, allowing entries before index-level momentum turns.
• Simple, rule-based exits prevent “waiting for confirmation” paralysis.
• Only one input series—easy to audit, no black-box math.
Trade-offs
• Relies on a single breadth metric; other internals (advance/decline, equal-weight returns, etc.) are ignored.
• May sit in cash during shallow pullbacks that never push breadth ≤ 40 %.
• Signals arrive at the end of the session (breadth is EoD data).
⸻
Disclaimer
This script is provided for educational purposes only and is not financial advice. Markets are risky; test thoroughly and use your own judgment before trading real money.
ストラテジー概要
本スクリプトは S&P500 のマーケットブレッド(内部需給) だけを手がかりに、指数をスイングトレードします。
• ブレッドデータ : INDEX:S5TH
(S&P500 採用銘柄のうち、それぞれの 200 日移動平均線を上回っている銘柄比率。0–100 %)
• 買い : ブレッドが極端に売られたタイミング。
• 売り : ブレッドが過熱状態に達したタイミング。
余計な機能を削り、ロングオンリー & 固定ストップ のシンプル設計にしています。
⸻
シグナルの流れ
1. ロングエントリー
• 条件 A : 200-EMA がトラフを付け、その値が 40 % 以下
• 条件 B : 5-EMA がトラフを付け、
・プロミネンス条件を満たし
・直近 20 本のブレッドス最小値が 20 % 以下
• B 条件は「5-EMA トラフでもエントリー」を ON にすると有効
2. ロング決済
最初に出現した 200-EMA ピーク で、かつ値が 70 % 以上 のバーで手仕舞い。
3. リスク管理
各トレードに 固定ストップ(初期価格から 8 %)を設定。
⸻
主なパラメータ(デフォルト値)
• 長期 EMA 長さ : 200 • 短期 EMA 長さ : 5
• ピーク判定プロミネンス : 0.5 %pt • トラフ判定プロミネンス : 3 %pt
• ピーク水準 : 70 % • トラフ水準 : 40 % • 5-EMA トラフ水準 : 20 %
• 固定ストップ : 8 %
• 「5-EMA トラフでもエントリー」 : ON
相場環境やリスク許容度に合わせて閾値を調整してください。
⸻
使い方
1. 日足の SPX / SPY チャート にスクリプトを適用。
2. ブレッドデータの供給 (INDEX:S5TH) がブローカーで利用可能か確認。
3. 20 年以上の期間でバックテスト し、強気相場・弱気相場・レンジ局面での挙動を確認。
4. 資金配分 は プロパティ → 戦略実行 で調整可能(初期値は「資金の 100 %」)。
⸻
強み
• ブレッドは 価格より先行 することが多く、天底を早期に捉えやすい。
• ルールベースの出口で「もう少し待とう」と迷わずに済む。
• 入力 series は 1 本のみ、ブラックボックス要素なし。
注意点・弱み
• 単一指標に依存。他の内部需給(A/D ライン等)は考慮しない。
• 40 % を割らない浅い押し目では機会損失が起こる。
• ブレッドは終値ベースの更新。ザラ場中の変化は捉えられない。
⸻
免責事項
本スクリプトは 学習目的 で提供しています。投資助言ではありません。
実取引の前に必ず自己責任で十分な検証とリスク管理を行ってください。

Dskyz (DAFE) MAtrix with ATR-Powered Precision Dskyz (DAFE) MAtrix with ATR-Powered Precision
This cutting‐edge futures trading strategy built to thrive in rapidly changing market conditions. Developed for high-frequency futures trading on instruments such as the CME Mini MNQ, this strategy leverages a matrix of sophisticated moving averages combined with ATR-based filters to pinpoint high-probability entries and exits. Its unique combination of adaptable technical indicators and multi-timeframe trend filtering sets it apart from standard strategies, providing enhanced precision and dynamic responsiveness.
imgur.com
Core Functional Components
1. Advanced Moving Averages
A distinguishing feature of the DAFE strategy is its robust, multi-choice moving averages (MAs). Clients can choose from a wide array of MAs—each with specific strengths—in order to fine-tune their trading signals. The code includes user-defined functions for the following MAs:
imgur.com
Hull Moving Average (HMA):
The hma(src, len) function calculates the HMA by using weighted moving averages (WMAs) to reduce lag considerably while smoothing price data. This function computes an intermediate WMA of half the specified length, then a full-length WMA, and finally applies a further WMA over the square root of the length. This design allows for rapid adaptation to price changes without the typical delays of traditional moving averages.
Triple Exponential Moving Average (TEMA):
Implemented via tema(src, len), TEMA uses three consecutive exponential moving averages (EMAs) to effectively cancel out lag and capture price momentum. The final formula—3 * (ema1 - ema2) + ema3—produces a highly responsive indicator that filters out short-term noise.
Double Exponential Moving Average (DEMA):
Through the dema(src, len) function, DEMA calculates an EMA and then a second EMA on top of it. Its simplified formula of 2 * ema1 - ema2 provides a smoother curve than a single EMA while maintaining enhanced responsiveness.
Volume Weighted Moving Average (VWMA):
With vwma(src, len), this MA accounts for trading volume by weighting the price, thereby offering a more contextual picture of market activity. This is crucial when volume spikes indicate significant moves.
Zero Lag EMA (ZLEMA):
The zlema(src, len) function applies a correction to reduce the inherent lag found in EMAs. By subtracting a calculated lag (based on half the moving average window), ZLEMA is exceptionally attuned to recent price movements.
Arnaud Legoux Moving Average (ALMA):
The alma(src, len, offset, sigma) function introduces ALMA—a type of moving average designed to be less affected by outliers. With parameters for offset and sigma, it allows customization of the degree to which the MA reacts to market noise.
Kaufman Adaptive Moving Average (KAMA):
The custom kama(src, len) function is noteworthy for its adaptive nature. It computes an efficiency ratio by comparing price change against volatility, then dynamically adjusts its smoothing constant. This results in an MA that quickly responds during trending periods while remaining smoothed during consolidation.
Each of these functions—integrated into the strategy—is selectable by the trader (via the fastMAType and slowMAType inputs). This flexibility permits the tailored application of the MA most suited to current market dynamics and individual risk management preferences.
2. ATR-Based Filters and Risk Controls
ATR Calculation and Volatility Filter:
The strategy computes the Average True Range (ATR) over a user-defined period (atrPeriod). ATR is then used to derive both:
Volatility Assessment: Expressed as a ratio of ATR to closing price, ensuring that trades are taken only when volatility remains within a safe, predefined threshold (volatilityThreshold).
ATR-Based Entry Filters: Implemented as atrFilterLong and atrFilterShort, these conditions ensure that for long entries the price is sufficiently above the slow MA and vice versa for shorts. This acts as an additional confirmation filter.
Dynamic Exit Management:
The exit logic employs a dual approach:
Fixed Stop and Profit Target: Stops and targets are set at multiples of ATR (fixedStopMultiplier and profitTargetATRMult), helping manage risk in volatile markets.
Trailing Stop Adjustments: A trailing stop is calculated using the ATR multiplied by a user-defined offset (trailOffset), which captures additional profits as the trade moves favorably while protecting against reversals.
3. Multi-Timeframe Trend Filtering
The strategy enhances its signal reliability by leveraging a secondary, higher timeframe analysis:
15-Minute Trend Analysis:
By retrieving 15-minute moving averages (fastMA15m and slowMA15m) via request.security, the strategy determines the broader market trend. This secondary filter (enabled or disabled through useTrendFilter) ensures that entries are aligned with the prevailing market direction, thereby reducing the incidence of false signals.
4. Signal and Execution Logic
Combined MA Alignment:
The entry conditions are based primarily on the alignment of the fast and slow MAs. A long condition is triggered when the current price is above both MAs and the fast MA is above the slow MA—complemented by the ATR filter and volume conditions. The reverse applies for a short condition.
Volume and Time Window Validation:
Trades are permitted only if the current volume exceeds a minimum (minVolume) and the current hour falls within the predefined trading window (tradingStartHour to tradingEndHour). An additional volume spike check (comparing current volume to a moving average of past volumes) further filters for optimal market conditions.
Comprehensive Order Execution:
The strategy utilizes flexible order execution functions that allow pyramiding (up to 10 positions), ensuring that it can scale into positions as favorable conditions persist. The use of both market entries and automated exits (with profit targets, stop-losses, and trailing stops) ensures that risk is managed at every step.
5. Integrated Dashboard and Metrics
For transparency and real-time analysis, the strategy includes:
On-Chart Visualizations:
Both fast and slow MAs are plotted on the chart, making it easy to see the market’s technical foundation.
Dynamic Metrics Dashboard:
A built-in table displays crucial performance statistics—including current profit/loss, equity, ATR (both raw and as a percentage), and the percentage gap between the moving averages. These metrics offer immediate insight into the health and performance of the strategy.
Input Parameters: Detailed Breakdown
Every input is meticulously designed to offer granular control:
Fast & Slow Lengths:
Determine the window size for the fast and slow moving averages. Smaller values yield more sensitivity, while larger values provide a smoother, delayed response.
Fast/Slow MA Types:
Choose the type of moving average for fast and slow signals. The versatility—from basic SMA and EMA to more complex ones like HMA, TEMA, ZLEMA, ALMA, and KAMA—allows customization to fit different market scenarios.
ATR Parameters:
atrPeriod and atrMultiplier shape the volatility assessment, directly affecting entry filters and risk management through stop-loss and profit target levels.
Trend and Volume Filters:
Inputs such as useTrendFilter, minVolume, and the volume spike condition help confirm that a trade occurs in active, trending markets rather than during periods of low liquidity or market noise.
Trading Hours:
Restricting trade execution to specific hours (tradingStartHour and tradingEndHour) helps avoid illiquid or choppy markets outside of prime trading sessions.
Exit Strategies:
Parameters like trailOffset, profitTargetATRMult, and fixedStopMultiplier provide multiple layers of risk management and profit protection by tailoring how exits are generated relative to current market conditions.
Pyramiding and Fixed Trade Quantity:
The strategy supports multiple entries within a trend (up to 10 positions) and sets a predefined trade quantity (fixedQuantity) to maintain consistent exposure and risk per trade.
Dashboard Controls:
The resetDashboard input allows for on-the-fly resetting of performance metrics, keeping the strategy’s performance dashboard accurate and up-to-date.
Why This Strategy is Truly Exceptional
Multi-Faceted Adaptability:
The ability to switch seamlessly between various moving average types—each suited to particular market conditions—enables the strategy to adapt dynamically. This is a testament to the high level of coding sophistication and market insight infused within the system.
Robust Risk Management:
The integration of ATR-based stops, profit targets, and trailing stops ensures that every trade is executed with well-defined risk parameters. The system is designed to mitigate unexpected market swings while optimizing profit capture.
Comprehensive Market Filtering:
By combining moving average crossovers with volume analysis, volatility thresholds, and multi-timeframe trend filters, the strategy only enters trades under the most favorable conditions. This multi-layered filtering reduces noise and enhances signal quality.
-Final Thoughts-
The Dskyz Adaptive Futures Elite (DAFE) MAtrix with ATR-Powered Precision strategy is not just another trading algorithm—it is a multi-dimensional, fully customizable system built on advanced technical principles and sophisticated risk management techniques. Every function and input parameter has been carefully engineered to provide traders with a system that is both powerful and transparent.
For clients seeking a state-of-the-art trading solution that adapts dynamically to market conditions while maintaining strict discipline in risk management, this strategy truly stands in a class of its own.
****Please show support if you enjoyed this strategy. I'll have more coming out in the near future!!
-Dskyz
Caution
DAFE is experimental, not a profit guarantee. Futures trading risks significant losses due to leverage. Backtest, simulate, and monitor actively before live use. All trading decisions are your responsibility.

Heiken Ashi Supertrend ADX - StrategyHeiken Ashi Supertrend ADX Strategy
Overview
This strategy combines the power of Heiken Ashi candles, Supertrend indicator, and ADX filter to identify strong trend movements across multiple timeframes. Designed primarily for the cryptocurrency market but adaptable to any tradable asset, this system focuses on capturing momentum in established trends while employing a sophisticated triple-layer stop loss mechanism to protect capital and secure profits.
Strategy Mechanics
Entry Signals
The strategy uses a unique blend of technical signals to identify high-probability trade entries:
Heiken Ashi Candles: Looks specifically for Heiken Ashi candles with minimal or no wicks, which signal strong momentum and trend continuation. These "full-bodied" candles represent periods where price moved decisively in one direction with minimal retracement.
Supertrend Filter : Confirms the underlying trend direction using the Supertrend indicator (default factor: 3.0, ATR period: 10). Entries are aligned with the prevailing Supertrend direction.
ADX Filter (Optional) : Can be enabled to focus only on stronger trending conditions, filtering out choppy or ranging markets. When enabled, trades only trigger when ADX is above the specified threshold (default: 25).
Exit Signals
Positions are closed when either:
An opposing signal appears (Heiken Ashi candle with no wick in the opposite direction)
Any of the three stop loss mechanisms are triggered
Triple-Layer Stop Loss System
The strategy employs a sophisticated three-tier stop loss approach:
ATR Trailing Stop: Adapts to market volatility and locks in profits as the trend extends. This stop moves in the direction of the trade, capturing profit without exiting too early during normal price fluctuations.
Swing Point Stop : Uses natural market structure (recent highs/lows over a lookback period) to place stops at logical support/resistance levels, honoring the market's own rhythm.
Insurance Stop: A percentage-based safety net that protects against sudden adverse moves immediately after entry. This is particularly valuable when the swing point stop might be positioned too far from entry, providing immediate capital protection.
Optimization Features
Customizable Filters: All components (Supertrend, ADX) can be enabled/disabled to adapt to different market conditions
Adjustable Parameters: Fine-tune ATR periods, Supertrend factors, and ADX thresholds
Flexible Stop Loss Settings: Each of the three stop loss mechanisms can be individually enabled/disabled with customizable parameters
Best Practices for Implementation
Recommended Timeframes: Works best on 4-hour charts and above, where trends develop more reliably
Market Conditions: Performs well across various market conditions due to the ADX filter's ability to identify meaningful trends
Position Sizing: The strategy uses a percentage of equity approach (default: 3%) for position sizing
Performance Characteristics
When properly optimized, this strategy has demonstrated profit factors exceeding 3 in backtesting. The approach typically produces generous winners while limiting losses through its multi-layered stop loss system. The ATR trailing stop is particularly effective at capturing extended trends, while the insurance stop provides immediate protection against adverse moves.
The visual components on the chart make it easy to follow the strategy's logic, with position status, entry prices, and current stop levels clearly displayed.
This strategy represents a complete trading system with clearly defined entry and exit rules, adaptive stop loss mechanisms, and built-in risk management through position sizing.

Dskyz Adaptive Futures Elite (DAFE)Dskyz Adaptive Futures Edge (DAFE)
imgur.com
A Dynamic Futures Trading Strategy
DAFE adapts to market volatility and price action using technical indicators and advanced risk management. It’s built for high-stakes futures trading (e.g., MNQ, BTCUSDT.P), offering modular logic for scalpers and swing traders alike.
Key Features
Adaptive Moving Averages
Dynamic Logic: Fast and slow SMAs adjust lengths via ATR, reacting to momentum shifts and smoothing in calm markets.
Signals: Long entry on fast SMA crossing above slow SMA with price confirmation; short on cross below.
RSI Filtering (Optional)
Momentum Check: Confirms entries with RSI crossovers (e.g., above oversold for longs). Toggle on/off with custom levels.
Fine-Tuning: Adjustable lookback and thresholds (e.g., 60/40) for precision.
Candlestick Pattern Recognition
Eng|Enhanced Detection: Identifies strong bullish/bearish engulfing patterns, validated by volume and range strength (vs. 10-period SMA).
Conflict Avoidance: Skips trades if both patterns appear in the lookback window, reducing whipsaws.
Multi-Timeframe Trend Filter
15-Minute Alignment: Syncs intrabar trades with 15-minute SMA trends; optional for flexibility.
Dollar-Cost Averaging (DCA) New!
Scaling: Adds up to a set number of entries (e.g., 4) on pullbacks/rallies, spaced by ATR multiples.
Control: Caps exposure and resets on exit, enhancing trend-following potential.
Trade Execution & Risk Management
Entry Rules: Prioritizes moving averages or patterns (user choice), with volume, volatility, and time filters.
Stops & Trails:
Initial Stop: ATR-based (2–3.5x, volatility-adjusted).
Trailing Stop: Locks profits with configurable ATR offset and multiplier.
Discipline
Cooldown: Pauses post-exit (e.g., 0–5 minutes).
Min Hold: Ensures trades last a set number of bars (e.g., 2–10).
Visualization & Tools
Charts: Overlays MAs, stops, and signals; trend shaded in background.
Dashboard: Shows position, P&L, win rate, and more in real-time.
Debugging: Logs signal details for optimization.
Input Parameters
Parameter Purpose Suggested Use
Use RSI Filter - Toggle RSI confirmation *Disable 4 price-only
trading
RSI Length - RSI period (e.g., 14) *7–14 for sensitivity
RSI Overbought/Oversold - Adjust for market type *Set levels (e.g., 60/40)
Use Candlestick Patterns - Enables engulfing signals *Disable for MA focus
Pattern Lookback - Pattern window (e.g., 19) *10–20 bars for balance
Use 15m Trend Filter - Align with 15-min trend *Enable for trend trades
Fast/Slow MA Length - Base MA lengths (e.g., 9/19) *10–25 / 30–60 per
timeframe
Volatility Threshold - Filters volatile spikes *Max ATR/close (e.g., 1%)
Min Volume - Entry volume threshold *Avoid illiquid periods
(e.g., 10)
ATR Length - ATR period (e.g., 14) *Standard volatility
measure
Trailing Stop ATR Offset - Trail distance (e.g., 0.5) *0.5–1.5 for tightness
Trailing Stop ATR Multi - Trail multiplier (e.g., 1.0) *1–3 for trend room
Cooldown Minutes - Post-exit pause (e.g., 0–5) *Prevents overtrading
Min Bars to Hold - Min trade duration (e.g., 2) *5–10 for intraday
Trading Hours - Active window (e.g., 9–16) *Focus on key sessions
Use DCA - Toggle DCA *Enable for scaling
Max DCA Entries - Cap entries (e.g., 4) *Limit risk exposure
DCA ATR Multiplier Entry spacing (e.g., 1.0) *1–2 for wider gaps
Compliance
Realistic Testing: Fixed quantities, capital, and slippage for accurate backtests.
Transparency: All logic is user-visible and adjustable.
Risk Controls: Cooldowns, stops, and hold periods ensure stability.
Flexibility: Adapts to various futures and timeframes.
Summary
DAFE excels in volatile futures markets with adaptive logic, DCA scaling, and robust risk tools. Currently in prop account testing, it’s a powerful framework for precision trading.
Caution
DAFE is experimental, not a profit guarantee. Futures trading risks significant losses due to leverage. Backtest, simulate, and monitor actively before live use. All trading decisions are your responsibility.

Scalping 15min: EMA + MACD + RSI + ATR-based SL/TP📈 Strategy: 15-Minute Scalping — EMA + MACD + RSI + ATR-based SL/TP
This scalping strategy is designed for 15-minute charts and combines trend-following and momentum confirmation with dynamic stop loss and take profit levels based on volatility.
🔧 Indicators Used:
EMA 50 — identifies the main trend
MACD Histogram — confirms momentum direction
RSI (14) — filters overbought/oversold conditions
ATR (14) — dynamically sets SL and TP based on market volatility
📊 Entry Conditions:
Long Entry:
Price is above EMA 50
MACD histogram is positive
RSI is above 50 but below 70
Short Entry:
Price is below EMA 50
MACD histogram is negative
RSI is below 50 but above 30
🛑 Risk Management:
Stop Loss: 1×ATR (user-configurable)
Take Profit: 2×ATR (user-configurable)
These values can be adjusted in the script inputs depending on your risk/reward preference or market conditions.
⚠️ Notes:
Strategy is optimized for scalping fast-moving pairs (e.g. crypto, forex).
Works best in trending markets.
Use backtesting and forward testing before live trading.
