Dual Bollinger Band Mean ReversionSimple but solid mean reversion indicator with sl and tp levels. Most of the code is based on the built in bollinger bands script. Designed for scalping 1-5 minute timeframes.
The indicator consists of two sets of bollinger bands.
Price has to close below the lower (fast) bollinger band, above the moving average of the (slower) bollinger band.
If price now closes above the lower (fast) bb, the indicator draws a label at the open of the next candle (which would be a potential entry point). Take profit becomes the upper bollinger band, stop loss the same distance below the open of the candle.
I've built in a simple backtesting function that calculates the potential win/loss-ratio. Loss and profit levels are 1:1. Exit strategy could be improved on.
Adjusting the lengths depending on the asset proves to be a good idea.
The slower bollinger bands can help to identify ranging markets and/or trends following regular bollinger bands theory.
Feel free to comment with any changes that you'd like to be made.
Cerca negli script per "scalp"

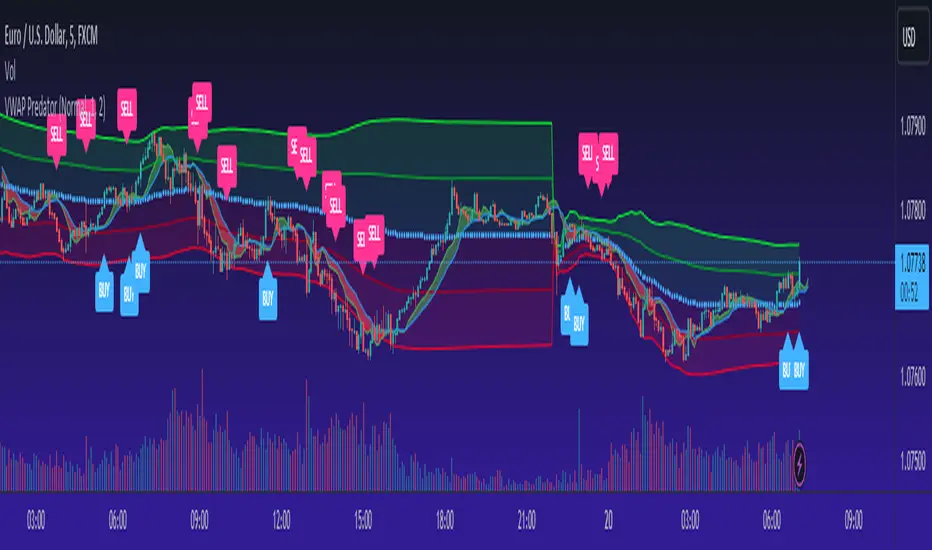
VWAP PredatorUsing VWAP as a start point, the VWAP Predator uses proprietary Fibonacci bands to help determine signal criteria. Most traders use VWAP in a simple way to determine whether an instrument is in a bearish or bullish state, but that doesn't help choosing the correct time to go long or short.
The xBat VWAP Predator uses behavioural analysis with volume, price action with open and close proximities to the Fibonacci bands/zones (Fib Zones). The following describes how the xBrat VWAP Predator is different to any standard use of Volume Weighted Average Price and uses xBrat Proprietary Behavioural logic to determine high probability long and Short signals. All of this heavy lifting and logic is done behind the scenes, keeping traders charts clean.
Long Trading Signals - Candle Coloured in Blue - There are many states with the logic to produce these signals, which are briefly described below:
1. The only standard criteria here - The price action must be above the VWAP Line
2. The Price must open below the boundary of one Fib Zone and close into the next Fib Zone
3. That Same Candle has to be an Accumulation Candle (more volume than the preceding candle and More Buyers) - This is determined with our proprietary logic coding
4. The Same signal candle also has to be higher than average volume. Again, our proprietary xBrat Logic just doesn't look back over a set number of bars, it looks at times of day and day of week, plus more to determine a true valuation of higher, lower or equal to average volume.
5. Only when these states are met, plus two more ema proximity logic, Does the xBrat VWAP predator give a Long Signal.
6. Trade Management is either set targets or indeed a simple ema cross which we provide as a ribbon on the chart to help traders. These ema's are different to entry logic. When the Ribbon turns from green to red, the trader should consider exiting the trade
Short Trading Signals - Candle Coloured in Pink - There are many states with the logic to produce these signals, which are briefly described below:
1. The only standard criteria here - The price action must be below the VWAP Line
2. The Price must open above the boundary of one Fib Zone and close into the next Fib Zone
3. That Same Candle has to be a Distribution Candle (more volume than the preceding candle and More Sellers) - This is determined with our proprietary logic coding
4. The Same signal candle also has to be higher than average volume. Again, our proprietary xBrat Logic just doesn't look back over a set number of bars, it looks at times of day and day of week, plus more to determine a true valuation of higher, lower or equal to average volume.
5. Only when these states are met, plus two more ema proximity logic, Does the xBrat VWAP predator give a Short Signal.
6. Trade Management is either set targets or indeed a simple ema cross which we provide as a ribbon on the chart to help traders. These ema's are different to entry logic. When the Ribbon turns from red to green, the trader should consider exiting the trade.
VWAP Predator is a day trading and scalping signals trading indicator.
EMA + Williams Fractal Pullback [Trading Nerd]EMA Pullback Strategy with Williams Fractal Indicator
Backtesting script that searches for trends (long and short) and a following pullback into the EMAs. It enters on the first Williams Fractal in the desired direction. I found the Strategy on YouTube as a "M1 Scalping Strategy for Bitcoin".
Including fees the strategy is not profitalbe in lower timeframes (at least if not optimized). But it seems to work on higher timeframes as a swing traiding strategy.
Strategy Conditions
Longs:
EMA 1 > EMA 2 and EMA 2 > EMA 3
Number of need to be above the EMA 1
Then a Pullback into the EMAs is required
Enter on the first bullish Williams Fractal
Signal is canceled if the price closes below the EMA 3
Shorts:
EMA 1 < EMA 2 and EMA 2 < EMA 3
Number of need to be below the EMA 1
Then a Pullback into the EMAs is required
Enter on the first bearish Williams Fractal
Singal is canceled if the price closes above the EMA 3
Take Profit
A Risk Reward Take Profit is possible. If you want to use only a trailing Stop Loss, you can set the Take Profit to 'None'
Stop Loss
The default Stop Loss is EMA. If the Pullback has not reached the EMA 2, the Stop Loss is set to the EMA 2. If the Pullback has reached the EMA 2, the Stop Loss is set to the EMA 3.
Other Stop Loss types are available: ATR, HH/LL
Trailing Stop Loss
Available trailing Stop Loss types: ATR, HH/LL. Best practice is to also set the Stop Loss type to the same value.
The Stop Loss is updated if the value from the latest closed candle is greater/less than the previous value for a long/short trade.
Additional
Time Filter: Only opens trade in the defined Session. Open trades are still being closed outside of the Session.
Start Date/End Date: Limits the backtest for the defined Date Range
Trading Days: Only open Trades on the checked Days
Risk % per Trade: If enabled the Strategy uses X% of the capital (defined in Settings -> Properties -> Initial Capital)
Use Compound Interest: If enabled Capital is recalculated for every trade (initial capital + net Profit)
IMPORTANT: For low Timeframes and Markets with tight SL (like Forex) it requires a lower Margin Percent than default. Go to Settings->Properties and lower the required Long/Short Margin. Otherwise Trades might not be considered because of too less capital/marign. Margins can e.g. set to: 2% (Forex), 10% (Stocks), 20% (Crypto).

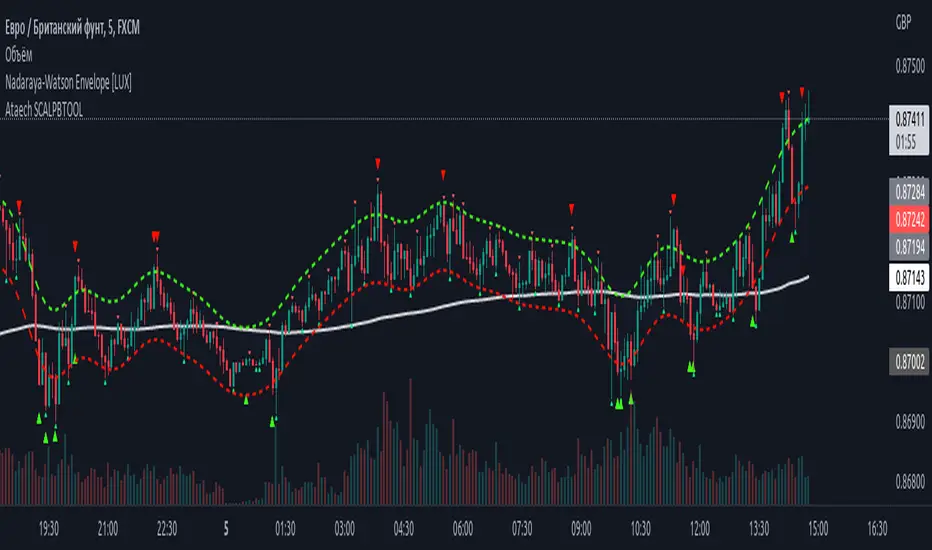
100400 Scalping PullBack Tool R1.1100400 Scalping PullBack Tool R1.1
The following tool smooths the price data using the Nadaraya-Watson estimator, a simple Kernel regression method. We make use of the Gaussian kernel as a weighting function.
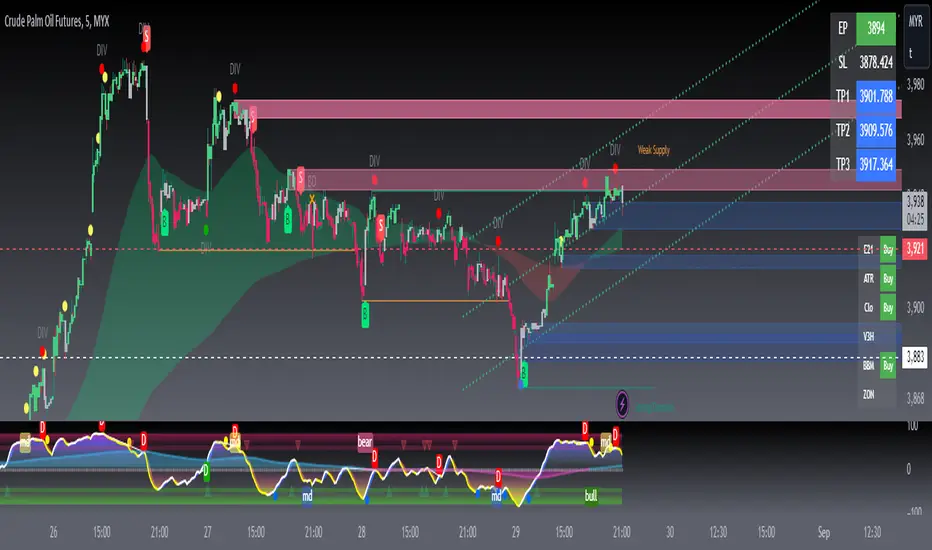
SUPER GCOV5 MAPSCALP > MAPPING & SCALPING SUPER GCOV5 MAPSCALP indicator is built specifically for mapping/prediction measurement and fast trading i.e. scalping/intraday in the commodity market or cryptos market. It uses an indicator instrument consisting of ATR TRAILING STOP (ATR), EXPONENTIAL MOVING AVERAGE, PIVOT POINT, FIBONACCI KEY LEVEL, and LINEAR REGRESSION CHANNEL(LRC).
Rebuild of Instrument & Parameter
This indicator is also an upgraded instrument that is sourced from the previous indicator-FUTURES SCALPV2.This R&D of course makes trading activities more effective, and dynamic to increase the confidence of traders in current trading activities. The indicator has been upgraded in terms of parameters as well as additional instruments. Among them are;
1. ATR Trailing Stop
2. ATR BUY/SELL signal
3. Exponential Moving Average(EMA) – fastMA/slowMA Length
5. Breakout/breakdown signal
6. Pivot low/high level
7. Fibonacci extends & retracement
8. Linear Regression Channel(LRC)
9. Alert condition ( a dozen alerts )
> The best timeframe for entry is 3 minutes for FCPO and 15 minutes for other futures & cryptos.
> The best timeframe mapping/prediction is 1 hour & 4 hours.
>The candle/bars have been colored to make it easier for traders to see the price trends whether in bullish or bearish conditions.
Easier SOP of ENTRIES/POSITIONING:
1. entry by signal BUY/SELL after signal bar ( 2nd bar) for confirmation.
2. The best entries BUY at support(pivot low-Blue line) after price rebound then signal appears. The best buy also when the price is at lower
low pivot + fibo support level + lower trendline(LRC) + and the price went rebound.
3. The best entries SELL at resistance(pivot high-red line) after price pullback then signal appears.
The best buy also when the price is at a higher high pivot + fibo resistance level + upper trendline LRC + and the price went pullback.
4. Profit-taking areas are usually measured by support and resistance levels. Please refer to the bold line( support & resistance), fibo key level,
and trendline.
*To avoid false signals/wrong positions, you can use the EMA line as a guide and follow the trends, which are the buying weight when the price is above the 20/50 ema, and the selling weight when the price is below the 20/50 ema. EMA can be reset on the input setting.
STEPS of MAPPING/PROJECTION:
1. Use a bigger timeframe such as 4 hours or 1 hour
2. Use LRC to identify buy/sell weights when the price makes a zig-zag patent
3. Use monthly and weekly fibo levels to know support and resistance. This fibo is very important to see if the price will make an extension or
retracement based on the regression channel earlier. So here we can evaluate which area to buy/sell/take-profit/exit and the reversal of a
market price.
You can also create an ALERT CONDITION to help you get a reminder of signals and price trend changes
The original instrument has been retained but changed in terms of display & facelift features.
Hopefully, the new one will assist you in making analysis and strategy of trading activities successfully.
THIS IS NOT A BUY/SELL CALL, ONLY STUDY IDEAS AND ANALYSIS BASED ON MEASUREMENT TOOLS FOR EDUCATION AND GUIDANCE PURPOSES.PLEASE TAKE AT YOUR OWN RISK.

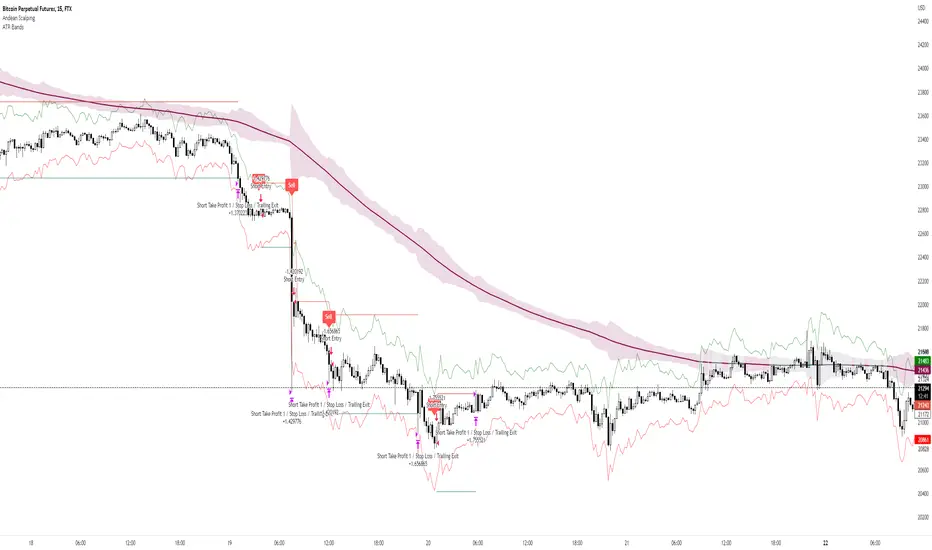
Andean ScalpingAndean Scalping Implementation - BETA
- Uses Andean Oscillator: alpaca.markets
- Implements a threshold moving average (SMA 1000) on the Andean Signal line at 1.1 factor to filter out small moves
- TP/SL using ATR bands at 3x multiplier
Impactful pattern and candles pattern AlertThe Alertion indicator!
impactful pattern:
pattern that happen near the zone or in the zone at lower timeframe and give us entry and stop limit price.
It is helpful for price action traders and those who want to decrease their risk.
There are 3 IP patterns:
Quasimodo
Head and shoulder
whipsaw engulfing
These patterns may occur near the zone or may not occur but by them, you can decrease your trading risk for example you can
trade with half lot before IP pattern and enter with other half after pattern.
how to use?
for example:
you find zone at 1h timeframe for short position
when price enter to your zone
you run this indicator and choose your lower timeframe, for example 15m and click on short position.
Then make the alert by right-click on your chart and choose the add alert and at condition box choose the impactful pattern and then click on create
now wait for message :)
Candles pattern:
like reversal bar, key reversal bar, exhaustion bar, pin bar, two-bar reversal, tree-bar reversal, inside bar, outside bar
these occur when the trend turn, so it is usable when the price enter to your zone or near your zone.
This pattern can decrease your risk.
Inside bar and outside bar:
if this pattern engulf up, it is bullish pattern and if engulf down, it is bearish pattern.
what does this indicator do?
this indicator is for making alert
it helps you to decrease your risk and failure.
You optimize it to alert you when IP pattern happen or candle pattern happen or inside bar or outside bar engulfing or all of them.
For IP pattern, it will message you entry and stop limit price.
It works at 2 different timeframes, so you can make alert for example in 1h TF for candles pattern and 15m TF for IP pattern.
Indicator will alert you for candles pattern at your chart timeframe and for IP pattern at timeframe you've chosen when you run the indicator, and it is changeable
in setting.
setting options
TIMEFRAME
IP: select the timeframe for IP patterns it means when IP pattern happen at that timeframe the indicator will alert you
example = your TF is 1h, you found the supply zone and want to trade, note that IP pattern happen in lower TF, so you select 15m TF or TF lower than 1h.
Short position: select it if you want to make short position.
BUFFERING
indicator send you entry and stop limit price
you can change it by amount of percent
it is your strategy to change your entry and stop loss or not
example= in head and shoulder pattern at short position, the stop limit is high price of head in pattern
so the indicator will message you the exact price but if you want to put
your stop limit 5 percent upper than exact price you can enter 5 in front of stop loss
or you want to enter 5 percent lower than exact high price of shoulder, you can optimize it.
ALERTION
you choose what alert you want
IP alert or candle alert or inside and outside bar alert
type your text for alert
you can write additional text for your message
ADVANCE
IP alert frequency option:
1. Once per bar : indicator will alert you for IP pattern once at your chat timeframe bar, and you should wait til next bar for next alert.
2. Once per bar close : alert you when your chart timeframe bar closed and next alert will happen when next bar is closed.
3. All: alert you all the times IP pattern happen
pivot left and right bars: lower will find smaller pattern
at the END:
this indicator is not strategy
it is part of your strategy that help you to increase your winning rate.
It is helpful for scalping and candle patterns finding.
After you make an alert, you can delete the indicator or change your timeframe or make another alert, your previous alert won’t change.
Thank you all.

TrapLightTrap Light is built off the stochastic RSI to provide convenience and make your entries while scalping either long/short more straightforward.
Notes/Disclaimer:
This indicator is not guaranteed to work every time. Use it at your own discretion and perform your own due diligence. None of this is financial advice.
The main idea behind this is that when the stochastic RSI reaches such extremes that it often moves in a favorable direction.
K = momentum or the blue line of the stochastic RSI indicator.
Perks:
Don't have to look away from candlesticks and measure stochastic RSI's K level.
Simple visual indication of what to do.
Don't have to stare at your chart all day waiting for things to get exciting.
How to Use:
(Above the current candlestick on any timeframe)
1. When K is greater than or equal to 99.5, it shows a sell signal. This is to indicate a short entry.
2. When K is less than or equal to 0.5, it shows a buy signal. This is to indicate a long entry.
3. If neither the conditions for a short/long entry are present, it shows a circle that is like a traffic light.
Red Light: When K is between 99.5 and 95, a red circle is shown to indicate that a short entry may be available soon.
Yellow Light: When K is between 95 and 5, a yellow circle is shown to indicate that neither a long nor short entry may be available soon.
Green Light: When K is between 5 and 0.5, a green circle is shown to indicate that a long entry may be available soon.
Alerts:
Set an alert on the ticker you trade to notify you when either the green or red light is present so that you have time to prepare to make an entry either long/short.
The Code:
The PineScript is open-source and annotated to explain different parts of the script for ease of understanding.
@Credit to Kingson1 for this strategy and his feedback on its creation/implementation.

Pips-Stepped PDFMA [Loxx]Pips-Stepped PDFMA is and Pips-stepped moving average that uses a probability density function moving average. This is tuned for Forex. You must adjust the step size to extreme levels for this to work for crypto or stocks. Try 30000 for BTC on the daily chart, for example.
What is Probability Density Function?
Probability density function based MA is a sort of weighted moving average that uses probability density function to calculate the weights.
Included:
Bar coloring
Alerts
Expanded source types
Signals
Flat-level coloring for scalping

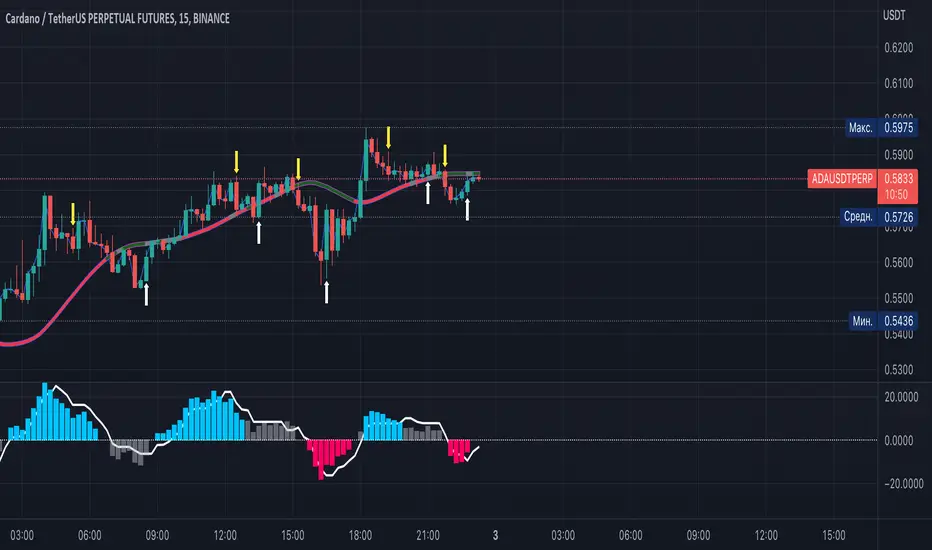
Fantastic Scalp Brainox.io Индикатор Fantastic Scalp Brainox.io проработан и затестирован для скальпинга.
Хорошо использовать в автоматической торговли на ботах
Показатель в месяц на торговле альтами достигает 5 - 28 процентов.
Стратегия:
Вход SHORT осуществляеся во в время выхода из зоны перекуплености (красная зона линия 1)
Для консервативной торговли ТP выставляется 0.25 % плече 10x
Вход LONG осуществляеся во в время выхода из зоны перепроданности (зеленая зона линия 0)
Для консервативной торговлиTP выставляется 0.4% плече 10x

Crypto_Troll_Turtle_StrategyTurtle Strategy for high marketcap cryptocurrencies
I'm glad to launch my strategy which is based on
moving averages / bollinger bands / RSI and volume
It's basically made for scalping with an interesting return over the last two years and a perspectively low drawdown
if you're interested in the strategy and you want to use it for futures trading you can contact me for a money & risk management rules that you can use and prevent you from a huge loss !! it's for free don't worry xD you can find my contact in the author's instructions' label
The optimal timeframe to use is 1H
I'll be trying to launch telegram signals for this strategy as soon as possible for the following pairs: BTCUSDT ETHUSDT BNBUSDT timeframe: 1H
I'm open to all reviews ! thanks !

Liquidity mapLocate institutional daily, weekly, and monthly liquidity intervention zones in an innovative format that allows you to fractalize the degree of trend reversal opportunity across multiple lengths!
Far from the traditional formats to tell you "where's the high/low", we display with this map the grab levels relating to the amplitudes of the measured period.
You can check "show old levels" to backtest these potential fractal reversal areas.
Use the levels that interest you according to your working UT (scalping, intraweek, swing, etc.), or take all the elements into consideration for your trading management :
Confluence the information to optimize your entry and shelter your stop loss under strong levels rejections !
Default parameters are: display high/low weekly & monthly, display liquidities levels in daily.

SP IndicatorSP Indicator - One of the best indicators for scalping trading on any timeframes. The best readings are given on 5, 15 and 30 minute frames.
For readings, several indicators are combined into one, which allows you to get a more accurate forecast, which is more than 90%.
Instruction.
The indicator is easy to use. Just install it and follow the arrows to go long or short. Stop loss set small, about 1-2%. In most cases, this is sufficient.
Good luck in bidding!
MY_SCALP strategyThe MY_SCALP strategy is designed to work with any instrument (cryptocurrency, stocks, forex).
The working timeframe for scalping is small from 1 to 15 minutes, and for trend trading from 30 minutes.
Signals are generated based on the price range (channel) within which the price of the instrument moves.
When the price of the channel breaks up, we expect an upward movement, and when it breaks down, we expect a downward movement.
To avoid manipulations in the market, the algorithm monitors the level of the price relative to the global trend and thus filters out a large part of the false signals.
In addition, in the settings it is possible to show additional inputs - these are the moments of rebound from the edge of the channel inwards, also with filtering applied.
-------------------------------------
💹 SETUP SETUP:
-------------------------------------
To adjust, you should change the value of the CHANNEL multiplier - this depends on the sensitivity and flexibility of the range.
For TF 5m it will be about 8-9, and for TF 1H about 4-5. That is, the higher the TF, the lower the value of the CHANNEL multiplier.
-------------------------------------
🟢 TAKE SETUP:
-------------------------------------
The strategy has 2 takes
You can choose the type of take - FIX or CHANNEL
FIX - fixed targets in %.
CHANNEL - channel takes (The width of the channel at the moment the signal appears is multiplied by the specified multiplier and thus the size of the take is calculated.).
Important: the 1st take cannot be more than the 2nd!
-------------------------------------
⛔️ STOP SETUP:
-------------------------------------
Stop type is also selectable:
FIX - fixed stop in %.
CHANNEL - channel stop (set % of the price for the offset from the opposite side of the trading channel. For additional entries, the stop uses the value of half the channel width + the specified offset from the position entry price).
You have the opportunity to activate the stop line tightening when the 1st tp1 take breakeven is reached.
-------------------------------------
💡 OTHER USEFUL FEATURES
-------------------------------------
✅ In the strategy, you can enable / disable the display of takes and stop lines.
✅ In the strategy, you can enable / disable the display of points of probable price rebounds.
✅ You can choose the direction of trading: long, short or any.
✅ You can choose the percentage of the position to close on the 1st take.
✅ It is possible to enable background highlighting of the current trend. This background does not stretch to the entire screen, but is limited to the calculated extremes, within which the asset price moves.
✅ The screen has a compact display of a table with the current strategy settings and the current state (position, takes, stop).
For the convenience of saving your settings, use the standard PrintScreen function.
✅ You can sign the strategy in the Notes field - this is convenient if you place several versions of the MY_SCALP strategy on the chart with different settings (for different pairs or for different timeframes).
✅ 👉 In the strategy settings, each field has hints , to do this, hover over the ⓘ sign
-------------------------------------
MY_SCALP strategy is closed! You can get test access to it for 48 hours.
👉 In order to gain access or ask questions, write to me in private messages or at the contacts indicated in my signature.
-------------------------------------
========================================================================================================
Стратегия MY_SCALP предназначена для работы с любым инструментом (криптовалюта, акции, форекс).
Рабочий таймфрейм для скальпинга - малый от 1 до 15 минут, а для трендовой торговли от 30 минут.
В основе формирования сигналов лежит ценовой рейндж (канал), внутри которого движется цена инструмента.
При пробитии ценой канала вверх, мы ожидаем восходящее движение, а при пробитии вниз - нисходящее.
Чтобы избежать манипуляций на рынке, алгоритм отслеживает уровень нахождения цены относительно глобального тренда и тем самым фильтрует немалую часть ложных сигналов.
Кроме этого в настройках есть возможность показать дополнительные входы - это моменты отскока от края канала внутрь, также с применением фильтрации.
-------------------------------------
💹 НАСТРОЙКА СЕТАПА:
-------------------------------------
Для настройки следует ищменять значение множителя канала CHANNEL - это этого зависит чувствительность и гибкость рейнджа.
Для ТФ 5м это будет примерно 8-9, а для ТФ 1Ч примерно 4-5. То есть, чем выше ТФ, тем ниже значение множителя CHANNEL.
-------------------------------------
🟢 НАСТРОЙКА ТЕЙКОВ:
-------------------------------------
Стратегия имеет 2 тейка
Тип тейка можно выбрать - FIX или CHANNEL
FIX - фиксированные тейки в %.
CHANNEL - канальные тейки (Ширина канала в момент появления сигнала умножается на заданный множитель и таким образом высчитывается размер тейка.).
Важно: 1-й тейк не может быть больше 2-го!
-------------------------------------
⛔️ НАСТРОЙКА СТОПА:
-------------------------------------
Тип стопа также выбирается:
FIX - фиксированный стоп в %.
CHANNEL - канальный стоп (задаётся % цены для отступа от противоположной стороны торгового канала. Для дополнительных входов стоп использует значение половины ширины канала + заданный отступ от цены входа в позицию).
У Вас есть возможность активировать подтяжку стоп-линии при достижении 1-го тейка tp1 в безубыток.
-------------------------------------
💡 ПРОЧИЕ ПОЛЕЗНЫЕ ФУНКЦИИ
-------------------------------------
✅ В стратегии можно включить/отключить отображение тейков и стоп-линии.
✅ В стратегии можно включить/отключить отображение точек вероятных отскоков цены.
✅ Можно выбрать направление торговли: лонг, шорт или любое.
✅ Можно выбрать процент позиции для закрытия на 1-м тейке.
✅ Есть возможность включения фоновой подкраски текущего тренда. Данный фон не растягивается на весь экран, а ограничивается расчётными экстремумами, в рамках которых двигается цена актива.
✅ На экране есть компактное отображение таблицы с текущими настройками стратегии и текущим состоянием (позиция, тейки, стоп).
Для удобства сохранения своих настроек - воспользуйтесь стандартной функцией PrintScreen.
✅ Вы можете подписать стратегию в поле Notes - это удобно, если Вы размещаете на графике несколько версий стратегии MY_SCALP с разными настройками (для разных пар или для разных ТФ).
✅ 👉 В настройках стратегии у каждого поля есть подсказки , для этого наведите курсор на знак ⓘ
-------------------------------------
Стратегия MY_SCALP является закрытой! Вы можете получить к ней тестовый доступ на 48 часов.
👉 Для того, чтобы получить доступ или задать вопросы пишите мне в личные сообщения или по контактам, указанным в моей подписи.
-------------------------------------

Bollinger Bands + EMA 9A 1 minute scalping strategy.
Uses Bollinger Bands (no basis line) and a 9 period EMA.
Waits for price to close below the lower Bollinger Band and the next candle to close bullish above the lower Bollinger Band but below the 9 Period EMA.
If all conditions are met, the script enters a long position with TP at the 9 Period EMA.
