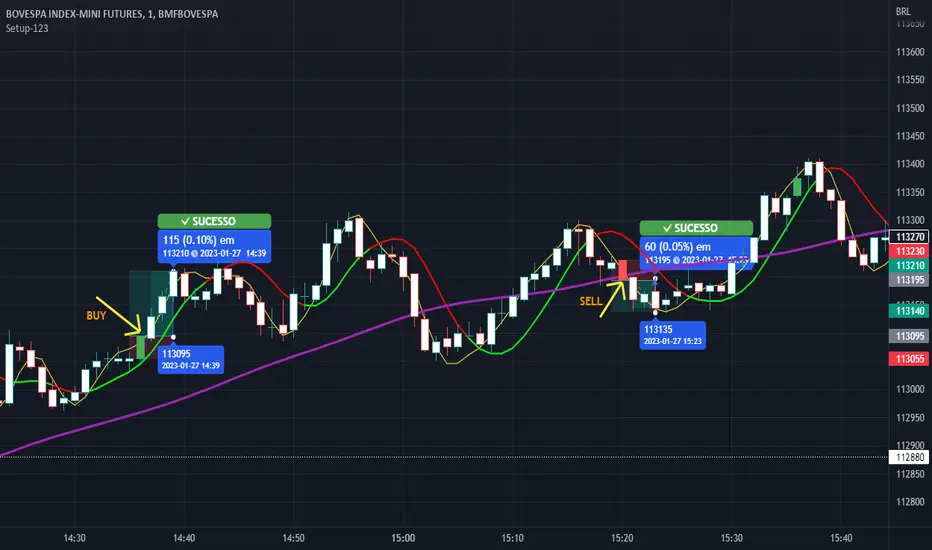
Setup 123 ScalperSetup 123 Scalper is characterized by a bottom (buy pattern formed by 3 candles where the 2nd has the lowest minimum) or a top (sell pattern formed by 3 candles where the 2nd has the highest maximum). It has a filter that only shows the signal when the asset is trending. Setup popularized by trader Alexandre Wolwacz (Stormer).
Na linguagem do autor:
O Setup 123 Scalper é caracterizado por um fundo (padrão de compra formado por 3 candles onde o 2º tem a menor mínima) ou um topo (padrão de venda formado por 3 candles onde o 2º tem a maior máxima). Possui um filtro em que só mostra o sinal quando o ativo está em tendência. Setup popularizado pelo trader Alexandre Wolwacz (Stormer).
Cerca negli script per "scalp"
BE - Volume Scalping ProDear Traders,
Here with presenting the new Indicator (Strategy) for scalping which is primarily built based on the the Volume Analysis.
Idea behind this Indicator: I am sure every trader would agree that Volume is one of the Leading indicator along with Price, and hence thought to use the same for scalping the trades. There is a direct co-relation between the price and volume and thereby used this as a base for arriving at strength of the volume pumped in. Indicator is working on the Logic of "What is the ROC in price for the volume dumped in and does ROC quantify the same which is happened in the recent past of x candles." In order to be successful in scalping trade, Accuracy, Risk to reward and Money Management is very much crucial and hence thought so much on this to make it happen.
Note: Accuracy here being profitable in the trade and not hitting the bulls eye all the time.
What this indicator is providing:
Based on the volume, ROC & Candle Thresholds and using the inputs provided for RISK and Money Management options, Indicator continuously scans for trading opportunities and provides alerts for possible trades.
Alerts & Notifications:
There are basically 3 types of Alerts provided one with General Notification and Other with Dhan HQ notifications to support Algo Trades and AlgoJi for supporting Algo trades too.
Self Declaration:
I have been testing the performance in 30 seconds and 1 min chart and I haven't faced any issues yet. I strongly recommend users to use the same in timeframe less than 10 Min only.
Enjoy!
DISCLAIMER: No sharing, copying, reselling, modifying, or any other forms of use are authorized for our documents, script / strategy, and the information published with them. This informational planning script / strategy is strictly for individual use and educational purposes only. This is not financial or investment advice. Investments are always made at your own risk and are based on your personal judgement. I am not responsible for any losses you may incur. Please invest wisely.
Happy to receive suggestions and feedback in order to improve the performance of the indicator better.

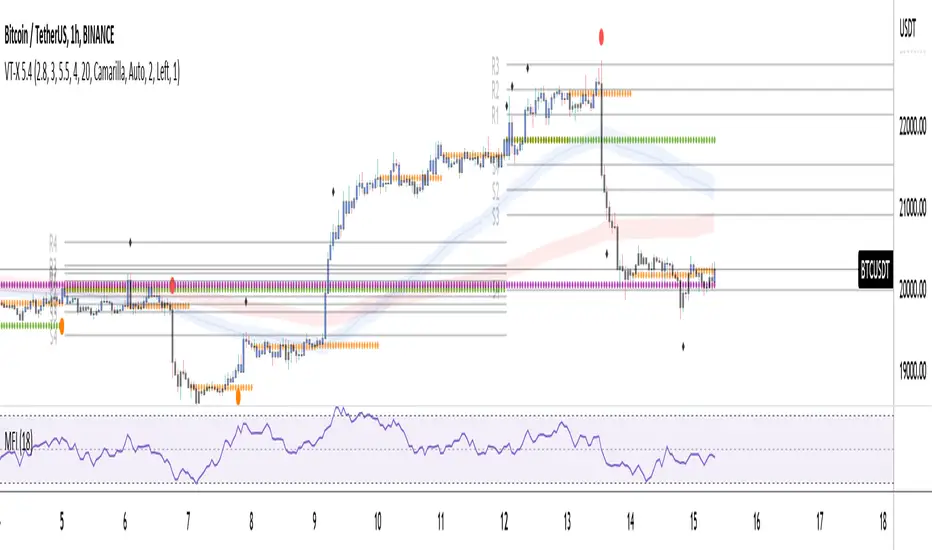
Volume and Trend reversal scalping scriptThe Vtrend X script allows for both trend based and scalping trading entries, it gives you all the trend and reversal information at hand that is necessary. It works best in a trending market.
The fundamental part of the script, is the volume weighted bands in blue and red, which help determine the trend and dynamic support and resistance . The blue band is a shorter length than the red band.
When the blue band dips below the red band, this tells us there is a downtrend. And when the blue band is trending above the red band, this is bullish uptrend price action. You will be able to note price whatever the timeframe really respects these bands, and you can use that to your advantage flicking through the high and low timeframes on where price will go next, combined with your own support and resistance levels.
Combined with the candle colors, which change whether they close above or below the main trend colored line (shown below), help identify a change in price action and trend. This allows for low timeframe plays also.
The uptrend and downtrend cicle signals are shown in a few different colors. Green and red are with the trend and have met all conditions. Orange and purple are against the trend calculations, and Olive circles risky trades against all the filters used to calculate signals.
The reversal signals, are the diamond plots in black, These also represent take profit areas as well.
Another key feature is the Daily / Weekly / Monthly and Yearly open levels displayed as colored dots. A lot of the plays i take use the Daily opens as key levels to take a trade off.
The indicator is designed to give you key information, but be quite customisable as well to suit your exact trading style.
Recommended timeframes i use for this script; Weekly (for key liquidity areas), Trading on the Daily, 6h, 4h, 2h, 1h and 25 minutes.
Backtested Settings and Pairs;
Pair - Timeframe - Signals Inputs - Reversal Inputs - ATR Multiplier - MA Filter
BTCUSD - 1 hr - 3 - 2.8 - 5.5 - NA
ETHUSD - 1 hr - 4 - 2.8 - 5.5 - NA
USDCAD - 1 hr - 4 - 2.8 - 5.5 - NA
GBPUSD - 1 hr - 4 - 2.8 - 5.5 - NA
US30 - 1 hr - 4 - 2.8 - 5.5 - NA
BTCUSD - 4 hr - 2.5 - 2.5 - 3.5 - NA
BTCUSD - 25 mins - 5 - 2.5 - 5.5 - NA
Holy Pro ScalperWhat is Holy Pro Scalper
This is an advanced Indicator comprising of 21 Fuzzy and Quantitative logics running at once, which takes care of a lot of things for a trader, such as:
1> The current Dominant Trend
2> A Good Entry Point
3> A Way to Recover
4> A point to Stop
5> A Method to Book and Trail Profits
The Logics Includes Likes of :
> DonchainChannels, Supertrend, Bollinger Bands, ATR, Volume, RSI, Stoch etc....
The main Aim of this Indicator is to help traders trade with Rules, and make money if they follow it correctly.
Because One of the most important learnings which I have learnt in my professional trading career is creating a solid trading rule, which takes care of you even if the market is against you!
Another Problem the indicator tries to Solve Is What Securities to Trade for Tomorrow, Traders can plan before day trading and make the strategy towards the instrument in an effective way by just following a few rules, which are Easy to learn!
So Getting into how to Use this Indicator, (U can read the text and see the Video, shared below )
The indicator Comprises of 3 Basic UI Parts
1> Trading Signal
2> Recovery Signal
3> Dominant Trend
Trading Signal
This is represented by a triangle (both buy and sell) in (blue and Orange Colors)
There are two types of trading signals
a> Normal Trading Signal
b> Requiring Confirmation Trading Signal (“c” on top/ below of the Candle where signal Came)
The way to trade them is, one can straight away trade a normal Trading Signal, on the High of the Candle,
A “Requiring Confirmation Trading Signal” must be traded on the high of the Closing candle above the respective Signal candle, that is a trader must wait for the confirmation candle closing above the high of the Requiring Confirmation Trading Signal Candle.
Recovery Signal
A Recovery signal is a sign of recovery the system presents to a trader, when he/she have taken position/ trade as per the trading signal,
A recovery Signal helps to identify the time when its good to look for a recovery at breakeven cost or profit, if the recovery is broken,
There are two types of Recovery in the System,
1> Green Recovery
Which should be considered as a recovery when a Short Trade is active, it shows the intent of the market to change direction, so a trader while in short trade if he sees a green recovery anytime after his order is filled, he may plan to recover, if the recovery candle is broken, so he can wait to recover at breakeven cost or plan for a stop or book profit if market permits
2> Red Recovery
Which should be considered as a recovery when a Long Trade is active, it shows the intent of the market to change direction, so a trader while in long trade if he sees a red recovery anytime after his order is filled, he may plan to recover, if the recovery candle is broken, so he can wait to recover at breakeven cost or plan for a stop or book profit if market permits
Stopping Point and Dominant Trend
So Dominant Trend of the market is represented by a trend Following Line and Area
So if Area on Trend Following Line is Red, market’s dominant trend is Bear
And if Area on Trend Following Line is Green, market’s dominant trend is Bull
If a trader is in Trade the dominant trend line is considered as a stopping point, if market closes below it, in Long position, one can straight away take a Stop and May reverse trade according to thought process
Provision For Alerts
All Trading Signals
Bull Trading Signals
Bear Trading Signals
Green Recovery Signals
Red Recovery Signals
Video Examples
What Instruments and Time Frames It Works
Works on Every Liquid Instrument and Standard Timeframe (1m to 1month)
How Can u Get Access
Only do Private Message to me, use Comment Box for Constructive Comments
What If you Want To learn the Trading Setups of Profitability
Only do Private Message to me, use Comment Box for Constructive Comments

Trade Central 2-Bars ScalperTrade Central 2-Bar Scalper is a scalping signal indicator based on short term price action using candlesticks. If 2 consecutive green candles form which are less than the max bar length defined in settings then indicator gives a buy signal. Similarly, if 2 consecutive red candles form then it gives a sell signal. It sounds very simple but it is a very powerful and popular scalping method. Along with the signal, you should pay attention to the candle formations, e.g. if there is a buy signal but you see a significant wick on top of signal candles then you may want to avoid that signal. Same for short.
Indicator shows bars in 3 colors - Green, Red and White. Signal candles, i.e. long and short, are green and red respectively. Rest of the candles are white and no action is needed when candles are white.
Trading using the script is simple - you enter a long trade on a green bar and enter a short trade on red bar. Detailed rules for trade execution are mentioned below.
Trading Rules
Recommended Timeframe: 3 minute
Go LONG after a green bar when signal candle high is broken. For example, on BTC chart if signal candle (green) high is 50000 then enter at least 3-5 points above it, i.e. 50003. If the signal candle high isn't broken then wait for that to happen, but signal/trade gets invalidated if the signal candle low is broken before signal candle high is broken .
Go SHORT after a red bar when signal candle low is broken. For example, on BTC chart if signal candle (red) low is 50000 then enter at least 3-5 points below it, i.e. 49997. If the signal candle low isn't broken then wait for that to happen, but signal/trade gets invalidated if the signal candle high is broken before signal candle low is broken .
For SL, we will use fixed profit and SL targets. For BTC, we recommend setting 100 points SL and 50 points target. That's a risk-to-reward of 1:0.5 which may look very bad, but the success rate of this strategy is very high (>70%) hence you would still be profitable. You can also try with 1:1 risk-to-reward ratio and that too should work fine though we haven't backtested it.
Default settings work best on 3 minute timeframe and has been tested on BTC. If you're applying the indicator on something else then ensure that you update the length as per security price you plan to trade. Will share backtested data and detailed explanation over a YouTube video.
Will strongly recommend paper trading in desired market/asset before executing live trades.

Full Forex scalper StrategyTHis is a FOREX scalping system that can be optimized with almost all majors and crosses pairs.
Its made of multiple elements such as :
MACD
Stochastic RSI
Fast VW moving average
Slow VW moving average
Time management( forex sessions as inputs)
Rules for entry
Long
Last 2 MACD values were ascending, fast moving average is below moving average and stochastic RSI is below 30 level. At the same time we are either into London or NY session.
Short
Last 2 MACD values were descending, fast moving average is above moving average and stochastic RSI is above 70 level. At the same time we are either into London or NY
Rules for exit
WE have 2 exit possibilities: we can exit either at the end of NY/London Session or based on a TP/SL risk management calculating % in movement.
If you have any questions let me know !

Forex scalper 2xEMA + SRSI + MACDThis is a forex scalping strategy designed for the most liquid pairs, like major forex pairs.
Its made of
1 EMA 50
1 EMA 100
Stochastic RSI
MACD
Rules
For long :close of the candle is above moving average 50, moving average 50> moving average 100, macd histogram is positive and cross over of stochastic rsi with the oversold level.
For short :close of the candle is below moving average 50, moving average 50 < moving average 100, macd histogram is negative and cross under of stochastic rsi with the overbought level.
Exit
For exit we have take profit and stop loss using fixed pip points.
For this example on EURUSD we use 20 pips for both tp and sl
IF you have any questions let me know !

Legacy Scalper - Trend Trading SystemLegacy Scalper Trend Trading System
Welcome to the Legacy Scalper
This indicator is based on a trend trading strategy using multiple EMA's, with an added colored algo to help traders enter orders while simultaneously reducing noise in the markets by changing candlesticks to one solid color dependant upon direction of price.
This indicator capitalizes on short term momentum while ensuring that you are trading with the trend using the commonly known fact of EMA's being above or below price to ensure the trend.
The customization and plotting of different length EMA's allows for freedom to design your own system within the realm of the indicators, or use the recommended strategies below.
////////
The Legacy Scalper plots 3 main EMA's listed as following:
-50 EMA
-200 EMA
-800 EMA
Additionaly there is an algo coded into the mix that allows for:
- Tradingview alarms for buys and sells
- change of period (frequency) for buys and sells
- color selection of the moving average
- change all candlestick color dependant upon buy and sell alerts.
////////
The Strategies (Or Create Your Own)
Basic
Sell only when you get an alert above the 50 EMA (Only 50 EMA plotted on screen)
Buy only when you get an alert with the 50 EMA below price (Only 50 EMA plotted on screen)
Sell Example:
Intermediate
Sell only when 50EMA is below the 200EMA and you get a sell alert
Buy only when the 50 EMA is above the 200EMA and you get a buy Alert
Buy Example:
Advanced
Sell only when you get a sell alert with all EMA's above price
Buy only when you get a buy alert with all EMA's below price
Example:
Legacy Mode
Backtesting is highly recommended
Remove EMA's and plot a high period MA and take alerts both ways to capitalize on longer moves
And/Or
Add Ema's for swing trading with a higher plot MA
Example:
NOTES:
This is designed to work on all time frames
This is designed to work on all financial instruments
Feel free to backtest which period setting is best, however visually glancing at most charts the default setting appears the best across all instruments.
Feel free to add in other indicators for additional confirmation such as an RSI, TDI, Stoch, or WAE
DISCLAIMER
THIS IS NOT FINANCIAL OR INVESTMENT ADVICE AND SHOULD NOT BE INTERPRETED AS SUCH.
Trading foreign exchange on margin carries a high level of risk, and may not be suitable for all investors. Past performance is not indicative of future results. The high degree of leverage can work against you as well as for you. Before deciding to invest in foreign exchange you should carefully consider your investment objectives, level of experience, and risk appetite. The possibility exists that you could sustain a loss of some or all of your initial investment and therefore you should not invest money that you cannot afford to lose. You should be aware of all the risks associated with foreign exchange trading, and seek advice from an independent financial advisor if you have any doubts.

William %R Scalper for GoldWilliam %R Scalper or WPR Scalper tool is used with small time frame : 5 , 3 or 1 minute, it uses two different William %R indicators : one for fast move with 9 period WPR9 and one slow with 54 period WPR54. You can find buy zone when WPR9 < -90 and WPR54 < -80 and sell zone when WPR9 > -10 AND WPR54 > -20. For experience user only you can adapt the two periods and threshold levels to your need. You can use only WPR9 to place trade and validate trend with WPR54.

NIFTY Money Flow - Scalping/SwingBrief Description About Script
It considers the change of price in the direction
change of price is +Ve then considered as +Ve money flow
-Ve then considered as -Ve money flow
and it multplied by Volume change
This Strategy works best with NIFTY
For Scalping:-
Settings:- 1 Min Candle Time Frame, Length 20
For Swing:-
Setting:- 30 Min Candle Time Frame, Length 11
How to use it?
Common usage:-
Buy - When turns Red to Green Buy by keeping 1.5 * ATR as SL or Trailing SL(Optional) at the same time frame
Sell - When turns Green to Red SL by keeping 1.5 * ATR as SL or Trailing SL(Optional) at the same time frame
Trend reversal:-
Draw Divergence between indicator and price
Buy - Indicator forms Higher Highs(Red Side), Price Lower Lows
Sell - Indicator forms Lower Lows(Green Side), Price Higher Highs
Breakouts:-(Less Accurate compared to other scenarios)
End of Triangel/Box Indicator Turns Red to Green - Bullish Breakout, Green to Red Bearish Breakout
can use for breakouts chart patterns and guess which side it's going to break
can use for reversal as well by observing divergence between price & indicator
Note:-
In the future, an updated version is coming with it auto-generated buy/sell signal on the chart & gives backtesting results as a strategy

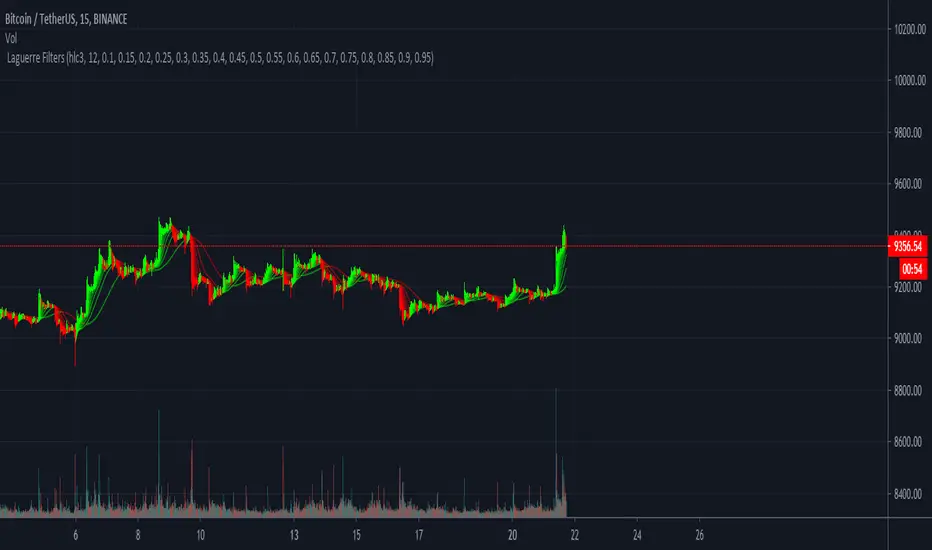
Laguerre Filters Crypto Scalping Tool This is an indicator designed to follow trends on the 15m/30m/1h Timeframe. It works best if you can recognise a larger trend into a direction and combining it then with for example longing the dip. Escpecially for crypto assets this can be used for scalping and if paired with S&R can be an especially powerful tool if paired correctly. Like it is shown here.
As soon as there is a flip to green for example with upwards momentum over the last period of time and no higher Timeframe Resistance ahead. On lower timeframes like the 15m and 30m this can be used for scalping and works especially well in Ranges, say for example a 100 Tick range. At the time of writing we heavily used this Indicator for scalping up and down the current bitcoin range and it worked suprisingly well.
One user was able to trade the EOSUSDT pump, chart shown here.
The cool thing is that the single filters can also be used as a Trailing Stop.
If interested please direct message us. Thank you !
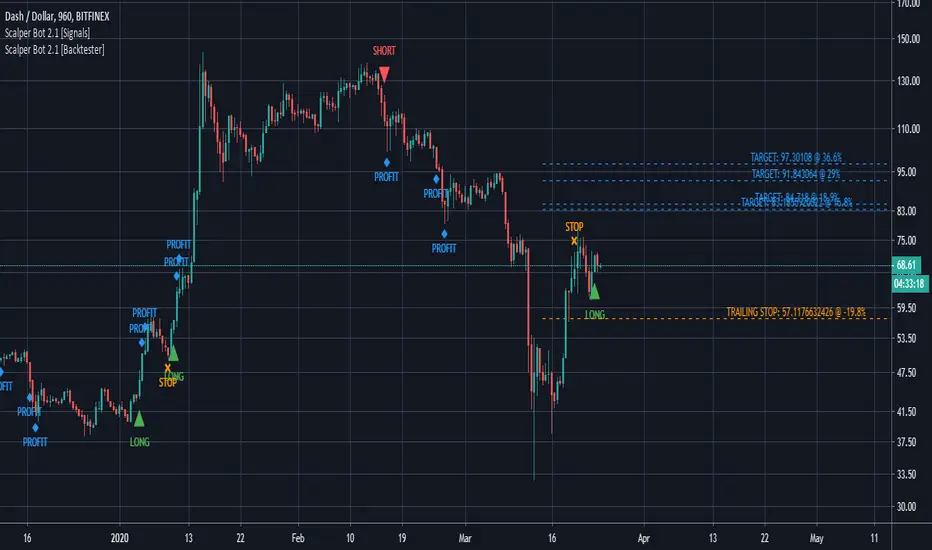
Scalper Bot [Signals]Scalper Bot is a scalping strategy, looking for market turning points between support and resistance pivots
Scalper Bot is developed for Crypto markets. It has not been tested on forex or any other markets, however it is not limited to Crypto markets.
It can also be used on any trading pair, on any exchange and in any time frame.
Scalper Bot comes complete with 3 alerts:
- LONG: LONG indicates that the market could potentially go up
- SHORT: SHORT indicates that the market could potentially go down
- CLOSE: CLOSE is a trailing stop loss and indicates that the market is no longer moving in the anticipated direction and that the current position should be closed. The same CLOSE signal is used for both LONG and SHORT
When setting up alerts, LONG and SHORT alerts should be set up to give an alert on ONCE PER BAR CLOSE, whereas the CLOSE alert should be set to ONCE PER BAR
Scalper Bot is a margin trading script, and caution should be exercised when using margin trading
Commission in the backtester is set to 0% as each exchange and each trading pair has its own commission structure. Be sure to change this value for backtesting purposes to the required commission.
---INVITE-ONLY SCRIPT---
This is an invite-only script, if you would like to try out this bot, send me a message
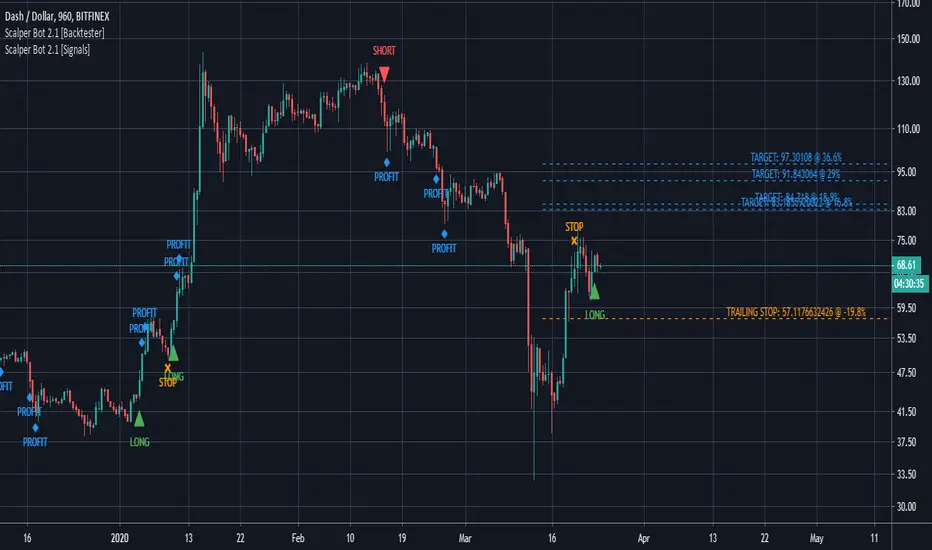
Scalper Bot [Backtester]Scalper Bot is a scalping strategy, looking for market turning points between support and resistance pivots
Scalper Bot is developed for Crypto markets. It has not been tested on forex or any other markets, however it is not limited to Crypto markets.
It can also be used on any trading pair, on any exchange and in any time frame.
Scalper Bot comes complete with 3 alerts:
- LONG: LONG indicates that the market could potentially go up
- SHORT: SHORT indicates that the market could potentially go down
- CLOSE: CLOSE is a trailing stop loss and indicates that the market is no longer moving in the anticipated direction and that the current position should be closed. The same CLOSE signal is used for both LONG and SHORT
When setting up alerts, LONG and SHORT alerts should be set up to give an alert on ONCE PER BAR CLOSE, whereas the CLOSE alert should be set to ONCE PER BAR
Scalper Bot is a margin trading script, and caution should be exercised when using margin trading
Commission in the backtester is set to 0% as each exchange and each trading pair has its own commission structure. Be sure to change this value for backtesting purposes to the required commission.
---INVITE-ONLY SCRIPT---
This is an invite-only script, if you would like to try out this bot, send me a message
FX Scalping Indicators (Revised)This is an edit from: 1 minute 'Forex Scalping Strategy'
Added realistic Stop/Loss + Take Profit
Now works fluently with 1-15 Minute charts.
Adjusted EMA lengths
Tested on other majors and provides the same if not better results. (:
I'll be using this upon open and will update with live results.

Crypto Reversal Scalper DEMO / FREE BacktesterCrypto Reversal Scalper Lite
This is a lite version of:
This script allows anyone to try out the capability of the script with restrictions to some features. If you want to unlock all the features, consider upgrading.
Full version also includes alerts for automated trading.

Breakout Scalper (Session)This is a twist on my on my Breakout Scalper strategy that limits trading to a user-configurable session
Find the original "Continuous" version of the scalper here:
The breakout scalper is based on "slow" and "fast" donchian periods. In this version, the "slow" donchian is in fact the Day's high/low. This important difference means that we will always be entering our trades at the day's high or low, so you are exposed to the price making new highs/lows but not to oscillations within the day's range.
Furthermore, the scalper is modified to only enter trades after the start of the user-configured session. Any open trades are closed at the end of the user-configured session. The default session is set to 10:00 AM to 3:30 PM because that's when I like to trade.


Predicta Futures – Scalping Predictor with Confidence FilterPredicta Futures is an advanced short-term forecasting indicator that combines historical pattern similarity analysis with weighted technical signals to predict price movements 1–10 minutes ahead.
**Core Functionality**
The script scans up to 5,000 historical bars to identify structurally similar price patterns. It aggregates forward outcomes from matched patterns and integrates real-time signals from RSI, MACD, Bollinger Bands, volume momentum, and volatility. A composite confidence score filters signals, displaying only those meeting the user-defined threshold (default ≥68%).
**Key Outputs**
- Buy/sell triangles with text labels
- Dashed projection line to predicted price
- Dotted target and ATR-based stop lines
- Info panel showing forecast direction, confidence %, expected move %, pattern count, order book status, and data access details
**Customization & Performance**
- Execution modes: Fast, Balanced, Accurate
- Adaptive sampling with recency bias option
- Filters for volatility and market hours
- Adjustable weights, lookback period, and prediction horizon
**Use Cases**
Scalping, intraday trading, futures, cryptocurrencies, equities.
*Order book metrics are simulated (platform limitation). Technical analysis tool; not financial advice.*

Scalp BTC/ETH — Reversal & Continuation (v1, Pine v6)Scalp BTC/ETH — Reversal & Continuation (1m à 10m)
Cet indicateur détecte des opportunités de micro-scalping sur futures (BTC/ETH) basées sur deux mécaniques courtes validées par structure de prix :
A) Reversal de pression (contre-mouvement contrôlé)
Détection d’une sur-extension brutale suivie d’une absorption sur la bougie suivante.
Objectif : capturer la première respiration après un excès de prix (rejet court).
B) Continuation courte (momentum + reprise)
Détection de 3 bougies directionnelles consécutives suivies d’un pullback léger, puis signal sur la reprise du mouvement initial.
Gestion intégrée (scénario standard TP dynamique)
TP1 → 50% de la position à un gain fixe (% adaptable au timeframe)
Stop déplacé au Break-Even sur le restant
Sortie finale sur bougie inverse significative
(correction ≥ X% du corps précédent) ou timeout (max bars en trade)
Scalp BTC/ETH — Reversal & Continuation (1m to 10m)
This indicator detects short-term futures scalping setups on BTC & ETH using two mechanical price-action models designed for fast execution:
A) Reversal Compression (counter-move entry)
Identifies a sharp impulse (overextension) followed by absorption / failure to extend on the next candle.
Objective: capture the first corrective pullback after exhaustion.
B) Controlled Continuation (momentum follow-through)
Identifies 3 consecutive trend candles, then a shallow pullback, and triggers an entry on the resumption of the main leg.
Built-in trade logic (dynamic TP structure)
TP1 → scale out 50% of the position at a fixed percentage (auto-scaled per timeframe)
Stop moved to Break-Even after TP1
Final exit on either:
• a meaningful opposite candle (≥ X% correction of prior body), or
• a timeout (max bars in trade)
Technical characteristics
Designed for 1m / 3m / 5m / 7m / 10m
No repainting (bar-close confirmed logic)
Works for both LONG & SHORT
Built-in alert events:
ENTRY_LONG / ENTRY_SHORT / TP1 / EXIT_STOP / EXIT_INVERSE / EXIT_TIMEOUT
Suitable for manual execution, semi-automation (alerts) or full bot integration (webhook JSON)
Purpose
Provide a repeatable, rule-based, non-subjective framework to harvest micro-moves with controlled risk, without relying on lagging indicators or long-term prediction.
(A Strategy / backtesting version is planned as a next iteration.)

PulseGrid Universal Scalper - Adaptive Pulse and Symmetric SpansInstrument agnostic. Works on any symbol and timeframe supported by TradingView.
Message or hit me up in chat for full access .
Purpose and scope
PulseGrid is a short timeframe strategy designed to read intrabar structure and recent path so that entries align with actionable momentum and context. The strategy is private. The description below provides all the information needed to understand how it behaves, how it sizes risk, how to tune it responsibly, and how to evaluate results without making unrealistic claims. The design is instrument agnostic. It runs on any asset class that prints open high low close bars on TradingView. That includes commodities such as Gold and WTI, currencies, crypto, equity indices, and single stocks. Performance will always depend on the symbol’s liquidity, spread, slippage, and session structure, which is why the description focuses on principles and safe parameter ranges instead of hard promises.
What the strategy does at a glance
It builds a composite entry signal named Pulse from five normalized bar features that reflect short term pressure and follow through.
It applies regime guards that keep the strategy inactive when the tape is either too quiet, too bursty, or too directionally random.
It optionally uses a directional filter where a fast and a slow exponential average must agree and their gap must be material relative to recent true range.
When a signal is allowed, risk is sized using symmetric spans that come from nearby untraded price distances above and below the market. The strategy sets a single stop and a single take profit from those spans.
Lines for entry, stop, and take profit are drawn on the chart. A compact on chart table shows trade counts, win rate, average R per trade, and profit factor for all trades, longs only, and shorts only.
This combination yields entries that are reactive but not chaotic, and risk lines that respect the market’s recent path instead of generic pip or point targets.
Why the design is original and useful
The core originality is the union of a composite entry that adapts to volatility and a geometry based risk model. The entry uses five different viewpoints on the same bar space instead of relying on a single technical indicator. The risk model uses spans that come from actual untraded distance rather than fixed multipliers of a generic volatility measure. The result is a framework that is simple to read on a chart and simple to evaluate, yet it avoids the traps of curve fitting to one symbol or one month of data. Because everything is normalized locally, the same logic translates across asset classes with only modest tuning.
The Pulse composite in detail
Pulse is a weighted blend of the following normalized features.
Impulse imbalance. The script sums upward and downward impulses over a short window. An upward impulse is the extension of highs relative to the prior bar. A downward impulse is the extension of lows relative to the prior bar. The net imbalance, scaled by the local range, captures whether extension pressure is building or fading.
Wick and close location. Inside each bar, the distance between the close and the extremes carries information about rejection or acceptance. A bar that closes near the high with relatively heavier lower wick suggests upward acceptance. A bar that closes near the low with heavier upper wick suggests downward acceptance. A weight controls the contribution of wick skew versus close location so that users can favor reversal or momentum behaviour.
Shock touches. Within the recent range window, touches that occur very near the top decile or bottom decile are marked. A short sliding window counts recent shocks. Frequent top shocks in a rising context suggest supply tests. Frequent bottom shocks in a declining context suggest demand tests. The count is normalized by window length.
Breakout ledger. The script compares current extremes to lagged extremes and keeps a simple count of recent upside and downside breakouts. The difference behaves as a short term polarity meter.
Curvature. A simple second difference in closing price acts as a curvature term. It is normalized by the recent maximum of absolute one bar returns so that the value remains bounded and comparable to other terms.
Pulse is smoothed over a fraction of the main signal length. Smoothing removes impulse spikes without destroying the quick reaction that scalpers need. The absolute value of smoothed Pulse can be used with an adaptive gate so that only the top percentile of energy for the recent environment is eligible for entries. A small floor prevents accidental entries during very quiet periods.
Regime guards that keep the strategy selective
Three guards must all pass before any entry can occur.
Auction Balance Factor. This is the proportion of closes that land inside a mid band of the prior bar’s high to low range. High values indicate balanced chop where breakouts tend to fail. Low values indicate directional conditions. The strategy requires ABF to sit below a user chosen maximum.
Dispersion via a Gini style measure on absolute returns. Very low dispersion means bars are small and uniform. Very high dispersion means a few outsized bars dominate and slippage risk can be elevated. The strategy allows the user to require the dispersion measure to remain inside a band that reflects healthy activity.
Binary entropy of direction. Over the core window, the proportion of up closes is used to compute a simple entropy. Values near one indicate coin flip behaviour. Values near zero indicate one sided sequences. The guard requires entropy below a ceiling so that random directionality does not produce noise entries.
An optional directional filter asks that a fast and a slow exponential average agree on direction and that their gap, when divided by an average true range, exceed a threshold. This filter can be enabled on symbols that trend cleanly and disabled when the composite entry is already selective enough.
Risk sizing with symmetric spans
Instead of fixed points or a pure ATR multiplier, the strategy sizes stops and targets from a pair of spans. The upward span reflects recent untraded distance above the market. The downward span reflects recent untraded distance below the market. Each span is floored by a fallback that comes from the maximum of a short simple range average and a standard average true range. A tick based floor prevents microscopic stops on instruments with high tick precision. An asymmetry cap prevents one span from becoming many times larger than the other. For long entries the stop is a multiple of the downward span and the target is a multiple of the upward span. For short entries the stop is a multiple of the upward span and the target is a multiple of the downward span. This creates a risk box that is symmetric by construction yet adaptive to recent voids and gaps.
Execution, ties, and housekeeping
Entries evaluate at bar close. Exits are tested from the next bar forward. If both stop and target are hit within the same bar, the outcome can be resolved in a consistent way that favors the stop or the target according to a single user setting. A short cooldown in bars prevents flip flops. Users can restrict entries to specific sessions such as London and New York. The chart renders entry, stop, and target lines for each trade so that every action is visible. The table in the top right shows trade counts, take profit and stop counts, win rate, average R per trade, and profit factor for the whole set and by direction.
Defaults and responsible backtesting
The default properties in the script use a realistic initial capital and commission value. Users should also set slippage in the strategy properties to reflect their broker and symbol. Small timeframe trading is sensitive to friction and the strategy description does not claim immunity to that reality. The strategy is intended to be tested on a dataset that produces a meaningful sample of trades. A sample in the range of a hundred trades or more is preferred because variance in short samples can be large. On thin symbols or periods with little regular trading, users should either change timeframe, change sessions, or use more selective thresholds so that the sample contains only liquid scenarios.
Universal usage across markets
The strategy is universal by design. It will run and produce lines on any open high low close series on TradingView. The composite entry is made of normalized parts. The regime guards use proportions and bounded measures. The spans use untraded distance and range floors measured in the local price scale. This allows the same logic to function on a currency pair, a commodity, an index future, a stock, or a crypto pair. What changes is calibration.
A safe approach for universal use is as follows.
Start with the default signal length and wick weight.
If the chart prints many weak signals, enable the directional filter and raise the normalized gap threshold slightly.
If the chart is too quiet, lower the adaptive percentile or, with adaptive off, lower the fixed pulse threshold by a small amount.
If stops are too tight in quiet regimes, raise the fallback span multiplier or raise the minimum tick floor in ticks.
If you observe long one sided days, lower the maximum entropy slightly so that entries only occur when directionality is genuine rather than alternating.
Because the logic is bounded and local, these simple steps carry over across symbols. That is why the strategy can be used literally on any asset that you can load on a TradingView chart. The code does not depend on a specific tick size or a specific exchange calendar. It will still remain true that symbols with higher spread or fewer regular trading hours demand stricter thresholds and larger floors.
Suggested parameter ranges for common cases
These ranges are guidelines for one to five minute bars. They are not promises of performance. They reflect the balance between having enough signals to learn from and keeping noise controlled.
Signal length between 18 and 34 for liquid commodities and large capitalization equities.
Wick weight between 0.30 and 0.50 depending on whether you want reversal recognition or close momentum.
Adaptive gate percentile between 85 and 93 when adaptive is enabled. Fixed threshold between 0.10 and 0.18 when adaptive is disabled. Use a non zero floor so very quiet periods still require some energy.
Auction Balance Factor maximum near 0.70 for symbols with clear session bursts. Slightly higher if you prefer to include more balanced prints.
Dispersion band with a lower bound near 0.18 and an upper bound near 0.68 for most session instruments. Tighten the band if you want to skip very bursty days or very flat days.
Entropy maximum near 0.90 so coin flip phases are filtered. Lower the ceiling slightly if the symbol whipsaws frequently.
Stop multiplier near one and take profit multiplier between two and three for a single target approach. Larger target multipliers reduce hit rate and lengthen holding time.
These are safe starting points across commodities, currencies, indices, equities, and crypto. From there, small increments are preferred over dramatic changes.
How to evaluate responsibly
A clean chart and a direct test process help avoid confusion. Use standard candles for signals and exits. If you use a non standard chart type such as Heikin Ashi or Renko, do so only for visualization and not for the strategy’s signal computation, as those chart types can produce unrealistic fills. Turn off other indicators on the published chart unless they are needed to demonstrate a specific property of this strategy. When you post results or discuss outcomes, include the symbol, timeframe, commission and slippage settings, and the session settings used. This makes the context clear and avoids misleading readers.
When you look at results, consider the following.
The distribution of R per trade. A positive average R with a moderate profit factor suggests that exits are sized appropriately for the symbol.
The balance between long and short sides. The HUD table separates the two so you can see if one side carries the edge for that symbol.
The sensitivity to the tie preference. If many bars hit both stop and take profit, the market is chopping inside the risk box and you may need larger floors or stricter regime guards.
The session effect. Session hours matter for many instruments. Align your session filter with where liquidity and volatility concentrate.
Known limitations and honest warnings
PulseGrid is not a guarantee of future profit. It is a systematic way to read short term structure and to size risk in a way that reflects recent path. It assumes that the data feed reflects the exchange reality. It assumes that slippage and spread are non zero and uses explicit commission and user provided slippage to approximate that. It does not place multiple targets. It does not trail stops. It is not a high frequency system and does not attempt to model queue priority or microsecond fills. On illiquid symbols or very short timeframes outside regular hours, signals will be less reliable. Users are responsible for choosing realistic settings and for evaluating whether the symbol’s conditions are suitable.
First use checklist
Load the symbol and timeframe you care about.
If the instrument has clear sessions, turn on the session filter and select realistic London and New York hours or other sessions relevant to the instrument.
Set commission and slippage in the strategy properties to values that match your broker or exchange.
Run the strategy with defaults. Look at the HUD summary and the lines.
Decide whether to enable the directional filter. If you see frequent reversals around the entry line, enable it and raise the normalized gap threshold slightly.
Adjust the adaptive gate. If the chart floods, raise the percentile. If the chart starves, lower it or use a slightly lower fixed threshold.
Adjust the fallback span multiplier and tick floor so that stops are never microscopic.
Review per session performance. If one session underperforms, restrict entries to the better one.
This simple process takes minutes and transfers to any other symbol.
Why this script is private
The source remains private so that the underlying method and its implementation details are not copied or republished. The description here is complete and self contained so that users can understand the purpose, originality, usage, and limitations without needing to inspect the source. Privacy does not change the strategy’s on chart behavior. It only protects the specific coding details.
Guarantee and compliance statements
This description does not contain advertising, solicitations, links, or contact information. It does not make performance promises. It explains how the script is original and how it works. It also warns about limitations and the need for realistic assumptions. The strategy is not investment advice and is not created only for qualified investors. It can be tested and used for educational and research purposes. Users should read TradingView’s documentation on script properties and backtesting. Users should avoid non standard chart types for signal computation because those produce unrealistic results. Users should select realistic account sizes and friction settings. Users should not post claims without showing the settings used.
Closing summary
PulseGrid is a compact framework for short timeframe trading that combines a composite entry built from multiple normalized bar features with a symmetric span model for risk. The entry adapts to volatility. The regime guards keep the strategy inactive when the tape is either too quiet or too erratic. The risk geometry respects recent untraded spans instead of arbitrary distances. The entire design is instrument agnostic. It will run on any symbol that TradingView supports and it will behave consistently across asset classes with modest tuning. Use it with a clean chart, realistic friction, and enough trades to make your evaluation meaningful. Use sessions if the instrument concentrates activity in specific hours. Adjust one control at a time and prefer small increments. The goal is not to find a magic parameter. The goal is to maintain a stable rule set that reads market structure in a way you can trust and audit.

Moon Scalper v3 + VSAMoon Scalper v3 is a high-precision scalping indicator optimized for the 15-minute chart. It delivers clean buy/sell signals with TP1 (1:1 risk-reward) exits using layered confirmations:
• **Volatility Bands** — SMA + multiplier detect expansion zones
• **EMA Filter (200)** — ensures trades align with trend
• **RSI Range Filter** — avoids extreme overbought/oversold traps (buy: 52–62, sell: 38–48)
• **Volume Spike Filter** — filters for institutional activity (vol > 1.4×SMA)
• **VSA Confirmation** — requires wide-spread, high-volume bars with reclaim (volume × 1.4, spread × 1.5, reclaim 50%)
**Usage Notes:**
Best used on 15m timeframe for liquid pairs (e.g., BTCUSDT, ETHUSDT). Signals appear as “BUY” / “SELL” labels on chart. Defaults yield high TP1 hit rate; use only during active sessions (e.g., London/NY) for best accuracy.
**Disclaimer:**
This indicator is for educational purposes only. Past performance is not a guarantee of future results. Always backtest before live trading and manage risk responsibly.

Scalper SMA-RSI-MACD – Entry/Exit Signals v2Scalper SMA–RSI–MACD Strategy (Intraday) – Indicator Version
This is an intraday scalping and short-term trading tool designed for manual trading. It provides entry and exit signals based on a combination of trend, momentum, and volatility-based risk management.
Core Components
Trend Filter (Optional)
Uses an EMA (default 200) and an SMA ribbon (5/8/13) to identify the primary trend direction.
Only allows long trades in uptrend and short trades in downtrend (can be turned off for more signals).
Entry Conditions
RSI Pullback: Detects oversold (for long) or overbought (for short) conditions based on a short RSI (default length = 4).
MACD Momentum Turn: Detects bullish or bearish MACD crossovers or momentum shifts.
Both conditions must occur within a specified lookback period (default = last 3 bars).
Stop Loss (SL) Placement
SL is placed at a fixed multiple of the ATR (Average True Range) from the entry price (default = 1.5 × ATR).
Adjusting the multiplier changes how far the SL is placed.
Take Profit (TP) Levels
Two targets: TP1 and TP2, each based on R-multiples of the SL distance.
Default: TP1 = 1 × risk (1:1 R/R), TP2 = 2 × risk (1:2 R/R).
Exit Modes (Selectable)
TP1 or SL
TP2 or SL
Opposite signal (exit when the opposite entry condition appears)
Session Filter (Optional)
Can restrict trading signals to specific market hours (default off for more signals).
Signals and Alerts
Displays LONG and SHORT arrows for entries.
Plots SL and TP levels on the chart.
Marks exits as TP, SL, or opposite signal.
Built-in alertcondition() allows creating TradingView alerts for all entry and exit events.
Typical Usage
Works best on 1-minute to 5-minute charts for scalping; can be adapted to higher timeframes for swing trading.
Ideal for manual execution — the trader sees the signal, checks market conditions, and decides whether to enter.
Can be tuned for more or fewer signals by adjusting RSI thresholds, MACD lookback, and trend filter settings.
