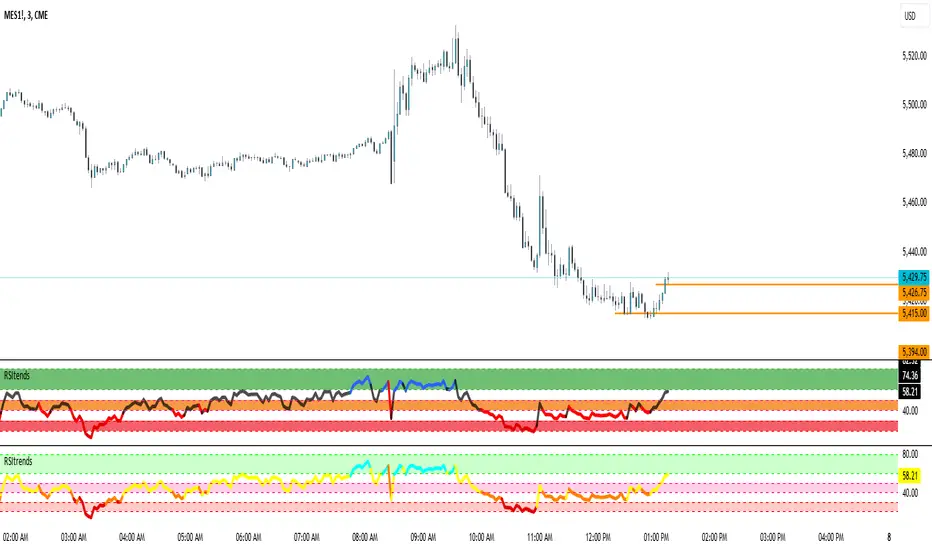
RSItrendsThis is to my friends and to my sons to use.
What Is the Relative Strength Index (RSI)?
The relative strength index (RSI) is a momentum indicator used in technical analysis. RSI measures the speed and magnitude of a security's recent price changes to evaluate overvalued or undervalued conditions in the price of that security.
The RSI is displayed as an oscillator (a line graph) on a scale of zero to 100. The indicator was developed by J. Welles Wilder Jr. and introduced in his seminal 1978 book, New Concepts in Technical Trading Systems.
1
The RSI can do more than point to overbought and oversold securities. It can also indicate securities that may be primed for a trend reversal or corrective pullback in price. It can signal when to buy and sell. Traditionally, an RSI reading of 70 or above indicates an overbought situation. A reading of 30 or below indicates an oversold condition.
Cerca negli script per "stoch"
12&50 RSI + %R2/50 RSI+ %R is a PineScript indicator that combines two popular technical indicators, the Relative Strength Index (RSI) and the Williams %R. The indicator plots two lines, K and D, which represent the smoothed moving averages of the RSI. It also plots the RSI with a 60-period length and the Williams %R with a 21-period length. The indicator can be used to identify overbought and oversold conditions, as well as potential reversals.
Here are some of the key features of the script:
It uses two different RSI lengths to provide a more comprehensive view of the market.
It plots the Williams %R, which can be used to identify overbought and oversold conditions.
It includes overbought and oversold levels to help traders identify potential entry and exit points.

RSI Candle ColorI manually made a 100 point gradient for this one. Its just smooth sensitive rsi but it colors your candles based on the level of the rsi. I hope you find this useful even as a utility for the gradient.

07srsiStochastic RSI for 7 Minute
+1 = Stochastic RSI Close >= 90
-1 = Stochastic RSI Close <= 10
Used in conjunction with 15rsi to Trigger Entries. If 15srsi and 07srsi both = +1 (Enter Short Trade). If 15srsi and 07srsi both = -1 (Enter Long Trade).
Should be Ran on 7 Minute Chart

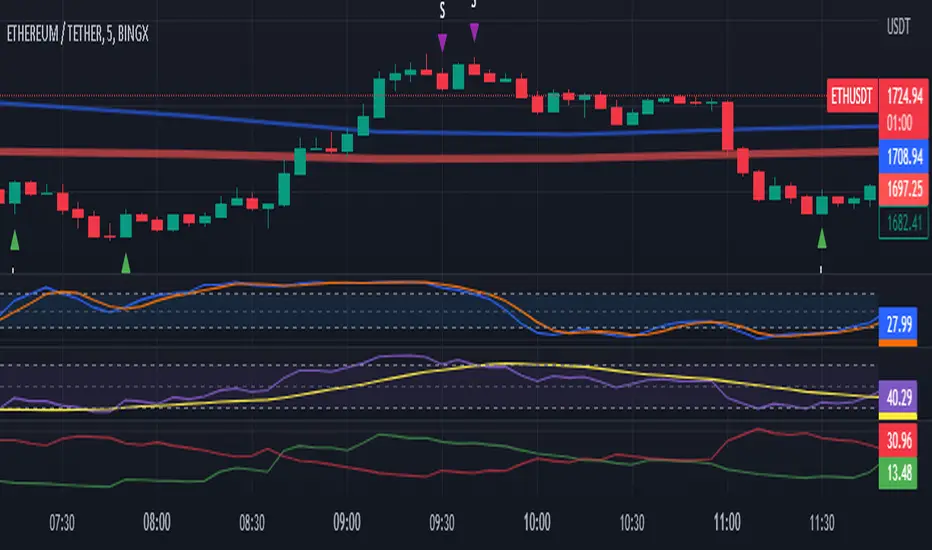
2 EMA PullbackHi everyone!
CAUTION... This is only an indicator. Do not rely 100% on it.
I made this indicator hoping to help everyone with this specific Pull Back Scalping Strategy.
RULES:
Time Chart of 5minuts
Long Condition - "EMA Red Line" below the "EMA Blue Line" and wait for a green long signal.
Short Condition - "EMA Red Line" below the "EMA Blue Line" and wait for a red short signal
Feel free to add any adjustments or give feedback so we can improve.
The strategy idea and guidelines came from the "Master Juan Luis"
Autor: © Germangroa
SAR+RSI+EMAs SignalsNOTE:
Indicator based strategies may expire and begin to work again. There are various ways to check the expiration of these strategies but I suggest equity curve trading (EC trading) as the best one.
Please check every single indicator based strategy to see if it’s still profitable or it has been expired to avoid losses.
Principles:
I personally believe every profitable indicator-based setup need 3 factors. Actually I analyze indicator-based set up in this way!
1- Trend detector: a tool that detect the “trend”.
2- Oscillators (Discount finder): a tool that detects “discounts” in the direction of the trend.
3- Stimulus: A tool that indicates the Initiation of a movement.
There may be profitable strategies that do not use all three, because other factors are strong enough to lead us to profit, but they are rare and sometimes they hide the other forgotten factor in the main two ones.
Elements:
(Since most of traders here, are familiar with these famous indicators I will not take your time to write about their uses and formula)
SAR: As a Trend detector, regarding position of close and SAR
EMA 7 and EMA 21: As trend detectors, regarding position of EMA 7 as fast “moving average” and EMA 21 as slow one. Also we need another confirmation for trend regarding EMA 7 and closing price of the signal candle.
RSI: In this strategy RSI is used both as a discount finder and a stimulus.
For RSI being over/under 50, regarding the trend, a possible discount may have been occurred. Imagine these conditions: close>EMA7, EMA7>EMA21, close>SAR and simultaneously RSI being under 50 is really a sign of powerful uptrend which it’s RSI decreasing might be a sign of corrective move, which will be following a bullish impulsive move.
The other use of RSI is to stimulate a buy signal by “crossing” over 50 or 30 (50 as balanced point of momentum and 30 as a sign of ending an oversold) or stimulate a sell signal by “crossing” under 50 or 70 (50 as balanced point of momentum and 70 as a sign of ending an overbought).
Entry point: you can use one of the followings.
1- Open of the next candle
2- EMA 7
3- Open of the signal candle
(Totally optional but “open of the next candle” is suggested by me.)
SL: Use one of the followings.
1- SAR or some pips (regarding ATR Or your experience of this trading instrument’s fluctuations in this time frame) below the SAR
2- Fixed amount (regarding ATR Or your experience of this trading instrument’s fluctuations in this time frame)
3- Use EMA21 as dynamic SL (if a candle far enough from the initiative candle close over (for sell) below ( for buy)
Again number 1 is suggested by me.
TP: Use one of the followings.
1- Use static levels or zones of support and resistance as TP.
2- Use dynamic levels for instance band of BB or moving averages (Moving the SL is possible).
3- Use fixed R to R
And I believe static zones of support and resistance work better.
Examples:
I indicate a buy signal on the chart!
Using local level as TP worked just good.
Using EMA was better in this case.
And using a riskier level or a fixed R to R is obvious in the chart!
Since in the range markets, this strategy may not work well and at the same time, TP to SL might be too small to be worth the risk, I prefer to use levels to filter range market conditions!
I convert all those circumstances to a simple buy and sell signs on the chart!
EMA21 and SAR are still visible because it is possible that traders use them for their TP and SL.
This is how it look without EMA21 and SAR!
Another screenshot of this strategy!
I also add a check box to filter signals by another trend detector. MATD created by me to help traders detect trend!
As it’s visible, some profitable signals filtered too, but using a longer-term trend detector as an additional one, alongside the double EMAs is very useful for this strategy.
The other box “use high&low instead of close for fast EMA” makes the “EMA7 and close” trend detector an easygoing one!
Almost everything is editable here!
*** I did not invent this strategy, you can find it for free on net ***
I'll change it to a "strategy" instead of an indicator if reader like to!

Oversold / OverboughtMy first script. Based on RSI , CCI , RVI, and MFI . You can customize overbought or oversold thresholds for any indicator.
If you have any ideas - welcome.
Disclaimer
This is not financial advice. Trade on your own risk.

Stochastic_Impulse_%k ver0Stochastic Oscillator combined with a Rate of Change Indicator. Current period - previous period Stochastic . The Stochastic has no smoothing and is the Rate of Change of %k value only.

MS COT Commercial OscillatorStochastics indicator on the COT commercials net positions. It looks for the actual level of this value inbetween the extreme values of the lookback period. A value above 80 oder 90 percent is interpreted as a bulllish extreme, a value below 20 or 10 percent is interpreted accordingly a bearish. In fact the absolute level of the commercials net positions should be considered as well. The default value for the lookback period is 26 weeks. Higher values reduce the number of signals but increase their quality.
This script actually was inspired by someone but I forgot by whom :-) ... my apology!

StochRSI-MTF ErionisMultiframe StochRSI. Useful to identify change in momentum inside a channel/consolidation patterns.


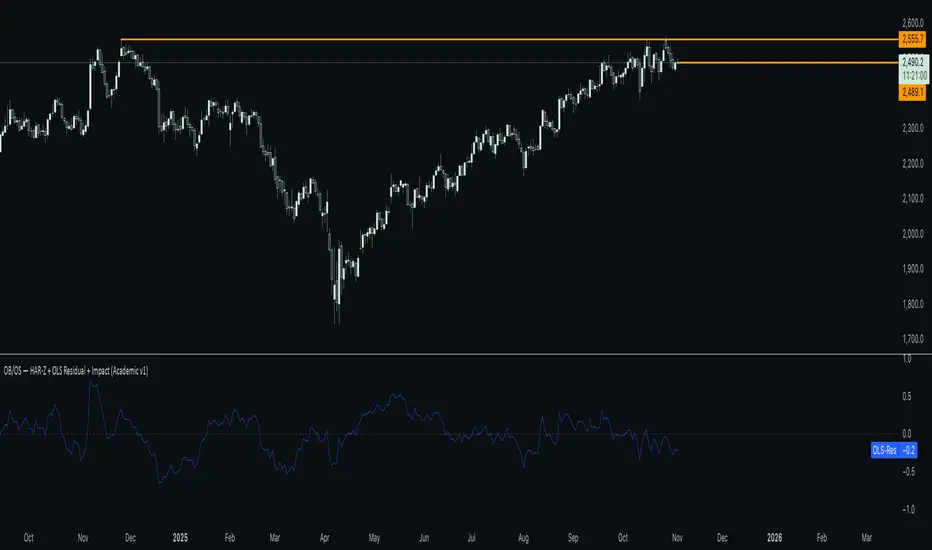
HAR-Z + OLS Residual + Impact stochastic indicators ibeqfpb wepgbwep gbipwbgw wqbgiwgbw ghbdns ,eltjv jjdhbnb p nj,j. xjve , yfv
ZS Master Vision Pro - Advanced Multi-Timeframe Trading SystemZS MASTER VISION PRO - PROFESSIONAL TRADING SUITE
Created by Zakaria Safri
A comprehensive, all-in-one trading system combining multiple proven technical analysis methods into a single, powerful indicator. Designed for traders who demand precision, clarity, and actionable signals across all timeframes.
KEY FEATURES
CORE TREND ALGORITHM
Adaptive ATR-based trend detection with dynamic support and resistance zones. Features Type A and Type B signal modes for different trading styles, strong signal detection in key reversal zones, and optional EMA source smoothing for noise reduction.
MULTI-LAYER EMA CLOUD SYSTEM
Five customizable EMA cloud layers for multi-timeframe analysis with theme-adaptive color coding across five professional themes. Optional line display for detailed MA tracking with configurable periods from scalping to position trading.
WAVE TREND OSCILLATOR
Advanced momentum oscillator with channel-based calculations featuring smart reversal detection at extreme overbought and oversold levels. Includes directional strength confirmation and customizable sensitivity with adjustable reaction periods.
DIVERGENCE SCANNER
Detects four types of divergence automatically:
- Regular Bullish: Price making lower lows while oscillator making higher lows
- Regular Bearish: Price making higher highs while oscillator making lower highs
- Hidden Bullish: Trend continuation signals in uptrends
- Hidden Bearish: Trend continuation signals in downtrends
Automatic fractal-based detection with clear visual labels on chart.
MARKET BIAS INDICATOR
Heikin Ashi-based trend strength analysis with real-time bias calculation showing Bullish or Bearish combined with Strong or Weak conditions. Smoothed for cleaner signals and perfect for trend confirmation.
MOMENTUM SYSTEM
Proprietary momentum calculation using adaptive smoothing with growing and falling state detection. Normalized values for consistent interpretation and responsive to rapid market changes.
DYNAMIC SUPPORT AND RESISTANCE
Automatic pivot-based support and resistance level detection with adjustable left and right bar lookback. Non-repainting levels with visual clarity through color-coded lines.
LIVE INFORMATION DASHBOARD
Real-time market analysis panel displaying current trend direction, market bias based on Heikin Ashi, Wave Trend status and value, and momentum trend with state. Customizable display options with theme-adaptive colors.
VISUAL CUSTOMIZATION
FIVE PROFESSIONAL COLOR THEMES:
Pro - Modern green and red color scheme (default)
Classic - Traditional teal and red combination
Cyberpunk - Neon cyan and magenta contrast
Ocean - Blue and orange contrast
Sunset - Gold and red warmth
SIGNAL STYLES:
Labels with emoji indicators (BUY with rocket, SELL with bear, STRONG with lightning)
Arrows for clean minimal appearance
Triangles for classic approach
DISPLAY OPTIONS:
Color-coded candles following trend direction
Trend background highlighting for instant trend recognition
Optional EMA line display for detailed analysis
Adjustable transparency levels for personal preference
SMART ALERTS
Pre-configured alert conditions for all major signals:
Buy signals for standard entry opportunities
Sell signals for standard exit or short opportunities
Strong buy signals for high-confidence long entries
Strong sell signals for high-confidence short entries
Bullish divergence detection alerts
Bearish divergence detection alerts
Alert messages automatically include ticker symbol, current price, and specific signal type for quick decision making.
HOW TO USE
FOR TREND TRADERS:
Enable EMA Clouds with focus on Cloud 5 featuring 50 and 200 period moving averages. Wait for trend background color change to confirm direction. Enter on STRONG signals aligned with higher timeframe trend direction. Use support and resistance levels for strategic exits.
FOR SWING TRADERS:
Enable Wave Trend Oscillator information display. Look for oversold and overbought reversal setups. Confirm potential reversals with divergence scanner. Enter on smart reversal signals with proper risk management.
FOR SCALPERS:
Use Type B signal mode for more frequent trading signals. Enable Cloud 1 with 5 and 13 periods for quick trend confirmation. Focus on momentum growing and falling states for entry timing. Take quick entries on regular buy and sell signals.
FOR POSITION TRADERS:
Use Type A mode with higher ATR multiplier set to 3.0 or above. Enable only Cloud 5 with 50 and 200 periods for major trend confirmation. Only take STRONG signals for highest probability setups. Hold positions through minor pullbacks and noise.
RECOMMENDED SETTINGS
STOCKS ON DAILY TIMEFRAME:
Trend Period: 180
ATR Period: 155
ATR Multiplier: 2.1
Signal Mode: Type A
FOREX ON HOURLY AND 4-HOUR TIMEFRAMES:
Trend Period: 150
ATR Period: 120
ATR Multiplier: 2.5
Signal Mode: Type A
CRYPTOCURRENCY ON 15-MINUTE AND 1-HOUR TIMEFRAMES:
Trend Period: 100
ATR Period: 80
ATR Multiplier: 3.0
Signal Mode: Type B
SCALPING ON 1-MINUTE AND 5-MINUTE TIMEFRAMES:
Trend Period: 50
ATR Period: 40
ATR Multiplier: 2.0
Signal Mode: Type B
WHAT IS INCLUDED
Trend Analysis using ATR-based adaptive algorithm
Five EMA Cloud Layers for multi-timeframe confluence
Wave Trend Oscillator for momentum and reversal detection
Divergence Scanner detecting four types of divergence
Market Bias using Heikin Ashi-based trend strength
Momentum System with advanced momentum tracking
Support and Resistance Levels with automatic pivot detection
Live Dashboard showing real-time market analysis
Smart Alerts featuring six pre-configured alert types
Five Color Themes offering professional visual options
TECHNICAL DETAILS
CALCULATION METHODS:
Average True Range (ATR) for volatility adaptation
Exponential Moving Average (EMA) and Simple Moving Average (SMA) for trend smoothing
Wave Trend channel oscillator for momentum analysis
Fractal-based divergence detection algorithm
Heikin Ashi transformation for bias calculation
Logarithmic momentum calculation for precision
PERFORMANCE CHARACTERISTICS:
Optimized for maximum speed and efficiency
No repainting signals ensuring reliability
Works on all timeframes from 1 minute to monthly
Compatible with all instruments including stocks, forex, crypto, and futures
RISK DISCLAIMER
This indicator is a technical analysis tool and should not be used as the sole basis for trading decisions. Always use proper risk management and never risk more than you can afford to lose. Combine with other analysis methods and practice on demo accounts first. Past performance does not guarantee future results. Trading carries substantial risk and is not suitable for all investors.
SUPPORT AND UPDATES
Regular updates and continuous improvements
Based on proven technical analysis principles
Developed following Pine Coders best practices and standards
Clean, well-documented, and optimized code structure
WHY CHOOSE ZS MASTER VISION PRO
All-in-one solution eliminating the need for multiple indicators
Highly customizable to adapt to your specific trading style
Professional grade analysis with institutional-quality standards
Clean interface that is not cluttered or confusing
Works everywhere across all markets and all timeframes
Smart signals filtered for quality over quantity
Beautiful design featuring five professional color themes
Active development with regular improvements and updates
Transform your trading with ZS Master Vision Pro today.
Version 2.0 | Created by Zakaria Safri | Pine Script Version 5

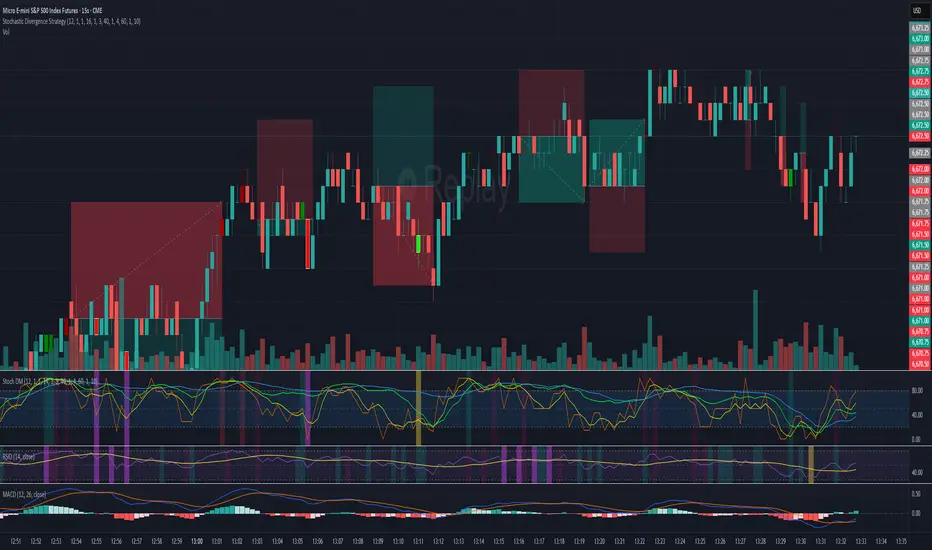
Stochastic Divergence Indicatorshows bullish and bearish divergence with green and red candles. white border for double dip

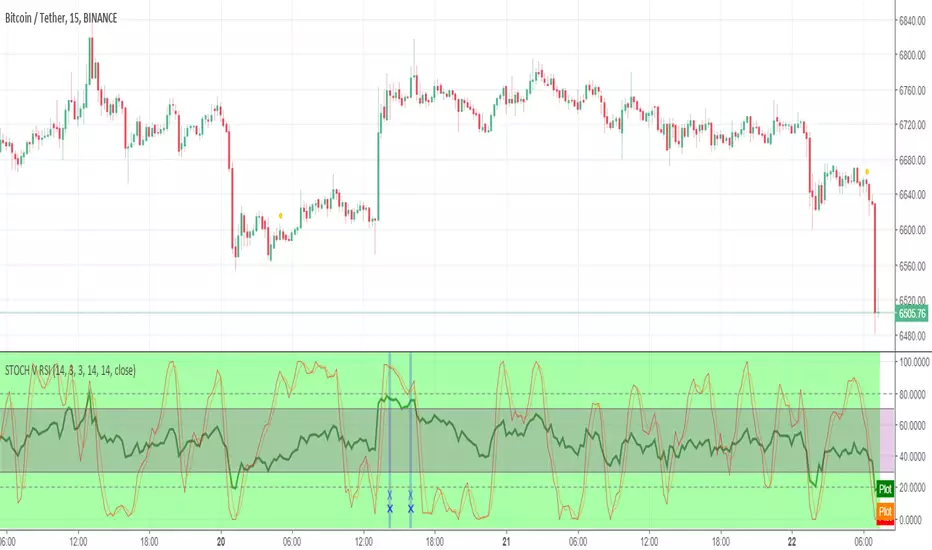
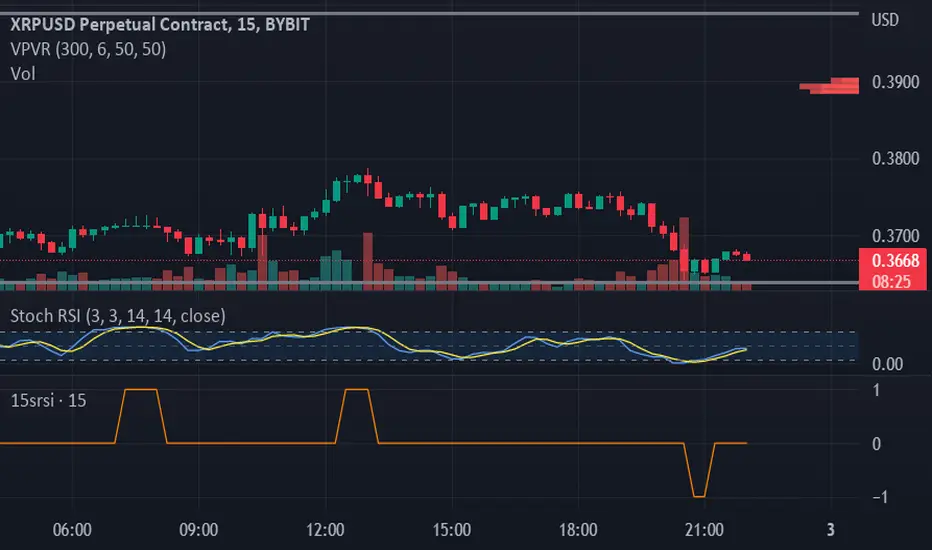
15srsiStochastic RSI - 15 Minute
+1 Requires 2 Consecutive Closes with RSI >= 90
-1 Requires 2 Consecutive Closes with RSI >= 10
Used in Conjunction with 07srsi to Trigger Entries
Stochastic [SystemAlpha]most powerfull scrip osilator
khaknjijr
sa;djjsa
asddasdas
saf
lkkljloioioijoihjh

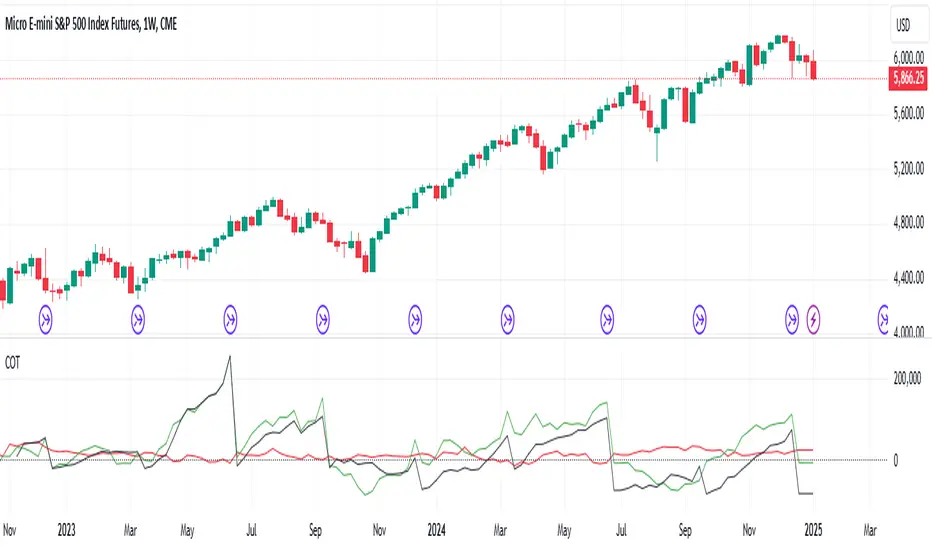
CoT data with OpenInterestDisplays COT data based on the "Disaggregated Commitments of Traders" report for Futures of the CFTC.
It does make accesible the following symbols:
ZB
ZN
ZS
ZM
ZL
ZC
ZW
KE
HE
LE
GC
SI
HG
CL
HO
RB
NG
6A
6B
6C
6E
6J
6S
SB
KC
CC
CT
ES
RTY
YM
NQ
PA
PL
AUP
HRC
EH
BB
ZR
ZO
DC
OJ
LBS
GF
SP
DJIA
6N
6L
VX
6M
6R
6Z
ZT
ZF
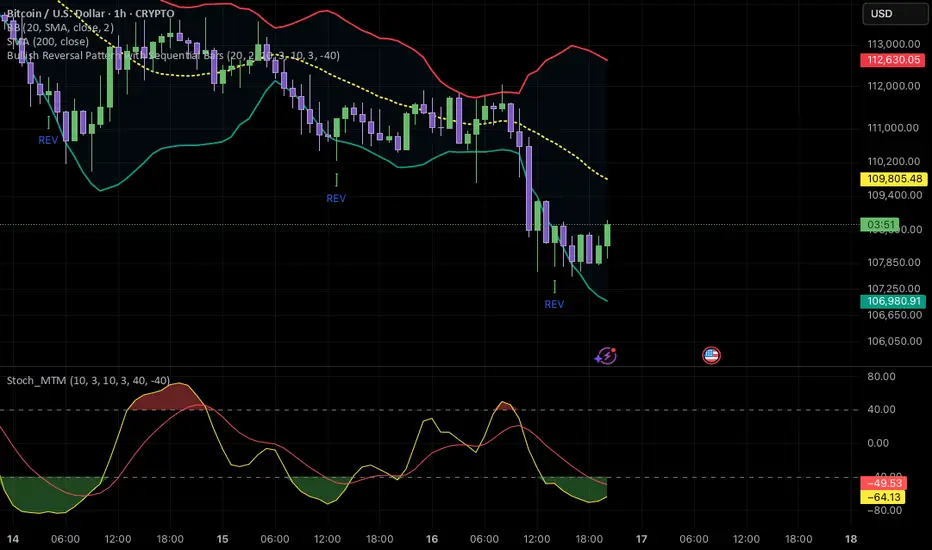
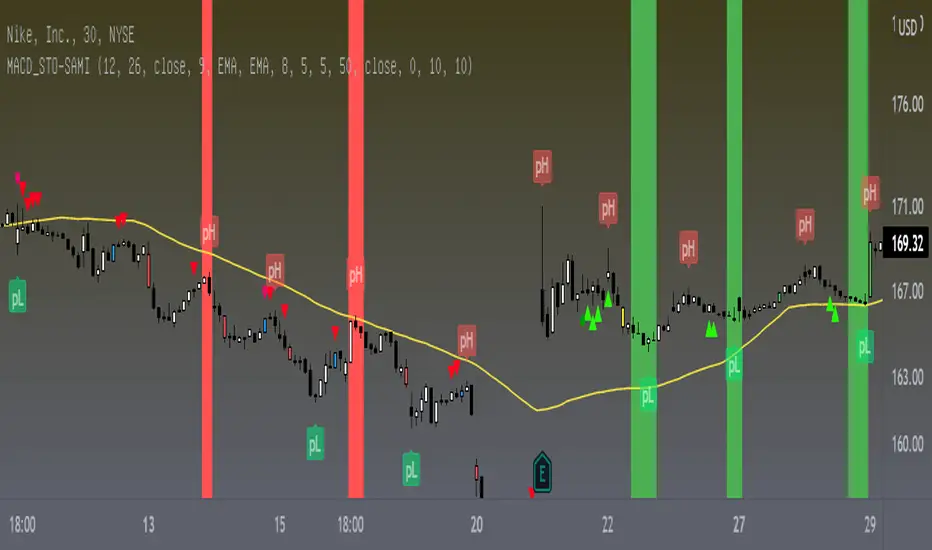
MACD_STO-SAMI
This indicator depends on the trend. You must first determine the general trend and then wait for the signals that indicate buying in the bullish direction and the signals that indicate selling in the bearish direction, which is the green signal is considered buying and the red signal is considered selling
Also, this indicator differs from the rest of the indicators that the signal is prior to the movement of hair, meaning that it is predictive and is strong.
The green bar is the buying peak.
The red bar is oversold.
The red arrows indicate that you can sell, but the price must be monitored.
The green arrows indicate that it is possible to buy and monitor the price
The colored candles are 4, and each candle indicates the order of the candle.
1- The blue candle indicates a change in the bearish trend and the possibility of it changing to an upward trend.
2- The green candle, which indicates that there will be acceleration in the upward direction.
3- The yellow candle indicates a change in the upward trend and the possibility of it changing to the downside.
4- The red candle indicates that there will be acceleration in the downside direction
To help determine the trend, the average of the 50 simple has been set
NYSE:BA
FX:GBPUSD
TADAWUL:1120
BINANCE:BTCUSDT
MACD_STO-SAMI This indicator depends on the trend. You must first determine the general trend and then wait for the signals that indicate buying in the bullish direction and the signals that indicate selling in the bearish direction, which is the green signal is considered buying and the red signal is considered selling
Also, this indicator differs from the rest of the indicators that the signal is prior to the movement of hair, meaning that it is predictive and is strong.

[MACLEN] HODL ZONE RENKO
PLEASE READ!
Trade at your own risk. Please read about renko charts before using this indicator. This indicator is for educational purposes only.
This Indicator is only valid in renko charts with 1 second timeframe. For BTCUSDT . With the traditional method and the size box of 80.
With this indicator we can detect zones of buy and sell. Even that is not recommended to use leverage, I use it to find an entry and use only small leverages. It could be also used to accumulate and HODL bitcoin .
Please, comment anything.
POR FAVOR LEER!
Tradea bajo tu propio riesgo. Por favor lee sobre las graficas renko antes de usar este indicador. Este indicador es solamente con fines educativos.
Este indicador es válido solamente en graficas renko con un timeframe de 1 segundo. Para BTCUSDT . Con cajas del método tradicional de un tamaño de 80.
Con este indicador podemos detectar zonas de compra y venta. A pesar de que no es recomendable usar apalancamiento, yo lo uso para encontrar entradas y solo uso apalancamientos pequeños. También podría usarse para acumular y holdear bitcoin .
Por favor, escríbeme cualquier duda o comentario.
