[blackcat] L2 FArden Thomas Voting With Multiple TimeframesLevel 2
Background
For Traders’ Tips of November 2020, the focus is F. Arden Thomas’ article in the August 2020 issue, “Voting With Multiple Timeframes”.
Function
F. Arden Thomas sums up the returns by a stochastic indicator in a voting process over seven different timeframes, and uses the resulting votes for trade signals. He shows us a new way of using the classic stochastic oscillator by combining many timeframes into a single value by voting. By using this voting process, buy and sell signals derived from many intervals become clearly visible on the chart. This is an interesting concept that can be applied to many common indicators such as the RSI or ADX, not just the stochastic.
Although the author creates a voting system by counting the number of times the indicator is in overbought/oversold range, I thought it would be interesting to create a composite indicator by averaging the stochastic value over multiple timeframes into a single indicator that moves along the standard scale.
Remarks
Maroon~ Red color bars for bullish market.
Teal~ Green color bars for bearish market.
This is a Level 2 free and open source indicator.
Feedbacks are appreciated.
Cerca negli script per "stoch"

Ultimate MACDThis indicator is an improved version of MACD+RSI (refer to my script list). Basically, this indicator is a combination of several indicators:
1. Fast MACD (preset at 8, 16, 11 - it is my own preference settings and the red and blue line in this indicator are referring to the Fast MACD settings)
2. Slow MACD (preset at 12, 26, 9 - standard settings and the Slow MACD lines are not displayed in this indicator)
3. RSI (preset over value 50)
4. Stochastic (preset overbought at 80, oversold at 20)
How to read:
1. Fast and Slow MACD:
- Two red and blue lines are displaying the Fast MACD lines
- Small blue cross will appear at every crossover of the Fast MACD lines
- Golden Cross 1: Yellow background will appear if only Fast MACD lines are crossing to each other (blue crossover red)
- Golden Cross 2: Green background will appear if both Fast and Slow MACD lines are crossing to each other (blue crossover red but for Slow MACD, I didn't put those lines in this indicator)
- Death Cross 1: Blue background will appear if only Fast MACD lines are crossing to each other (red crossover blue)
- Death Cross 2: Red background will appear if both Fast and Slow MACD lines are crossing to each other (red crossover blue)
2. RSI:
- Purple dots will appear on the center line if RSI value is over 50
3. Stochastic:
- Big Blue cross will appear on the center line if stochastic line are crossing to each other in the oversold area (preset at 20)
- Big Red cross will appear on the center line if stochastic line are crossing to each other in the overbought area (preset at 80)
That's all about this indicator, you can use it based on your own trading style if it suits you. And again I let the script open for anyone to modify it based on your own preferences.
Indicator Functions with Factor and HeikinAshiHello all,
This indicator returns below selected indicators values with entered parameters.
Also you can add factorization, functions candles, function HeikinAshi and more to the plot.
VERSION:
Version 1: returns series only source and Length with already defined default values
Version 2: returns series with source, Length, p1 and p2 parameters according to the indicator definition (ex: )
PARAMETERS p1 p2
for defining multi arguments (See indicators list) indicator input value usable with verison=V2 selected.. ex: for alma( src , len ,offset=0.85,sigma=6), set source=source, len=length, p1=0.85 an p2=6
FACTOR:
Add double triple, Quadruple factors to selected indicator (like converting EMA to 2-DEMA, 3-TEMA, 4-QEMA...)
1-Original
2-Double
3-Triple
4-Quadruple
LOG
Log: Use log, log10 on function entries
PLOTTING:
PType: Plotting type of the function on the screen
Original :use original values
Org. Range (-1,1): usable for indicators between range -1 and 1
Stochastic: Convert indicator values by using stochastic calculation between -1 & 1. (use AT/% length to better view)
PercentRank: Convert indicator values by using Percent Rank calculation between -1 & 1. (use AT/% length to better view)
ST/%: length for plotting Type for stochastic and Percent Rank options
Smooth: Use SWMA for smoothing the function
DISPLAY TYPES
Plot Candles: Display the selected indicator as candle by implementing values
Plot Ind: Display result of indicator with selected source
HeikinAshi: Display Selected indicator candles with Heikin Ashi calculation
INDICATOR LIST:
hide = 'DONT DISPLAY', //Dont display & calculate the indicator. (For my framework usage)
alma = 'alma( src , len ,offset=0.85,sigma=6)', // Arnaud Legoux Moving Average
ama = 'ama( src , len ,fast=14,slow=100)', //Adjusted Moving Average
acdst = 'accdist()', // Accumulation/distribution index.
cma = 'cma( src , len )', //Corrective Moving average
dema = 'dema( src , len )', // Double EMA (Same as EMA with 2 factor)
ema = 'ema( src , len )', // Exponential Moving Average
gmma = 'gmma( src , len )', //Geometric Mean Moving Average
hghst = 'highest( src , len )', //Highest value for a given number of bars back.
hl2ma = 'hl2ma( src , len )', //higest lowest moving average
hma = 'hma( src , len )', // Hull Moving Average .
lgAdt = 'lagAdapt( src , len ,perclen=5,fperc=50)', //Ehler's Adaptive Laguerre filter
lgAdV = 'lagAdaptV( src , len ,perclen=5,fperc=50)', //Ehler's Adaptive Laguerre filter variation
lguer = 'laguerre( src , len )', //Ehler's Laguerre filter
lsrcp = 'lesrcp( src , len )', //lowest exponential esrcpanding moving line
lexp = 'lexp( src , len )', //lowest exponential expanding moving line
linrg = 'linreg( src , len ,loffset=1)', // Linear regression
lowst = 'lowest( src , len )', //Lovest value for a given number of bars back.
pcnl = 'percntl( src , len )', //percentile nearest rank. Calculates percentile using method of Nearest Rank.
pcnli = 'percntli( src , len )', //percentile linear interpolation. Calculates percentile using method of linear interpolation between the two nearest ranks.
rema = 'rema( src , len )', //Range EMA (REMA)
rma = 'rma( src , len )', //Moving average used in RSI . It is the exponentially weighted moving average with alpha = 1 / length.
sma = 'sma( src , len )', // Smoothed Moving Average
smma = 'smma( src , len )', // Smoothed Moving Average
supr2 = 'super2( src , len )', //Ehler's super smoother, 2 pole
supr3 = 'super3( src , len )', //Ehler's super smoother, 3 pole
strnd = 'supertrend( src , len ,period=3)', //Supertrend indicator
swma = 'swma( src , len )', //Sine-Weighted Moving Average
tema = 'tema( src , len )', // Triple EMA (Same as EMA with 3 factor)
tma = 'tma( src , len )', //Triangular Moving Average
vida = 'vida( src , len )', // Variable Index Dynamic Average
vwma = 'vwma( src , len )', // Volume Weigted Moving Average
wma = 'wma( src , len )', //Weigted Moving Average
angle = 'angle( src , len )', //angle of the series (Use its Input as another indicator output)
atr = 'atr( src , len )', // average true range . RMA of true range.
bbr = 'bbr( src , len ,mult=1)', // bollinger %%
bbw = 'bbw( src , len ,mult=2)', // Bollinger Bands Width . The Bollinger Band Width is the difference between the upper and the lower Bollinger Bands divided by the middle band.
cci = 'cci( src , len )', // commodity channel index
cctbb = 'cctbbo( src , len )', // CCT Bollinger Band Oscilator
chng = 'change( src , len )', //Difference between current value and previous, source - source.
cmo = 'cmo( src , len )', // Chande Momentum Oscillator . Calculates the difference between the sum of recent gains and the sum of recent losses and then divides the result by the sum of all price movement over the same period.
cog = 'cog( src , len )', //The cog (center of gravity ) is an indicator based on statistics and the Fibonacci golden ratio.
cpcrv = 'copcurve( src , len )', // Coppock Curve. was originally developed by Edwin "Sedge" Coppock (Barron's Magazine, October 1962).
corrl = 'correl( src , len )', // Correlation coefficient . Describes the degree to which two series tend to deviate from their ta. sma values.
count = 'count( src , len )', //green avg - red avg
dev = 'dev( src , len )', //ta.dev() Measure of difference between the series and it's ta. sma
fall = 'falling( src , len )', //ta.falling() Test if the `source` series is now falling for `length` bars long. (Use its Input as another indicator output)
kcr = 'kcr( src , len ,mult=2)', // Keltner Channels Range
kcw = 'kcw( src , len ,mult=2)', //ta.kcw(). Keltner Channels Width. The Keltner Channels Width is the difference between the upper and the lower Keltner Channels divided by the middle channel.
macd = 'macd( src , len )', // macd
mfi = 'mfi( src , len )', // Money Flow Index
nvi = 'nvi()', // Negative Volume Index
obv = 'obv()', // On Balance Volume
pvi = 'pvi()', // Positive Volume Index
pvt = 'pvt()', // Price Volume Trend
rise = 'rising( src , len )', //ta.rising() Test if the `source` series is now rising for `length` bars long. (Use its Input as another indicator output)
roc = 'roc( src , len )', // Rate of Change
rsi = 'rsi( src , len )', // Relative strength Index
smosc = 'smi_osc( src , len ,fast=5, slow=34)', //smi Oscillator
smsig = 'smi_sig( src , len ,fast=5, slow=34)', //smi Signal
stdev = 'stdev( src , len )', //Standart deviation
trix = 'trix( src , len )' , //the rate of change of a triple exponentially smoothed moving average .
tsi = 'tsi( src , len )', //True Strength Index
vari = 'variance( src , len )', //ta.variance(). Variance is the expectation of the squared deviation of a series from its mean (ta. sma ), and it informally measures how far a set of numbers are spread out from their mean.
wilpc = 'willprc( src , len )', // Williams %R
wad = 'wad()', // Williams Accumulation/Distribution .
wvad = 'wvad()' //Williams Variable Accumulation/Distribution
I will update the indicator list when I will update the library
Thanks to tradingview, @RodrigoKazuma for their open source indicators

All in one [Liubam]Hey tradingviewers!
This is an All in one Indicator for those who can't add too many indicators on your charts. Inspired by ©LonesomeTheBlue "Indicators all in one" script. I found a lot of very interesting scripts on the public library and I decided to make a tool with some of the greatest IMO, adding some modifications to improve the indicators. With this tool you can plot 1 of 6 different indicators by selecting it from a drop-down list (on the indicator settings).
All the credit goes to it's respective owners (taggeds).
THIS INDICATOR INCLUDES:
1. Classic RSI with some OB/OS tools:
The relative strength index (RSI) is a popular momentum indicator displayed as an oscillator (a line graph that moves between two extremes) that measures the magnitude of recent price changes to evaluate overbought or oversold conditions, in other words it shows signals about bullish and bearish price momentum. I added some visual improvements to help you finding the OB/OS zones.
2. Classic CCI with some OB/OS tools.
The Commodity Channel Index (CCI) is a momentum-based oscillator used as market indicator to help determine market movements that may indicate buying or selling. Added some vistual improvements to the chart.
3. ADX and DMI oscillator with the keylevel coded by @console:
The Average Directional Index (ADX) is non-directional indicator used by some traders to determine the strength of a trend. When the ADX line is rising (Above the keylevel) trend strength is increasing, and the price moves in the direction of the trend whether up or down. Otherwise, low ADX (Below the keylevel) is usually a sign of accumulation or distribution (Range). Non-trending doesn't mean the price isn't moving. It may not be, but the price could also be making a trend change or is too volatile for a clear direction to be present.
Suggested settings of the keylevel is 23-25.... REMEMBER: The trend may be your friend.
4. MFI
The Money Flow Index (MFI) is a technical oscillator for identifying overbought or oversold signals in an asset. Unlike conventional oscillators such as the RSI, the Money Flow Index incorporates both price and volume data, as opposed to just price. It can also be used to spot divergences which warn of a trend change in price.
5. Stochastic:
A stochastic oscillator is range-bound, meaning it is always between 0 and 100. This makes it a useful indicator of overbought and oversold conditions. Traditionally, readings over 80 are considered in the overbought range, and readings under 20 are considered oversold. However, these are not always indicative of impending reversal; very strong trends can maintain overbought or oversold conditions for an extended period. Instead, traders should look to changes in the stochastic oscillator for clues about future trend shifts. I added some features for this popular indicator to show the stochastic crosses.
6. The famous Squeeze momentum Indicator made by @Lazybear:
This is derivate of John Carter's "TTM Squeeze" volatility indicator and its very strong when using with trending indicator such a ADX. Black line (or no-line) on the midline show that the market just entered a squeeze ( Bollinger Bands are with in Keltner Channel). This signifies low volatility , market preparing itself for an explosive move (up or down). Gray line signify "Squeeze release". Mr.Carter suggests waiting till the gray line after a blackline, and taking a position in the direction of the momentum (for ex., if momentum value is above zero, go long). Exit the position when the momentum changes.
------------------------------------------------------------------------------------------------------------------------------------------------------------------------------------------------------------------------------------------------
This script is source code protected, but you can add to your favorite list to use it. Also you can add twice to use 2 different indicators at the same time (E.g. Squeeze Momentum Indicator + ADX)
An additional indicator I made (MA Hunterz + InfoPanel) is needed to not miss good entry points.
Your valuable comment and feedback is much appreciated...
And remember indicators can be really helpfull but always use Price Action.

GnG - Sniper SuperTrend with BuySell SignalThis Indicator possible traders to get a signal when trend is changing,
TrendUp with ArrowUp, TrendDown with ArrowDown.
Show buying and selling signal wsing EMA :
when short EMA cross-up Long EMA is Signal to Buy
when short EMA cross-down Long EMA is Signal to Sell
Using Stochastic 14-3-3 to get signal overbought and oversold.
when oversold, and StochK is crossing-up stochD, will show signal to buy.
when overbought, and StockK is crossing-down stockD, will show signal to sell.
Pivot H/L and Linear Regression for Resistance and Support.
With 2 Timeframe Linear Regression (Short and Long)
When study error, try to change the short time frame.
Including adjustable 7 SMA Line
Disclaimer On. Take your own risk.

GnG - Cuan Sniper with 7MA and Buy Sell SignalThis Indicator possible users to get a signal when buying and selling.
Using Cross EMA :
when short EMA cross-up Long EMA is Signal to Buy
when short EMA cross-down Long EMA is Signal to Sell
Using Stochastic 14-3-3 to get signal overbought and oversold.
when oversold, and StochK is crossing-up stochD, will show signal to buy.
when overbought, and StockK is crossing-down stockD, will show signal to sell.
Using Parabolic SAR, Pivot H/L, Cloud and Linear Regression to find Resistance and Support.
Disclaimer On. Take your own risk.

Next Candle by HallyThis indicator is used to determine if the next day cnadlestick is positive or negative.
If the two lines are mountain-shaped and their edges are aligned vertically, the next cnadlestick is likely to be negative.
Also, if the two lines have a valley shape and their edges are aligned vertically, the next cnadlestick is likely to be positive.
In any case, the result is uncertain until the next candle comes, but if you can predict from the trend of a shorter time axis, the advantage will increase.
Also, if cnadlestick have a long shadow, the indicator will be difficult to read.
This is an indicator that combines RSI and Stochastics.
x0xXx0xx0xXx0xx0xXx0xx0xXx0xx0xXx0xx0xXx0xx0xXx0xx0xX
このインジケーターは、次の日のローソクが陽線か陰線かを判断するために使います。
2本のラインが山の形になっていてそれらのエッジが縦に揃うと次のローソクは陰線になりやすいです。
また、2本のラインが谷の形をしていてそれらのエッジが縦に揃うと次のローソクは陽線になりやすいです。
いずれにしても、次のローソクが出現するまで結果は確定ませんが、もっと短い時間軸のトレンドから予想できれば優位性が増すことでしょう。
また、長いヒゲがある場合はインジケーターは読み辛くなります。
これはRSIとStochasticsを組み合わせたインジケーターです。

Advanced Confluence DashboardAdvanced Confluence Dashboard - Multi-Indicator Technical Analysis Tool
OVERVIEW
The Advanced Confluence Dashboard is a comprehensive technical analysis tool designed to help traders identify high-probability trade setups by tracking multiple technical indicators simultaneously. The indicator displays up to 13 different technical confluences in an easy-to-read dashboard format, providing both individual signals and an overall market bias percentage. Switch between full table view and condensed view for maximum chart flexibility.
FEATURES
- 13 Technical Confluences: RSI, VWAP, EMA Cross (9/21), MACD, Stochastic, Trend (50 EMA), Bollinger Bands, ADX Strength, Price Momentum, Volume Breakout, VWAP Bands, 200 EMA, and Price Action (Higher Highs/Lower Lows)
- Real-time Confluence Scoring: Automatically calculates bullish vs bearish signal strength
- Multi-Timeframe Support: Analyze indicators on any timeframe while viewing your chart on another
- Customizable Display: Toggle individual indicators on/off, adjust table position, size, and transparency
- ATR Information: Optional ATR display for volatility-based position sizing
- Condensed View Mode: Ultra-minimal display showing only confluence score and ATR (perfect for scalpers who want maximum chart visibility)
- Full Table View: Detailed breakdown of each indicator's value and signal
- Color-Coded Signals: Green (bullish), red (bearish), white (neutral) for instant visual clarity
HOW IT WORKS
The indicator evaluates each enabled technical indicator and assigns it either a bullish or bearish signal based on its current state. The confluence score shows how many indicators are aligned in each direction, giving you a clear percentage-based view of market bias. For example, if 8 out of 13 indicators are bullish, you'll see a 62% LONG BIAS signal.
DISPLAY MODES
Full View: Shows all enabled indicators with their current values and signals in a detailed table format. Perfect for understanding exactly which indicators are bullish or bearish and why.
Condensed View: Shows only the confluence score (e.g., "4/13 LONG | 9/13 SHORT - SHORT BIAS 69%") and optional ATR information. This minimal display keeps your chart clean while still providing the essential confluence data you need for quick trading decisions. Ideal for scalpers and traders who want maximum chart space.
CONFLUENCES EXPLAINED
- RSI: Momentum oscillator (>50 bullish, <50 bearish, shows overbought/oversold)
- VWAP: Volume-weighted average price (above = bullish, below = bearish)
- EMA Cross: Fast EMA (9) vs Slow EMA (21) with price position
- MACD: Trend-following momentum (line above signal = bullish)
- Stochastic: Momentum oscillator (>50 bullish, <50 bearish)
- Trend (50 EMA): Price position relative to 50-period EMA
- Bollinger Bands: Volatility and mean reversion (above middle = bullish)
- ADX Strength: Trend strength indicator (shows strong trends)
- Price Momentum: Rate of price change over specified period
- Volume Breakout: Detects unusual volume with directional bias
- VWAP Bands: Standard deviation bands around VWAP
- 200 EMA: Long-term trend indicator
- Price Action: Higher Highs and Lower Lows pattern detection
SETTINGS
Timeframe Settings:
- Indicator Timeframe: Analyze indicators on a different timeframe than your chart
Display Options:
- Condensed View: Toggle between full table and minimal display
- Show ATR Info: Display/hide ATR information
- Table Position: 9 positions (top/middle/bottom + left/center/right)
- Text Size: Auto, tiny, small, normal, large, huge
- Table Transparency: 0-100%
- Border Width: 1-5 pixels
Confluence Toggles:
- Enable/disable any of the 13 confluences individually
- Confluence score automatically adjusts based on enabled indicators
Indicator Settings:
- RSI Length (default: 14)
- ATR Length (default: 14)
- Fast/Slow EMA (default: 9/21)
- Trend EMA (default: 50)
- Volume SMA Length (default: 20)
- Volume Breakout Multiplier (default: 2.0x)
- Bollinger Bands Length/StdDev (default: 20/2.0)
- ADX Length (default: 14)
- ADX Strength Threshold (default: 25)
- Momentum Length (default: 10)
IDEAL USE CASES
- Scalping: Quick identification of confluence for fast entries/exits - use condensed view for clean charts
- Day Trading: Multi-timeframe analysis for intraday setups
- Swing Trading: Confirmation of longer-term bias
- Risk Management: Higher confluence = higher probability trades
- Trade Filtering: Only take trades when confluence reaches your threshold
- Multi-Monitor Setups: Use condensed view on execution charts, full view on analysis charts
HOW TO USE
1. Add the indicator to your chart
2. Toggle on/off the confluences you prefer to use
3. Choose between Full View (detailed) or Condensed View (minimal)
4. Adjust the table position and size to your preference
5. Look for high confluence percentages (70%+ is strong bias)
6. Use the individual indicator signals (full view) to understand market structure
7. Combine with your trading strategy for entry/exit confirmation
TIPS
- Use Condensed View when scalping to keep your chart clean and uncluttered
- Switch to Full View when you need to analyze which specific indicators are conflicting
- Higher confluence doesn't guarantee success - always use proper risk management
- Consider using 60%+ confluence as a minimum threshold for trades
- Pay attention to which specific indicators are aligned vs conflicting
- Use the ATR display for quick reference on position sizing
- Experiment with different timeframes to find what works for your style
- Disable indicators you don't use to simplify your confluence scoring
DISCLAIMER
This indicator is for educational and informational purposes only. It does not constitute financial advice, investment advice, trading advice, or any other type of advice. Trading and investing in financial markets involves substantial risk of loss and is not suitable for every investor. Past performance is not indicative of future results. Always do your own research and consult with a qualified financial advisor before making any investment decisions.

Flux-Tensor Singularity [FTS]Flux-Tensor Singularity - Multi-Factor Market Pressure Indicator
The Flux-Tensor Singularity (FTS) is an advanced multi-factor oscillator that combines volume analysis, momentum tracking, and volatility-weighted normalization to identify critical market inflection points. Unlike traditional single-factor indicators, FTS synthesizes price velocity, volume mass, and volatility context into a unified framework that adapts to changing market regimes.
This indicator identifies extreme market conditions (termed "singularities") where multiple confirming factors converge, then uses a sophisticated scoring system to determine directional bias. It is designed for traders seeking high-probability setups with built-in confluence requirements.
THEORETICAL FOUNDATION
The indicator is built on the premise that market time is not constant - different market conditions contain varying levels of information density. A 1-minute bar during a major news event contains far more actionable information than a 1-minute bar during overnight low-volume trading. Traditional indicators treat all bars equally; FTS does not.
The theoretical framework draws conceptual parallels to physics (purely as a mental model, not literal physics):
Volume as Mass: Large volume represents significant market participation and "weight" behind price moves. Just as massive objects have stronger gravitational effects, high-volume moves carry more significance.
Price Change as Velocity: The rate of price movement through price space represents momentum and directional force.
Volatility as Time Dilation: When volatility is high relative to its historical norm, the "information density" of each bar increases. The indicator weights these periods more heavily, similar to how time dilates near massive objects in physics.
This is a pedagogical metaphor to create a coherent mental model - the underlying mathematics are standard financial calculations combined in a novel way.
MATHEMATICAL FRAMEWORK
The indicator calculates a composite singularity value through four distinct steps:
Step 1: Raw Singularity Calculation
S_raw = (ΔP × V) × γ²
Where:
ΔP = Price Velocity = close - close
V = Volume Mass = log(volume + 1)
γ² = Time Dilation Factor = (ATR_local / ATR_global)²
Volume Transformation: Volume is log-transformed because raw volume can have extreme outliers (10x-100x normal). The logarithm compresses these spikes while preserving their significance. This is standard practice in volume analysis.
Volatility Weighting: The ratio of short-term ATR (5 periods) to long-term ATR (user-defined lookback) is squared to create a volatility amplification factor. When local volatility exceeds global volatility, this ratio increases, amplifying the raw singularity value. This makes the indicator regime-aware.
Step 2: Normalization
The raw singularity values are normalized to a 0-100 scale using a stochastic-style calculation:
S_normalized = ((S_raw - S_min) / (S_max - S_min)) × 100
Where S_min and S_max are the lowest and highest raw singularity values over the lookback period.
Step 3: Epsilon Compression
S_compressed = 50 + ((S_normalized - 50) / ε)
This is the critical innovation that makes the sensitivity control functional. By applying compression AFTER normalization, the epsilon parameter actually affects the final output:
ε < 1.0: Expands range (more signals)
ε = 1.0: No change (default)
ε > 1.0: Compresses toward 50 (fewer, higher-quality signals)
For example, with ε = 2.0, a normalized value of 90 becomes 70, making threshold breaches rarer and more significant.
Step 4: Smoothing
S_final = EMA(S_compressed, smoothing_period)
An exponential moving average removes high-frequency noise while preserving trend.
SIGNAL GENERATION LOGIC
When the tensor crosses above the upper threshold (default 90) or below the lower threshold (default 10), an extreme event is detected. However, the indicator does NOT immediately generate a buy or sell signal. Instead, it analyzes market context through a multi-factor scoring system:
Scoring Components:
Price Structure (+1 point): Current bar bullish/bearish
Momentum (+1 point): Price higher/lower than N bars ago
Trend Context (+2 points): Fast EMA above/below slow EMA (weighted heavier)
Acceleration (+1 point): Rate of change increasing/decreasing
Volume Multiplier (×1.5): If volume > average, multiply score
The highest score (bullish vs bearish) determines signal direction. This prevents the common indicator failure mode of "overbought can stay overbought" by requiring directional confirmation.
Signal Conditions:
A BUY signal requires:
Extreme event detection (tensor crosses threshold)
Bullish score > Bearish score
Price confirmation: Bullish candle (optional, user-controlled)
Volume confirmation: Volume > average (optional, user-controlled)
Momentum confirmation: Positive momentum (optional, user-controlled)
A SELL signal requires the inverse conditions.
INPUTS EXPLAINED - Core Parameters:
Global Horizon (Context): Default 20. Lookback period for normalization and volatility comparison. Higher values = smoother but less responsive. Lower values = more signals but potentially more noise.
Tensor Smoothing: Default 3. EMA period applied to final output. Removes "quantum foam" (high-frequency noise). Range 1-20.
Singularity Threshold: Default 90. Values above this (or below 100-threshold) trigger extreme event detection. Higher = rarer, stronger signals.
Signal Sensitivity (Epsilon): Default 1.0. Post-normalization compression factor. This is the key innovation - it actually works because it's applied AFTER normalization. Range 0.1-5.0.
Signal Interpreter Toggles:
Require Price Confirmation: Default ON. Only generates buy signals on bullish candles, sell signals on bearish candles. Reduces false signals but may delay entry.
Require Volume Confirmation: Default ON. Only signals when volume > average. Critical for stocks/crypto, less important for forex (unreliable volume data).
Use Momentum Filter: Default ON. Requires momentum agreement with signal direction. Prevents counter-trend signals.
Momentum Lookback: Default 5. Number of bars for momentum calculation. Shorter = more responsive, longer = trend-following bias.
Visual Controls:
Colors: Customizable colors for bullish flux, bearish flux, background, and event horizon.
Visual Transparency: Default 85. Master control for all visual elements (accretion disk, field lines, particles, etc.). Range 50-99. Signals and dashboard have separate controls.
Visibility Toggles: Individual on/off switches for:
Gravitational field lines (trend EMAs)
Field reversals (trend crossovers)
Accretion disk (background gradient)
Singularity diamonds (neutral extreme events)
Energy particles (volume bursts)
Event horizon flash (extreme event background)
Signal background flash
Signal Size: Tiny/Small/Normal triangle size
Signal Offsets: Separate controls for buy and sell signal vertical positioning (percentage of price)
Dashboard Settings:
Show Dashboard: Toggle on/off
Position: 9 placement options (all corners, centers, middles)
Text Size: Tiny/Small/Normal/Large
Background Transparency: 0-50, separate from visual transparency
VISUAL ELEMENTS EXPLAINED
1. Accretion Disk (Background Gradient):
A three-layer gradient background that intensifies as the tensor approaches extremes. The outer disk appears at any non-neutral reading, the inner disk activates above 70 or below 30, and the core layer appears above 85 or below 15. Color indicates direction (cyan = bullish, red = bearish). This provides instant visual feedback on market pressure intensity.
2. Gravitational Field Lines (EMAs):
Two trend-following EMAs (10 and 30 period) visualized as colored lines. These represent the "curvature" of market trend - when they diverge, trend is strong; when they converge, trend is weakening. Crossovers mark potential trend reversals.
3. Field Reversals (Circles):
Small circles appear when the fast EMA crosses the slow EMA, indicating a potential trend change. These are distinct from extreme events and appear at normal market structure shifts.
4. Singularity Diamonds:
Small diamond shapes appear when the tensor reaches extreme levels (>90 or <10) but doesn't meet the full signal criteria. These are "watch" events - extreme pressure exists but directional confirmation is lacking.
5. Energy Particles (Dots):
Tiny dots appear when volume exceeds 2× average, indicating significant participation. Color matches bar direction. These highlight genuine high-conviction moves versus low-volume drifts.
6. Event Horizon Flash:
A golden background flash appears the instant any extreme threshold is breached, before directional analysis. This alerts you to pay attention.
7. Signal Background Flash:
When a full buy/sell signal is confirmed, the background flashes cyan (buy) or red (sell). This is your primary alert that all conditions are met.
8. Signal Triangles:
The actual buy (▲) and sell (▼) markers. These only appear when ALL selected confirmation criteria are satisfied. Position is offset from bars to avoid overlap with other indicators.
DASHBOARD METRICS EXPLAINED
The dashboard displays real-time calculated values:
Event Density: Current tensor value (0-100). Above 90 or below 10 = critical. Icon changes: 🔥 (extreme high), ❄️ (extreme low), ○ (neutral).
Time Dilation (γ): Current volatility ratio squared. Values >2.0 indicate extreme volatility environments. >1.5 = elevated, >1.0 = above average. Icon: ⚡ (extreme), ⚠ (elevated), ○ (normal).
Mass (Vol): Log-transformed volume value. Compared to volume ratio (current/average). Icon: ● (>2× avg), ◐ (>1× avg), ○ (below avg).
Velocity (ΔP): Raw price change. Direction arrow indicates momentum direction. Shows the actual price delta value.
Bullish Flux: Current bullish context score. Displayed as both a bar chart (visual) and numeric value. Brighter when bullish score dominates.
Bearish Flux: Current bearish context score. Same visualization as bullish flux. These scores compete - the winner determines signal direction.
Field: Trend direction based on EMA relationship. "Repulsive" (uptrend), "Attractive" (downtrend), "Neutral" (ranging). Icon: ⬆⬇↔
State: Current market condition:
🚀 EJECTION: Buy signal active
💥 COLLAPSE: Sell signal active
⚠ CRITICAL: Extreme event, no directional confirmation
● STABLE: Normal market conditions
HOW TO USE THE INDICATOR
1. Wait for Extreme Events:
The indicator is designed to be selective. Don't trade every fluctuation - wait for tensor to reach >90 or <10. This alone is not a signal.
2. Check Context Scores:
Look at the Bullish Flux vs Bearish Flux in the dashboard. If scores are close (within 1-2 points), the market is indecisive - skip the trade.
3. Confirm with Signals:
Only act when a full triangle signal appears (▲ or ▼). This means ALL your selected confirmation criteria have been met.
4. Use with Price Structure:
Combine with support/resistance levels. A buy signal AT support is higher probability than a buy signal in the middle of nowhere.
5. Respect the Dashboard State:
When State shows "CRITICAL" (⚠), it means extreme pressure exists but direction is unclear. These are the most dangerous moments - wait for resolution.
6. Volume Matters:
Energy particles (dots) and the Mass metric tell you if institutions are participating. Signals without volume confirmation are lower probability.
MARKET AND TIMEFRAME RECOMMENDATIONS
Scalping (1m-5m):
Lookback: 10-14
Smoothing: 5-7
Threshold: 85
Epsilon: 0.5-0.7
Note: Expect more noise. Confirm with Level 2 data. Best on highly liquid instruments.
Intraday (15m-1h):
Lookback: 20-30 (default settings work well)
Smoothing: 3-5
Threshold: 90
Epsilon: 1.0
Note: Sweet spot for the indicator. High win rate on liquid stocks, forex majors, and crypto.
Swing Trading (4h-1D):
Lookback: 30-50
Smoothing: 3
Threshold: 90-95
Epsilon: 1.5-2.0
Note: Signals are rare but high conviction. Combine with higher timeframe trend analysis.
Position Trading (1D-1W):
Lookback: 50-100
Smoothing: 5-7
Threshold: 95
Epsilon: 2.0-3.0
Note: Extremely rare signals. Only trade the most extreme events. Expect massive moves.
Market-Specific Settings:
Forex (EUR/USD, GBP/USD, etc.):
Volume data is unreliable (spot forex has no centralized volume)
Disable "Require Volume Confirmation"
Focus on momentum and trend filters
News events create extreme singularities
Best on 15m-1h timeframes
Stocks (High-Volume Equities):
Volume confirmation is CRITICAL - keep it ON
Works excellently on AAPL, TSLA, SPY, etc.
Morning session (9:30-11:00 ET) shows highest event density
Earnings announcements create guaranteed extreme events
Best on 5m-1h for day trading, 1D for swing trading
Crypto (BTC, ETH, major alts):
Reduce threshold to 85 (crypto has constant high volatility)
Volume spikes are THE primary signal - keep volume confirmation ON
Works exceptionally well due to 24/7 trading and high volatility
Epsilon can be reduced to 0.7-0.8 for more signals
Best on 15m-4h timeframes
Commodities (Gold, Oil, etc.):
Gold responds to macro events (Fed announcements, geopolitical events)
Oil responds to supply shocks
Use daily timeframe minimum
Increase lookback to 50+
These are slow-moving markets - be patient
Indices (SPX, NDX, etc.):
Institutional volume matters - keep volume confirmation ON
Opening hour (9:30-10:30 ET) = highest singularity probability
Strong correlation with VIX - high VIX = more extreme events
Best on 15m-1h for day trading
WHAT MAKES THIS INDICATOR UNIQUE
1. Post-Normalization Sensitivity Control:
Unlike most oscillators where sensitivity controls don't actually work (they're applied before normalization, which then rescales everything), FTS applies epsilon compression AFTER normalization. This means the sensitivity parameter genuinely affects signal frequency. This is a novel implementation not found in standard oscillators.
2. Multi-Factor Confluence Requirement:
The indicator doesn't just detect "overbought" or "oversold" - it detects extreme conditions AND THEN analyzes context through five separate factors (price structure, momentum, trend, acceleration, volume). Most indicators are single-factor; FTS requires confluence.
3. Volatility-Weighted Normalization:
By squaring the ATR ratio (local/global), the indicator adapts to changing market regimes. A 1% move in a low-volatility environment is treated differently than a 1% move in a high-volatility environment. Traditional indicators treat all moves equally regardless of context.
4. Volume Integration at the Core:
Volume isn't an afterthought or optional filter - it's baked into the fundamental equation as "mass." The log transformation handles outliers elegantly while preserving significance. Most price-based indicators completely ignore volume.
5. Adaptive Scoring System:
Rather than fixed buy/sell rules ("RSI >70 = sell"), FTS uses competitive scoring where bullish and bearish evidence compete. The winner determines direction. This solves the classic problem of "overbought markets can stay overbought during strong uptrends."
6. Comprehensive Visual Feedback:
The multi-layer visualization system (accretion disk, field lines, particles, flashes) provides instant intuitive feedback on market state without requiring dashboard reading. You can see pressure building before extreme thresholds are hit.
7. Separate Extreme Detection and Signal Generation:
"Singularity diamonds" show extreme events that don't meet full criteria, while "signal triangles" only appear when ALL conditions are met. This distinction helps traders understand when pressure exists versus when it's actionable.
COMPARISON TO EXISTING INDICATORS
vs. RSI/Stochastic:
These normalize price relative to recent range. FTS normalizes (price change × log volume × volatility ratio) - a composite metric, not just price position.
vs. Chaikin Money Flow:
CMF combines price and volume but lacks volatility context and doesn't use adaptive normalization or post-normalization compression.
vs. Bollinger Bands + Volume:
Bollinger Bands show volatility but don't integrate volume or create a unified oscillator. They're separate components, not synthesized.
vs. MACD:
MACD is pure momentum. FTS combines momentum with volume weighting and volatility context, plus provides a normalized 0-100 scale.
The specific combination of log-volume weighting, squared volatility amplification, post-normalization epsilon compression, and multi-factor directional scoring is unique to this indicator.
LIMITATIONS AND PROPER DISCLOSURE
Not a Holy Grail:
No indicator is perfect. This tool identifies high-probability setups but cannot predict the future. Losses will occur. Use proper risk management.
Requires Confirmation:
Best used in conjunction with price action analysis, support/resistance levels, and higher timeframe trend. Don't trade signals blindly.
Volume Data Dependency:
On forex (spot) and some low-volume instruments, volume data is unreliable or tick-volume only. Disable volume confirmation in these cases.
Lagging Components:
The EMA smoothing and trend filters are inherently lagging. In extremely fast moves, signals may appear after the initial thrust.
Extreme Event Rarity:
With conservative settings (high threshold, high epsilon), signals can be rare. This is by design - quality over quantity. If you need more frequent signals, reduce threshold to 85 and epsilon to 0.7.
Not Financial Advice:
This indicator is an analytical tool. All trading decisions and their consequences are solely your responsibility. Past performance does not guarantee future results.
BEST PRACTICES
Don't trade every singularity - wait for context confirmation
Higher timeframes = higher reliability
Combine with support/resistance for entry refinement
Volume confirmation is CRITICAL for stocks/crypto (toggle off only for forex)
During major news events, singularities are inevitable but direction may be uncertain - use wider stops
When bullish and bearish flux scores are close, skip the trade
Test settings on your specific instrument/timeframe before live trading
Use the dashboard actively - it contains critical diagnostic information
Taking you to school. — Dskyz, Trade with insight. Trade with anticipation.

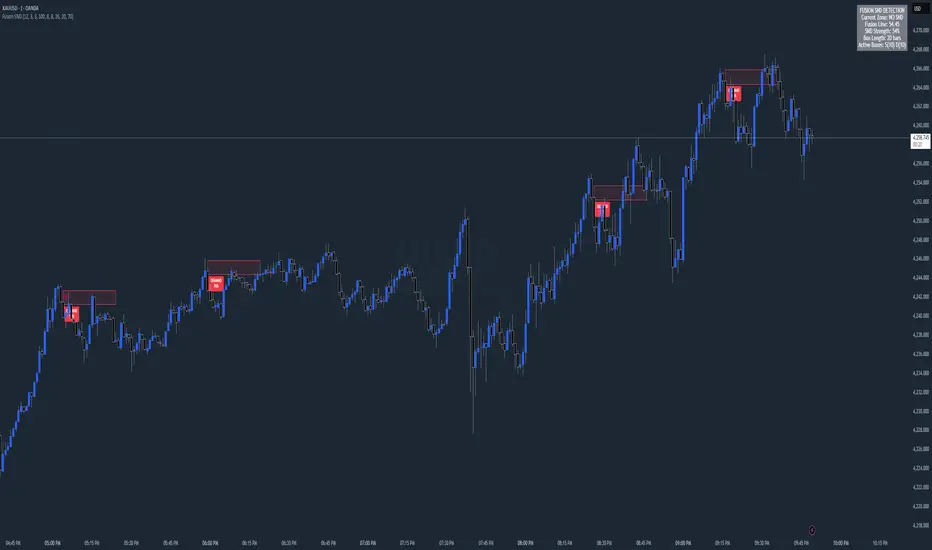
Chart Fusion Line SND Detection by TitikSona🧭 Overview
Fusion Line Momentum Analyzer is a momentum visualization tool that introduces a unified model of oscillator fusion.
It blends Fast and Slow Stochastics with RSI into one adaptive curve, designed to eliminate conflicting signals between different momentum sources.
Instead of reading three separate oscillators, the Fusion Line provides a consolidated view of strength and exhaustion zones in a single framework.
This approach helps analysts detect aligned momentum shifts with greater clarity and less noise, without repainting or lagging methods.
⚙️ Core Concept
Traditional oscillators often provide conflicting readings when volatility changes.
To solve this, the Fusion Line averages three normalized components:
Fast Stochastic (12,3,3) — reacts quickly to short-term momentum spikes.
Slow Stochastic (100,8,8) — filters long-term momentum context.
RSI (26) — measures internal strength between buying and selling pressure.
Each is rescaled to a 0–100 range, then averaged into a single curve called the Fusion Line.
A secondary Signal Line (SMA 9) is added to visualize directional confirmation.
This combination aims to preserve responsiveness from the fast components while maintaining structural stability from the slow and RSI layers.
🌈 Features
Unified momentum curve combining stochastic and RSI dynamics.
Automatic bias shading to highlight dominant trend direction.
Real-time percentage strength meter (visual intensity).
Configurable alert triggers on key momentum zones (20/80).
Clean chart display without unnecessary elements or overlays.
📘 Interpretation
Rising Fusion Line → indicates strengthening bullish momentum.
Falling Fusion Line → indicates strengthening bearish pressure.
Fusion values below 20 → potential oversold recovery.
Fusion values above 80 → possible exhaustion or reversal zone.
Mid-zone movement → reflects equilibrium or sideways momentum.
These readings should always be combined with higher timeframe structure or volume confirmation for context.
⚙️ Default Parameters
Fast Stochastic (12,3,3)
Slow Stochastic (100,8,8)
RSI Length (26)
Signal Line Smoothing (9)
All values can be adjusted to adapt to asset volatility or timeframe conditions.
⚠️ Disclaimer
This indicator is a research and visualization tool, not a signal generator.
It does not predict price movement or guarantee performance.
Use for analytical purposes only and combine with your own trading framework.
👨💻 Developer
Created by TitikSona — Research & Fusion Concept Designer
Built using Pine Script v6
Type: Open-source educational script
💬 Short Description
Fusion-based momentum visualization combining Double Stochastic and RSI into one adaptive line for clearer, noise-free momentum analysis.
Synthetic Point & Figure on RSIHere is a detailed description and user guide for the Synthetic Point & Figure RSI indicator, including how to use it for long and short trade considerations:
*
## Synthetic Point & Figure RSI Indicator – User Guide
### What It Is
This indicator applies classic Point & Figure (P&F) charting logic to the Relative Strength Index (RSI) instead of price. It transforms the RSI into synthetic “P&F candles” that filter out noise and highlight significant momentum moves and reversals based on configurable box size and reversal settings.
### How It Works
- The RSI is calculated normally over the selected length.
- The P&F engine tracks movements in the RSI above or below a defined “box size,” creating columns that switch direction only after a larger reversal.
- The synthetic candles connect these filtered RSI values visually, reducing false noise and emphasizing strong RSI trends.
- Optional EMA and SMA overlays on the synthetic P&F RSI allow smoother trend signals.
- Reference RSI levels at 33, 40, 50, 60, and 66 provide further context for momentum strength.
### How to Use for Trading
#### Long (Buy) Considerations
- The synthetic P&F RSI candle direction flips to *up (green candles)* indicating strength in momentum.
- Look for the RSI P&F value moving above the *40 or 50 level*, suggesting increasing bullish momentum.
- Confirmation is stronger if the synthetic RSI is above the EMA or SMA overlays.
- Ideal entries are after a reversal from a synthetic P&F downtrend (red candles) to an uptrend (green candles) near or above these levels.
#### Short (Sell) Considerations
- The candle direction flips to *down (red candles)*, showing weakening momentum or bearish reversal.
- Monitor if the synthetic RSI falls below the *60 or 50 level*, signaling momentum loss.
- Confirm bearish bias if the price is below the EMA or SMA overlays.
- Exit or short positions are signaled when the synthetic candle reverses from green to red near or below these threshold levels.
### Important RSI Levels to Watch
- *Level 33*: Lower bound indicating deep oversold conditions.
- *Level 40*: Early bullish zone suggesting momentum improvement.
- *Level 50*: Neutral midpoint; crossing above often signals bullish strength, below signals weakness.
- *Level 60*: Advanced bullish momentum; breaking below signals potential reversal.
- *Level 66*: Strong overbought area warning of possible pullback.
### Tips
- Use in conjunction with price action analysis and other volume/trend indicators for higher conviction.
- Adjust box size and reversal settings based on instrument volatility and timeframe for ideal filtering.
- The P&F RSI is best for identifying sustained momentum trends and avoiding false RSI whipsaws.
- Combine this indicator’s signals with stop-loss and risk management strategies.
*
This indicator converts RSI momentum analysis into a simplified, noise-filtered P&F chart format, helping traders better visualize and trade momentum shifts. It is especially useful when RSI signal noise can cause confusion in volatile markets.
Let me know if you want me to generate a shorter summary or code alerts based on these levels!
Sources
Relative Strength Index (RSI) — Indicators and Strategies in.tradingview.com
Indicators and strategies in.tradingview.com
Relative Strength Index (RSI) Indicator: Tutorial www.youtube.com
Stochastic RSI (STOCH RSI) in.tradingview.com
RSI Strategy docs.algotest.in
Stochastic RSI Indicator: Tutorial www.youtube.com
Relative Strength Index (RSI): What It Is, How It Works, and ... www.investopedia.com
rsi — Indicators and Strategies in.tradingview.com
Relative Strength Index (RSI) in.tradingview.com
Relative Strength Index (RSI) — Indicators and Strategies www.tradingview.com

Multiple (12) Strong Buy/Sell Signals + Momentum
Indicator Manual: "Multiple (12) Strong Buy/Sell Signals + Momentum"
This indicator is designed to identify strong buy and sell signals based on 12 configurable conditions, which include a variety of technical analysis methods such as trend-following indicators, pattern recognition, volume analysis, and momentum oscillators. It allows for customizable alerts and visual cues on the chart. The indicator helps traders spot potential entry and exit points by displaying buy and sell signals based on the selected conditions.
Key Observations:
• The script integrates multiple indicators and pattern recognition methods to provide comprehensive buy/sell signals.
• Trend-based indicators like EMAs and MACD are combined with pattern recognition (flags, triangles) and momentum-based signals (RSI, ADX, and volume analysis).
• User customization is a core feature, allowing adjustments to the conditions and thresholds for more tailored signals.
• The script is designed to be responsive to market conditions, with multiple conditions filtering out noise to generate reliable signals.
________________________________________
Key Features:
1. 12 Combined Buy/Sell Signal Conditions: This indicator incorporates a diverse set of conditions based on trend analysis, momentum, and price patterns.
2. Minimum Conditions Input: You can adjust the threshold of conditions that need to be met for the buy/sell signals to appear.
3. Alert Customization: Set alert thresholds for both buy and sell signals.
4. Dynamic Visualization: Buy and sell signals are shown as triangles on the chart, with momentum signals highlighted as circles.
________________________________________
Detailed Description of the 12 Conditions:
1. Exponential Moving Averages (EMA):
o Conditions: The indicator uses EMAs with periods 3, 8, and 13 for quick trend-following signals.
o Bullish Signal: EMA3 > EMA8 > EMA13 (Bullish stack).
o Bearish Signal: EMA3 < EMA8 < EMA13 (Bearish stack).
o Reversal Signal: The crossing over or under of these EMAs can signify trend reversals.
2. MACD (Moving Average Convergence Divergence):
o Fast MACD (2, 7, 3) is used to confirm trends quickly.
o Bullish Signal: When the MACD line crosses above the signal line.
o Bearish Signal: When the MACD line crosses below the signal line.
3. Donchian Channel:
o Tracks the highest high and lowest low over a given period (default 20).
o Breakout Signal: Price breaking above the upper band is bullish; breaking below the lower band is bearish.
4. VWAP (Volume-Weighted Average Price):
o Above VWAP: Bullish condition (price above VWAP).
o Below VWAP: Bearish condition (price below VWAP).
5. EMA Stacking & Reversal:
o Tracks the order of EMAs (3, 8, 13) to confirm strong trends and reversals.
o Bullish Reversal: EMA3 < EMA8 < EMA13 followed by a crossing to bullish.
o Bearish Reversal: EMA3 > EMA8 > EMA13 followed by a crossing to bearish.
6. Bull/Bear Flags:
o Bull Flag: Characterized by a strong price movement (flagpole) followed by a pullback and breakout.
o Bear Flag: Similar to Bull Flag but in the opposite direction.
7. Triangle Patterns (Ascending and Descending):
o Detects ascending and descending triangles using pivot highs and lows.
o Ascending Triangle: Higher lows and flat resistance.
o Descending Triangle: Lower highs and flat support.
8. Volume Sensitivity:
o Identifies price moves with significant volume increases.
o High Volume: When current volume is significantly above the moving average volume (set to 1.2x of the average).
9. Momentum Indicators:
o RSI (Relative Strength Index): Confirms overbought and oversold levels with thresholds set at 65 (overbought) and 35 (oversold).
o ADX (Average Directional Index): Confirms strong trends when ADX > 28.
o Momentum Up: Momentum is upward with strong volume and bullish RSI/ADX conditions.
o Momentum Down: Momentum is downward with strong volume and bearish RSI/ADX conditions.
10. Bollinger & Keltner Squeeze:
o Squeeze Condition: A contraction in both Bollinger Bands and Keltner Channels indicates low volatility, signaling a potential breakout.
o Squeeze Breakout: Price breaking above or below the squeeze bands.
11. 3 Consecutive Candles Condition:
o Bullish: Price rises for three consecutive candles with higher highs and lows.
o Bearish: Price falls for three consecutive candles with lower highs and lows.
12. Williams %R and Stochastic RSI:
o Williams %R: A momentum oscillator with signals when the line crosses certain levels.
o Stochastic RSI: Provides overbought/oversold levels with smoother signals.
o Combined Signals: You can choose whether to require both WPR and StochRSI to signal a buy/sell.
________________________________________
User Inputs (Inputs Tab):
1. Minimum Conditions for Buy/Sell:
o min_conditions: Number of conditions required to trigger a buy/sell signal on the chart (1 to 12).
o Alert_min_conditions: User-defined alert threshold (how many conditions must be met before an alert is triggered).
2. Donchian Channel Settings:
o Show Donchian: Toggle visibility of the Donchian channel.
o Donchian Length: The length of the Donchian Channel (default 20).
3. Bull/Bear Flag Settings:
o Bull Flag Flagpole Strength: ATR multiplier to define the strength of the flagpole.
o Bull Flag Pullback Length: Length of pullback for the bull flag pattern.
o Bull Flag EMA Length: EMA length used to confirm trend during bull flag pattern.
Similar settings exist for Bear Flag patterns.
4. Momentum Indicators:
o RSI Length: Period for calculating the RSI (default 9).
o RSI Overbought: Overbought threshold for the RSI (default 65).
o RSI Oversold: Oversold threshold for the RSI (default 35).
5. Bollinger/Keltner Squeeze Settings:
o Squeeze Width Threshold: The maximum width of the Bollinger and Keltner Bands for squeeze conditions.
6. Stochastic RSI Settings:
o Stochastic RSI Length: The period for calculating the Stochastic RSI.
7. WPR Settings:
o WPR Length: Period for calculating Williams %R (default 14).
________________________________________
User Inputs (Style Tab):
1. Signal Plotting:
o Control the display and colors of the buy/sell signals, momentum indicators, and pattern signals on the chart.
o Buy/Sell Signals: Can be customized with different colors and shapes (triangle up for buys, triangle down for sells).
o Momentum Signals: Custom circle placement for momentum-up or momentum-down signals.
2. Donchian Channel:
o Show Donchian: Toggle visibility of the Donchian upper, lower, and middle bands.
o Band Colors: Choose the color for each band (upper, lower, middle).
________________________________________
How to Use the Indicator:
1. Adjust Minimum Conditions: Set the minimum number of conditions that must be met for a signal to appear. For example, set it to 5 if you want only stronger signals.
2. Set Alert Threshold: Define the number of conditions needed to trigger an alert. This can be different from the minimum conditions for visual signals.
3. Customize Appearance: Modify the colors and styles of the signals to match your preferences.
________________________________________
Conclusion:
This comprehensive trading indicator uses a combination of trend-following, pattern recognition, and momentum-based conditions to help you spot potential buy and sell opportunities. By adjusting the input settings, you can fine-tune it to match your specific trading strategy, making it a versatile tool for different market conditions.
Signal Reliability Based on Condition Count
The reliability of the buy/sell signals increases as more conditions are met. Here's a breakdown of the probabilities:
1. 1-3 Conditions Met: Lower Probability
o Signals that meet only 1-3 conditions tend to have lower reliability and are considered less probable. These signals may represent false positives or weaker market movements, and traders should approach them with caution.
2. 4 Conditions Met: More Reliable Signal
o When 4 conditions are met, the signal becomes more reliable. This indicates that multiple indicators or market patterns are aligning, increasing the likelihood of a valid buy/sell opportunity. While not foolproof, it's a stronger indication that the market may be moving in a particular direction.
3. 5-6 Conditions Met: Strong Signal
o A signal meeting 5-6 conditions is considered a strong signal. This indicates a well-confirmed move, with several technical indicators and market factors aligning to suggest a higher probability of success. These are the signals that traders often prioritize.
4. 7+ Conditions Met: Rare and High-Confidence Signal
o Signals that meet 7 or more conditions are rare and should be considered high-confidence signals. These represent a significant alignment of multiple factors, and while they are less frequent, they are highly reliable when they do occur. Traders can be more confident in acting on these signals, but they should still monitor market conditions for confirmation.
________________________________________
You can adjust the number of conditions as needed, but this breakdown should give a clear structure on how the signal strength correlates with the number of conditions met!

Backtest any Indicator v5Happy Trade,
here you get the opportunity to backtest any of your indicators like a strategy without converting them into a strategy. You can choose to go long or go short and detailed time filters. Further more you can set the take profit and stop loss, initial capital, quantity per trade and set the exchange fees. You get an overall result table and even a detailed, scroll-able table with all trades. In the Image 1 you see the provided info tables about all Trades and the Result Summary. Further more every trade is marked by a background color, Labels and Levels. An opening Label with the trade direction and trade number. A closing Label again with the trade number, the trades profit in % and the total amount of $ after all past trades. A green line for the take profit level and a red line for the stop loss.
Image 1
Example
For this description we choose the Stochastic RSI indicator from TradingView as it is. In Image 2 is shown the performance of it with decent settings.
Timeframe=45, BTCUSD, 2023-08-01 - 2023-10-20
Stoch RSI: k=30, d=40, RSI-length=140, stoch-length=140
Backtest any Indicator: input signal=Stoch RSI, goLong, take profit=9.1%, stop loss=2.5%, start capital=1000$, qty=5%, fee=0.1%, no Session Filter
Image 2
Usage
1) You need to know the name of the boolean (or integer) variable of your indicator which hold the buy condition. Lets say that this boolean variable is called BUY. If this BUY variable is not plotted on the chart you simply add the following code line at the end of your pine script.
For boolean (true/false) BUY variables use this:
plot(BUY ? 1:0,'Your buy condition hold in that variable BUY',display = display.data_window)
And in case your script's BUY variable is an integer or float then use instate the following code line:
plot(BUY ,'Your buy condition hold in that variable BUY',display = display.data_window)
2) Probably the name of this BUY variable in your indicator is not BUY. Simply replace in the code line above the BUY with the name of your script's trade condition variable.
3) Save your changed Indicator script.
4) Then add this 'Backtest any Indicator' script to the chart ...
5) and go to the settings of it. Choose under "Settings -> Buy Signal" your Indicator. So in the example above choose .
The form is usually: ' : BUY'. Then you see something like Image 2
6) Decide which trade direction the BUY signal should trigger. A go Long or a go Short by set the hook or not.
Now you have a backtest of your Indicator without converting it into a strategy. You may change the setting of your Indicator to the best results and setup the following strategy settings like Time- and Session Filter, Stop Loss, Take Profit etc. More of it below in the section Settings Menu.
Appereance
In the Image 2 you see on the right side the List of Trades . To scroll down you go into the settings again and decrease the scroll value. So you can see all trades that have happened before. In case there is an open trade you will find it at the last position of the list.
Every Long trade is green back grounded while Short trades are red.
Every trade begins with a label that show goLong or goShort and its number. And ends with another label again with its number, Profit in % and the resulting total amount of cash.
If activated you further see the Take Profit as a green line and the Stop Loss as a orange line. In the settings you can set their percentage above or below the entry price.
You also see the Result Summary below. Here you find the usual stats of a strategy of all closed trades. The profit after total amount of fees , amount of trades, Profit Factor and the total amount of fees .
Settings Menu
In the settings menu you will find the following high-lighted sections. Most of the settings have a question mark on their right side. Move over it with the cursor to read specific explanation.
Input Signal of your Indicator: Under Buy you set the trade signal of your Indicator. And under Target you set the value when a trade should happen. In the Example with the Stochastic RSI above we used 20. Below you can set the trade direction, let it be go short when hooked or go long when unhooked.
Trade Settings & List of Trades: Take Profit set the target price of any trade. Stop Loss set the price to step out when a trade goes the wrong direction. Check mark the List of Trades to see any single trade with their stats. In case that there are more trades as fits in the list you can scroll down the list by decrease the value Scroll .
Time Filter: You can set a Start Time or deactivate it by leave it unhooked. The same with End Time .
Session Filter: here you can choose to activate it on weekly base. Which days of the week should be trading and those without. And also on daily base from which time on and until trade are possible. Outside of all times and sessions there will be no new trades if activated.
Invest Settings: here you can choose the amount of cash to start with. The Quantity percentage define for every trade how much of the cash should be invested and the Fee percentage which have to be payed every trade. Open position and closing position.
Other Announcements
This Backtest script don't use the strategy functions of TradingView. It is programmed as an indicator. All trades get executed at candle closing. This script use the functionality "Indicator-on-Indicator" from TradingView.
Conclusion
So now it is your turn, take your promising indicators and connect it to that Backtest script. With it you get a fast impression of how successful your indicator will trade. You don't have to relay on coders who maybe add cheating code lines. Further more you can check with the Time Filter under which market condition you indicator perform the best or not so well. Also with the Session Filter you can sort out repeating good market conditions for your indicator. Even you can check with the GoShort XOR GoLong check mark the trade signals of you indicator in opposite trade direction with one click. And compare your indicators under the same conditions and get the results just after 2 clicks. Thanks to the in-build fee setting you get an impression how much a 0.1% fee cost you in total.
Cheers

Divergences RefurbishedJust as "a butterfly can flap its wings over a flower in China and cause a hurricane in the Caribbean" (Edward Lorenz), small divergences in markets can signal big trading opportunities.
█Introduction
This is a script forked from LonesomeTheBlue's Divergence for Many Indicators v4.
It is a script that checks for divergence between price and many indicators.
In this version, I added more indicators and also added 40 symbols to check for divergences.
More info on the original script can be found here:
█ Improvements
The following improvements have been implemented over v4:
1. Added parameters to customize indicators.
2. Added new indicators:
- Stoch RSI
- Volume Oscillator
- PVT (Price Volume Trend)
- Ultimate Oscillator
- Fisher Transform
- Z-Score/T-Score
3. Now there is the possibility of using 2 external indicators.
4. New option to show tooltips inside labels.
This allows you to save space on the screen if you choose the option to only show the number of divergences or just the abbreviations.
5. New option to show additional text next to the indicator name.
This allows for grouping of indicators and symbols and better visualization, whether through emojis, for example.
6. Added 40 customizable symbols to check for divergences.
7. Option "show only the first letter" of the indicator replaced by: "show the abbreviation of the indicator".
Reason: the indicator abbreviation is more informative and easier to read.
8. Script converted to PineScript version 5.
█ CONCEPTS
Below I present a brief description of the available indicators.
1. Moving Average Convergence/Divergence (MACD):
Shows the difference between short-term and long-term exponential moving averages.
2. MACD Histogram:
Shows the difference between MACD and its signal line.
3. Relative Strength Index (RSI):
Measures the relative strength of recent price gains to recent price losses of an asset.
4. Stochastic Oscillator (Stoch):
Compares the current price of an asset to its price range over a specified time period.
5. Stoch RSI:
Stochastic of RSI.
6. Commodity Channel Index (CCI):
Measures the relationship between an asset's current price and its moving average.
7. Momentum: Shows the difference between the current price and the price a few periods ago.
Shows the difference between the current price and the price of a certain period in the past.
8. Chaikin Money Flow (CMF):
A variation of A/D that takes into account the daily price variation and weighs trading volume accordingly. Accumulation/Distribution (A/D) identifies buying and selling pressure by tracking the flow of money into and out of an asset based on volume patterns.
9. On-Balance Volume (OBV):
Identify divergences between trading volume and an asset's price.
Sum of trading volume when the price rises and subtracts volume when the price falls.
10. Money Flow Index (MFI):
Measures volume pressure in a range of 0 to 100.
Calculates the ratio of volume when the price goes up and when the price goes down.
11. Volume Oscillator (VO):
Identify divergences between trading volume and an asset's price. Ratio of change of volume, from a fast period in relation to a long period.
12. Price-Volume Trend (PVT):
Identify the strength of an asset's price trend based on its trading volume. Cumulative change in price with volume factor. The PVT calculation is similar to the OBV calculation, but it takes into account the percentage price change multiplied by the current volume, plus the previous PVT value.
13. Ultimate Oscillator (UO):
Combines three different time periods to help identify possible reversal points.
14. Fisher Transform (FT):
Normalize prices into a Gaussian normal distribution.
15. Z-Score/T-Score: Shows the difference between the current price and the price a few periods ago. I is a statistical measurement that indicates how many standard deviations a data point is from the mean of a data set.
When to use t-score instead of z-score? When the sample size is small (length < 30).
Here, the use of z-score or t-score is chosen automatically based on the length parameter.
█ What to look for
The operation is simple. The script checks for divergences between the price and the selected indicators.
Now with the possibility of using multiple symbols, it is possible to check divergences between different assets.
A well-described view on divergences can be found in this cheat sheet:
◈ Examples with SPY ETF versus indicators:
1. Regular bullish divergence with external indicator:
1. Regular bearish divergence with Fisher Transform:
1. Positive hidden divergence with Momentum indicator:
1. Negative hidden divergence with RSI:
◈ Examples with SPY ETF versus other symbols:
1. Regular bearish divergence with European Stoch Market:
2. Regular bearish divergence with DXY inverted:
3. Regular bullish divergence with Taiwan Dollar:
4. Regular bearish divergence with US10Y (10-Year US Treasury Note):
5. Regular bullish divergence with QQQ ETF (Nasdaq 100):
6. Regular bullish divergence with ARKK ETF (ARK Innovation):
7.Positive hidden divergence with RSP ETF (S&P 500 Equal Weight):
8. Negative hidden divergence with EWZ ETF (Brazil):
◈ Examples with BTCUSD versus other symbols:
1. Regular bearish divergence with BTCUSDLONGS from Bitfinex:
2. Regular bearish divergence with BLOK ETF (Amplify Transformational Data Sharing):
3. Negative hidden divergence with NATGAS (Natural Gas):
4. Positive hidden divergence with TOTALDEFI (Total DeFi Market Cap):
█ Conclusion
The symbols available to check divergences were chosen in such a way as to cover the main markets, in the most generic way possible.
You can adjust them according to your needs.
A trader in the American market, for example, could add more ETFs, American stocks, and sectoral indices, such as the XLF (Financial Select Sector SPDR Fund), the XLK (Technology Select Sector SPDR), etc.
On the other hand, a cryptocurrency trader could add more currency pairs and sector indicators, such as BTCUSDSHORTS (Bitfinex), USDT.D (Tether Dominance), etc.
If the chart becomes too cluttered, you can use the option to show only the number of divergences or only the indicator abbreviations.
Or even disable certain indicators and symbols, if they are not of interest to you.
I hope this script is useful.
Don't forget to support LonesomeTheBlue's work too.

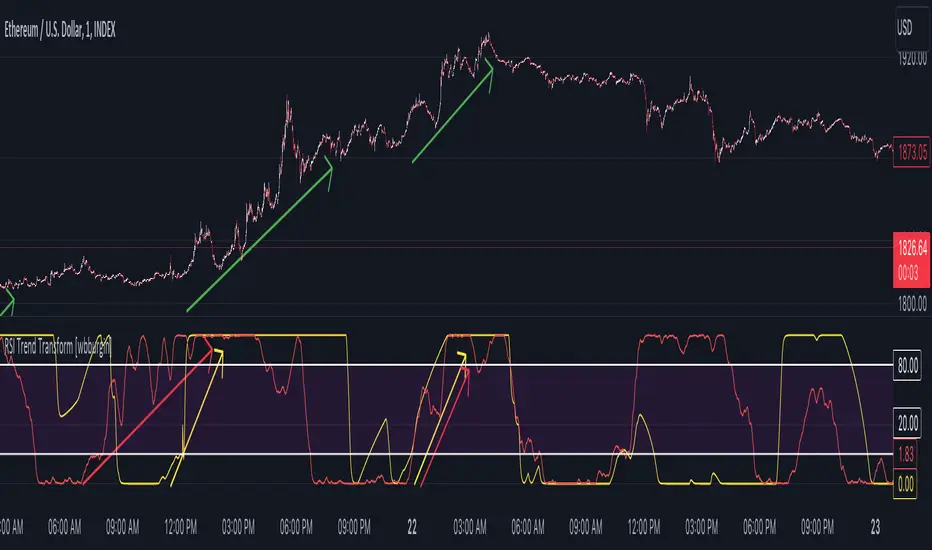
RSI Trend Transform [wbburgin]The RSI Trend Transform indicator is a dual-concept indicator that transforms volume data and price data into two different RSI values, which can then be used together to determine trend strength and momentum. The volume RSI does not use any price data in its calculation - it is purely a transform from nondirectional volume into a directional indicator.
The RSI for all three RSI values (price, volume,combined average) can be plotted as either stochastic or normal. The RSI calculation is adapted for use on volume, which is why the normal ta.rsi() function is not used for the price RSI calculation; both use the same formula for indicator consistency.
How to Use the Indicator
In the examples below, the Price RSI is plotted in yellow and the Volume RSI is plotted in red (length = 200, which is why the indicator is large in these examples). The indicator can be used on any timeframe and any asset, provided volume data is provided by the vendor to TradingView.
Identifying Bullish Trends
A rising volume RSI with a rising price RSI signifies a bullish trend. Example 1:
Example 2:
You can use the combined RSI (the average of the volume RSI and the price RSI) to help with the identification of these trends:
Identifying Bearish Trends
A falling volume RSI with a falling price RSI signifies a bearish trend:
Example 2:
Settings
Source is the source of the price RSI, the volume RSI will by default use volume in its calculations. If you have other indicators on-chart, you could even use the ATR, a volatility indicator, or any nondirectional or directional indicator and transform it into the "price" RSI.
Length is both the length of the RSI and the stochastic.
The next three rows are for each RSI you can plot on the indicator: price RSI, volume RSI, and combined RSI (average of price and volume). The first checkbox plots/removes them from the chart, you can subsequently choose the type of RSI (regular or stochastic), the color of the plot, and the length of the EMA smoothing applied afterward to the plot.
Upper Band and Lower Band refer to the overbought and oversold lines, respectively.
A note about the combined RSI- you will be unable to spot divergences if the combined RSI is the only plot on the indicator, so I encourage you to use the combined RSI as a way to confirm the overall trend if you notice the price RSI and the volume RSI and trending similarly.
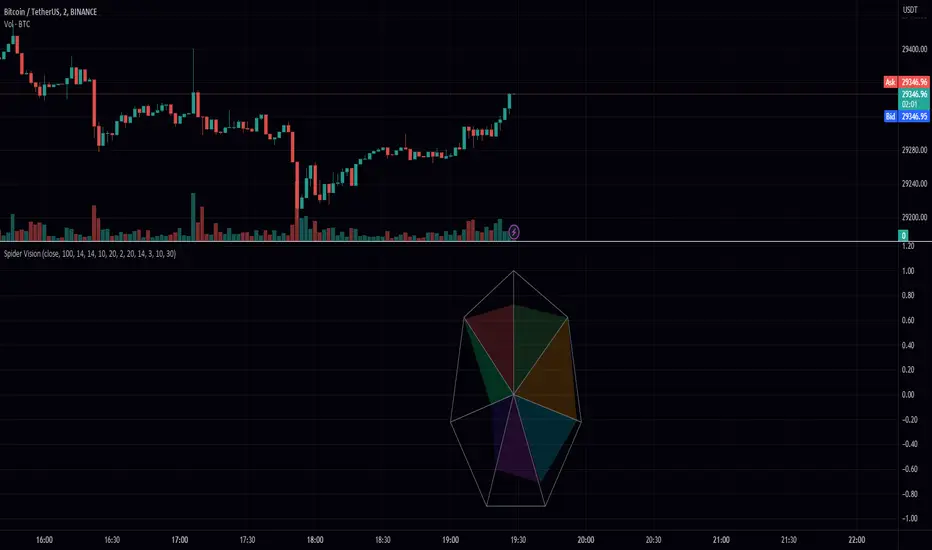
Spider VisionSpider Vision is an indicator that I created for trading view, which consists of a spider chart with 7 indicators built into it. This chart provides a visual representation of how these indicators are behaving, allowing traders to quickly assess the current market conditions.
The chart displays the following indicators:
RSI (Relative Strength Index): This is a momentum indicator that measures the strength of a security's price action. When the RSI is above 70, it is considered overbought, and when it is below 30, it is considered oversold.
Stochastic: This is another momentum indicator that compares the closing price of a security to its price range over a given time period. When the stochastic is above 80, it is considered overbought, and when it is below 20, it is considered oversold.
Momentum: This is a simple indicator that measures the change in a security's price over a given time period. When the momentum is positive, it indicates that the price is increasing, and when it is negative, it indicates that the price is decreasing.
BBW (Bollinger Bands Width): This indicator measures the width of the Bollinger Bands, which are a popular technical analysis tool used to identify potential trends and reversals. When the BBW is high, it suggests that the market is volatile, and when it is low, it suggests that the market is quiet.
DTO (Detrended Price Oscillator): This indicator measures the difference between the price of a security and its moving average. When the DTO is positive, it indicates that the price is above its moving average, and when it is negative, it indicates that the price is below its moving average.
Chop Zone: This indicator measures the choppiness of the market by comparing the average true range (ATR) to the difference between the high and low prices over a given time period. When the chop zone is high, it suggests that the market is choppy, and when it is low, it suggests that the market is trending.
Chaikin Oscillator: This is an oscillator that measures the accumulation/distribution of a security. When the Chaikin Oscillator is positive, it indicates that there is buying pressure in the market, and when it is negative, it indicates that there is selling pressure.
To use this indicator, traders can simply add it to their TradingView chart and adjust the input parameters to suit their trading style. The scale parameter can be used to adjust the size of the spider chart, while the color parameters can be used to customize the appearance of the chart. Traders can also adjust the length of each indicator to suit their preference.
Overall, the Spider Vision indicator provides a convenient way for traders to quickly assess the current market conditions and make more informed trading decisions.
Sniffer
╭━━━╮╱╱╱╱╭━╮╭━╮
┃╭━╮┃╱╱╱╱┃╭╯┃╭╯
┃╰━━┳━╮╭┳╯╰┳╯╰┳━━┳━╮
╰━━╮┃╭╮╋╋╮╭┻╮╭┫┃━┫╭╯
┃╰━╯┃┃┃┃┃┃┃╱┃┃┃┃━┫┃
╰━━━┻╯╰┻╯╰╯╱╰╯╰━━┻╯
Overview
A vast majority of modern data analysis & modelling techniques rely upon the idea of hidden patterns, wether it is some type of visualisation tool or some form of a complex machine learning algorithm, the one thing that they have in common is the belief, that patterns tell us what’s hidden behind plain numbers. The same philosophy has been adopted by many traders & investors worldwide, there’s an entire school of thought that operates purely based on chart patterns. This is where Sniffer comes in, it is a tool designed to simplify & quantify the job of pattern recognition on any given price chart, by combining various factors & techniques that generate high-quality results.
This tool analyses bars selected by the user, and highlights bar clusters on the chart that exhibit similar behaviour across multiple dimensions. It can detect a single candle pattern like hammers or dojis, or it can handle multiple candles like morning/evening stars or double tops/bottoms, and many more. In fact, the tool is completely independent of such specific candle formations, instead, it works on the idea of vector similarity and generates a degree of similarity for every single combination of candles. Only the top-n matches are highlighted, users get to choose which patterns they want to analyse and to what degree, by customising the feature-space.
Background
In the world of trading, a common use-case is to scan a price chart for some specific candlestick formations & price structures, and then the chart is further analysed in reference to these events. Traders are often trying to answer questions like, when was the last time price showed similar behaviour, what are the instances similar to what price is doing right now, what happens when price forms a pattern like this, what were some of other indicators doing when this happened last(RSI, CCI, ADX etc), and many other abstract ideas to have a stronger confluence or to confirm a bias.Having such a context can be vital in making better informed decisions, but doing this manually on a chart that has thousands of candles can have many disadvantages. It’s tedious, human errors are rather likely, and even if it’s done with pin-point accuracy, chances are that we’ll miss out on many pieces of information. This is the thought that gave birth to Sniffer .
Sniffer tries to provide a general solution for pattern-based analysis by deploying vector-similarity computation techniques, that cover the full-breadth of a price chart and generate a list of top-n matches based on the criteria selected by the user. Most of these techniques come from the data science space, where vector similarity is often implemented to solve classification & clustering problems. Sniffer uses same principles of vector comparison, and computes a degree of similarity for every single candle formation within the selected range, and as a result generates a similarity matrix that captures how similar or dissimilar a set of candles is to the input set selected by the user.
How It Works
A brief overview of how the tool is implemented:
- Every bar is processed, and a set of features are mapped to it.
- Bars selected by the user are captured, and saved for later use.
- Once the all the bars have been processed, candles are back-tracked and degree of similarity is computed for every single bar(max-limit is 5000 bars).
- Degree of similarity is computed by comparing attributes like price range, candle breadth & volume etc.
- Similarity matrix is sorted and top-n results are highlighted on the chart through boxes of different colors.
A brief overview of the features space for bars:
- Range: Difference between high & low
- Body: Difference between close & open
- Volume: Traded volume for that candle
- Head: Upper wick for green candles & lower wick for red candles
- Tail: Lower wick for green candles & upper wick for red candles
- BTR: Body to Range ratio
- HTR: Head to Range ratio
- TTR: Tail to Range ratio
- HTB: Head to Body ratio
- TTB: Tail to Body ratio
- ROC: Rate of change for HL2 for four different periods
- RSI: Relative Strength Index
- CCI: Commodity Channel Index
- Stochastic: Stochastic Index
- ADX: DMI+, DMI- & ADX
A brief overview of how degree of similarity is calculated:
- Each bar set is compared to the inout bar set within the selected feature space
- Features are represented as vectors, and distance between the vectors is calculated
- Shorter the distance, greater the similarity
- Different distance calculation methods are available to choose from, such as Cosine, Euclidean, Lorentzian, Manhattan, & Pearson
- Each method is likely to generate slightly different results, users are expected to select the method & the feature space that best fits their use-case
How To Use It
- Usage of this tool is relatively straightforward, users can add this indicator to their chart and similar clusters will be highlighted automatically
- Users need to select a time range that will be treated as input, and bars within that range become the input formation for similarity calculations
- Boxes will be draw around the clusters that fit the matching criteria
- Boxes are color-coded, green color boxes represent the top one-third of the top-n matches, yellow boxes represent the middle third, red boxes are for bottom third, and white box represents user-input
- Boxes colors will be adjusted as you adjust input parameters, such as number of matches or look-back period
User Settings
Users can configure the following options:
- Select the time-range to set input bars
- Select the look-back period, number of candles to backtrack for similarity search
- Select the number of top-n matches to show on the chart
- Select the method for similarity calculation
- Adjust the feature space, this enables addition of custom features, such as pattern recognition, technical indicators, rate of change etc
- Toggle verbosity, shows degree of similarity as a percentage value inside the box
Top Features
- Pattern Agnostic: Designed to work with variable number of candles & complex patterns
- Customisable Feature Space: Users get to add custom features to each bar
- Comprehensive Comparison: Generates a degree of similarity for all possible combinations
Final Note
- Similarity matches will be shown only within last 4500 bars.
- In theory, it is possible to compute similarity for any size candle formations, indicator has been tested with formations of 50+ candles, but it is recommended to select smaller range for faster & cleaner results.
- As you move to smaller time frames, selected time range will provide a larger number of candles as input, which can produce undesired results, it is advised to adjust your selection when you change time frames. Seeking suggestions on how to directly receive bars as user input, instead of time range.
- At times, users may see array index out of bound error when setting up this indicator, this generally happens when the input range is not properly configured. So, it should disappear after you select the input range, still trying to figure out where it is coming from, suggestions are welcome.
Credits
- @HeWhoMustNotBeNamed for publishing such a handy PineScript Logger, it certainly made the job a lot easier.

Bogdan Ciocoiu - Looking Glass► Description
The script shows a multi-timeline suite of information for the current ticker. This information refers to configurable moving averages, RSI, Stochastic RSI, VWAP and TSI data. The timeframes reflected in the script vary from 1m to 1h. I recommend the tool for 3m scalping as it provides good visibility upwards.
The headings from the table are:
{Close} - {MA1}
{Close} - {MA2}
{Close} - {MA3}
{MA1} - {MA2}
{MA2} - {MA3}
{RSI}
{Stoch RSI K}
{Stoch RSI D}
{VWAP}
{TSI}
{TSI EMA}
{TSI} - {TSI EMA}
► Originality and usefulness
This tool is helpful because it helps users read a chart much quicker than if they were to navigate between timeframes. The colour coding indicates an accident/descendant trend between any two values (i.e. close vs MA1, MA1-MA2, RSI K vs RSI D, etc.).
► Open-source reuse
www.tradingview.com
www.tradingview.com
www.tradingview.com
www.tradingview.com
www.tradingview.com
[JL] Cross CandlesI made Stoch candle yesterday, and want to compare other indicators.
So I code this one including 8 indicators on this version:
Stochastic Cross K and D
RSI Cross RSI and an average RSI
Moving Average Cross short and long
MACD Cross MACD and Signal
Stochastic RSI Cross K and D
DMI Cross Plus and minus
Parabolic SAR Cross close and sar
Super Trend Cross direction and 0
I personally like Stochastic, RSI and Stochastic RSI as they are less lagged.
Feel free to post suggestions about other indicators. I am happy to update it.

Green Dot with Lower BB TouchThis code is based on Dr. Wish's Green Dot indicator and all credits should go to him for this indicator. I have adapted the code described by Dr. Wish in his various blog posts and webinars.
This indicator involves Stochastics and Bollinger Band indicators to provide an indication when a technically sound stock is potentially oversold and reading to resume its uptrend. This is best used in Stage 2 (Weinstein) stocks viewed on a daily chart.
The green dot appears when the fast stochastic recently crosses over the slow stochastic at the oversold (OS) threshold.
The default values for this Stochastic are 10,4,4 with an oversold (OS) threshold of 50. You can add the built-in Stochastic indicator to check this out and have a better visual as to why this works.
An added enhancement is using Bollinger Bands, specifically when the price has crossed the lower band in the past 3 days. The also plays into the themes of stocks that are following an uptrend.
The default values for the Bollinger Band portion of the indicator is a length of 15 with a standard deviation of using the stock's closing price.
I have compared this indicator with the many examples from Dr. Wish's blog and feel free to do the same to make sure it is in agreement.
I welcome your feedback and any enhancements you may suggest.
Momentum Trader + Trinity LinesThis is an updated version of the 'Momentum Trader' by user ProfitProgrammers + the 'Bollinger Bands %b & RSI & Stochastic Smoothed Indicator & Alert' by the user Zamboniman.
Links to those original scripts are below:
script/7S49kLWh-Bollinger-Bands-b-RSI-Stochastic-Smoothed-Indicator-Alert/
script/OMULR9es-Momentum-Trader/
The only real updates are so that it works on Version 4 of pinescript and some color and visual updates that makes these two scripts work well together. This must be used on normal candles and not HA or any other types or you can get misleading entry / exit points.
Here is some info about this indicator and the moving parts within it:
Chande Momentum Oscillator:
-Measures trend strength, with higher absolute values meaning greater strength.
-Also tracks divergence. When price increases, but is not accompanied by an increase in Chande Momentum Oscillator values, it signifies bearish divergence and a reversal is likely to follow.
-Shown as the teal and pink histogram.
Percentage Price Oscillator:
-Similar to the MACD , except that it expresses the difference between the two moving averages in terms of a percentage. This makes it a little easier to visualize.
-PPO values greater than zero indicate an uptrend, as that means the fast EMA is greater than the slow (and vice versa).
Trinity Lines:
-These 3 colored lines at the top are RSI + normalized Bollinger Band &b + normalized smoothed Stochastic.
-A confirmation entry for a long is when the lines are in the order from top to bottom of Green Yellow Red.
Entry and Exit Conditions:
Enter When:
1) Chande Momentum crosses over zero from negative to positive territory. AND
2) Chande Momentum is rising(positive slope). AND
3) Trinity lines are Green, Yellow, Red (Top to bottom)
Exit When:
1) Chande Momentum is greater than the upper line. AND
2) PPO has a negative slope. AND
3) Trinity lines are Red, Yellow, Green (Top to bottom)

Combo Strategy 123 Reversal & Ergodic TSI This is combo strategies for get a cumulative signal.
First strategy
This System was created from the Book "How I Tripled My Money In The
Futures Market" by Ulf Jensen, Page 183. This is reverse type of strategies.
The strategy buys at market, if close price is higher than the previous close
during 2 days and the meaning of 9-days Stochastic Slow Oscillator is lower than 50.
The strategy sells at market, if close price is lower than the previous close price
during 2 days and the meaning of 9-days Stochastic Fast Oscillator is higher than 50.
Second strategy
r - Length of first EMA smoothing of 1 day momentum 4
s - Length of second EMA smoothing of 1 day smoothing 8
u- Length of third EMA smoothing of 1 day momentum 6
Length of EMA signal line 3
Source of Ergotic TSI Close
This is one of the techniques described by William Blau in his book "Momentum,
Direction and Divergence" (1995). If you like to learn more, we advise you to
read this book. His book focuses on three key aspects of trading: momentum,
direction and divergence. Blau, who was an electrical engineer before becoming
a trader, thoroughly examines the relationship between price and momentum in
step-by-step examples. From this grounding, he then looks at the deficiencies
in other oscillators and introduces some innovative techniques, including a
fresh twist on Stochastics. On directional issues, he analyzes the intricacies
of ADX and offers a unique approach to help define trending and non-trending periods.
WARNING:
- For purpose educate only
- This script to change bars colors.

Combo Strategy 123 Reversal & Ergodic MDI This is combo strategies for get a cumulative signal.
First strategy
This System was created from the Book "How I Tripled My Money In The
Futures Market" by Ulf Jensen, Page 183. This is reverse type of strategies.
The strategy buys at market, if close price is higher than the previous close
during 2 days and the meaning of 9-days Stochastic Slow Oscillator is lower than 50.
The strategy sells at market, if close price is lower than the previous close price
during 2 days and the meaning of 9-days Stochastic Fast Oscillator is higher than 50.
Second strategy
This is one of the techniques described by William Blau in his book "Momentum,
Direction and Divergence" (1995). If you like to learn more, we advise you to
read this book. His book focuses on three key aspects of trading: momentum,
direction and divergence. Blau, who was an electrical engineer before becoming
a trader, thoroughly examines the relationship between price and momentum in
step-by-step examples. From this grounding, he then looks at the deficiencies
in other oscillators and introduces some innovative techniques, including a
fresh twist on Stochastics. On directional issues, he analyzes the intricacies
of ADX and offers a unique approach to help define trending and non-trending periods.
WARNING:
- For purpose educate only
- This script to change bars colors.