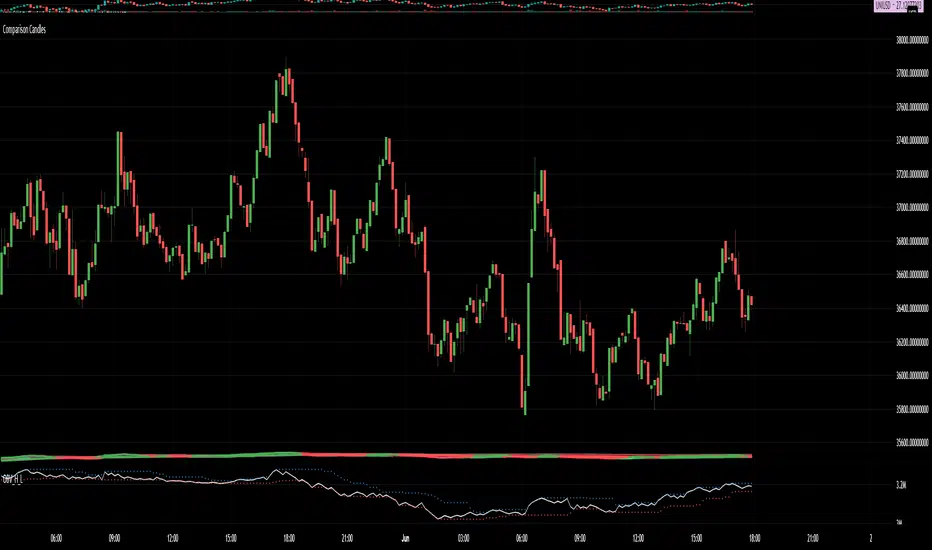
Comparison CandlesPretty simple. Pick a security and it plots candlesticks to compare it to the current chart.
So if looking at CAKEBTC and comparing to UNIBTC, you get CAKEUNI.
Beats the hell out of plotting multiple plots and trying to compare them. No longer is your scale based on where your zoom starts.
Also allows you to draw oscillators from the plots.
Shown is my Uber RSI plotted on the comparison candles close on CAKEUNI (binance both).
No longer struggle to chart against messed up uniswap charts because your exchange of choice isn't listed on tradingview.
No longer struggle to chart ethereum pairs that don't exist on any of the exchanges supported officially by Tradingview charting.
"You just win."
Cerca negli script per "tradingview+金龙指数"
Strategy - DMI Indicator with DPO Indicator as a GuardThe Directional Movement Index Indicator is one of my favorite indicators in tradingview's built-in library. It is free to use for all
For more information on what the DMI is, please visit: www.tradingview.com
The only problem I've come across with the DMI is that when it hits a 'trade range zone' it triggers false new trends (this is the case with almost every indicator I've ever tested).
This script modifies the DMI by removing the need for the ADX logic. It only focuses on the +DI and the -DI.
In order to remove the 'noise' generated during a trade range zone I have added another powerful indicator called the Detrended Price Oscillator.
The DPO is also a 'built-in' indicator on tradingview. www.tradingview.com
The DPO is used in conjunction with the DMI to stop trade ranges from wrecking your profits.
This strategy logic simply checks for the DMI indicator to cross itself. If the +DI crosses over the -DI this is a bullish cross and visa versa, if the -DI crosses over the +DI then it could mean bearish sentiment is building.
But then strategy logic uses the DPO to check if the DPO is above 0 or below 0 value
If the +DI crosses over the -DI and the DPO is above 0 value, then it's a Long entry point.
However, if the +DI crosses over the -DI and the DPO is below 0 value, then the Long signal is void.
And visa versa, if the -DI crosses over the +DI and the DPO is below 0 value, then it's a Short entry point (unless the DPO is greater than 0)
With this DPO 'guard' in place, it helps us keep the total trades executed to a minimum.
This is vital to push through trade ranges that can wreck your profit potential.
I wish I could create a better plotting mechanism for this indicator so you can better see the visuals. But combining the DMI to scale with the DPO is not possible.
The best solution is to simply add another DMI indicator to your chart so you can compare the DMI to this script that is dominated by the DPO (yellow line).
Enjoy! Likes are much appreciated!

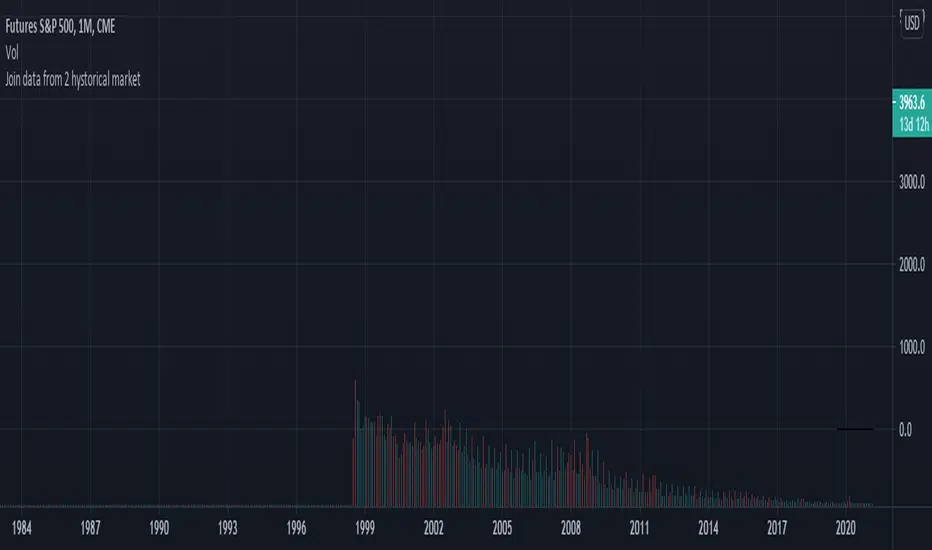
Join data and union of 2 hystorical markets
How to create a union from two contiguous Tradingview tickers (series)
Francesco Marzolo March 18, 2021
Go to the older ticker of the two, for example CME: SP1! and open it on Tradingview.
On the graph thus created, add this script.
In the indicator settings select the same ticker as the chart in Symbol1
while in Symbol2 the ticker from which to retrieve the most recent data, for example: SPX500
The operation this script does is examine each bar of the two tickers, where there is a value for the second it holds this one, where it does not exist in second ticker it keeps the value of the first one. This new series is called Merge. So now in the chart there will be 4 series:
- that of the original chart without script
- the same series loaded via script (Symbol1)
- series 2 of "new" data (Symbol2)
- the Merge series that "prefers" the Symbol2 data if present, otherwise it shows Symbol1
So now you have to change the visibility of the 4 series to see the differences:
- turn off the visibility of the chart indicator
- turn off the Symbol1 series in the script properties (old data only)
- switch off the Symbol2 series as well (only new data)
- switch on the Merge series (new data if existing, old if not present in the new ticker)
Let it snow... [QuantNomad]It's almost the end of 2020. If you don't have any snow outside but still you want some Christmas mood - feel free to use my indicator.
TradingView added a possibility to use up to 500 labels, so I decided to create something fun and completely useless.
Snowflakes suppose to fall nicely, but labels are not regularly updated by TradingView. If you know how to make it better - let me know )
For the best experience use Dark Theme and play the "Let it snow" song )
Merry Christmas & Happy New Year!

Bar Balance [LucF]Bar Balance extracts the number of up, down and neutral intrabars contained in each chart bar, revealing information on the strength of price movement. It can display stacked columns representing raw up/down/neutral intrabar counts, or an up/down balance line which can be calculated and visualized in many different ways.
WARNING: This is an analysis tool that works on historical bars only. It does not show any realtime information, and thus cannot be used to issue alerts or for automated trading. When realtime bars elapse, the indicator will require a browser refresh, a change to its Inputs or to the chart's timeframe/symbol to recalculate and display information on those elapsed bars. Once a trader understands this, the indicator can be used advantageously to make discretionary trading decisions.
Traders used to work with my Delta Volume Columns Pro will feel right at home in this indicator's Inputs . It has lots of options, allowing it to be used in many different ways. If you value the bar balance information this indicator mines, I hope you will find the time required to master the use of Bar Balance well worth the investment.
█ OVERVIEW
The indicator has two modes: Columns and Line .
Columns
• In Columns mode you can display stacked Up/Down/Neutral columns.
• The "Up" section represents the count of intrabars where `close > open`, "Down" where `close < open` and "Neutral" where `close = open`.
• The Up section always appears above the centerline, the Down section below. The Neutral section overlaps the centerline, split halfway above and below it.
The Up and Down sections start where the Neutral section ends, when there is one.
• The Up and Down sections can be colored independently using 7 different methods.
• The signal line plotted in Line mode can also be displayed in Columns mode.
Line
• Displays a single balance line using a zero centerline.
• A variable number of independent methods can be used to calculate the line (6), determine its color (5), and color the fill (5).
You can thus evaluate the state of 3 different components with this single line.
• A "Divergence Levels" feature will use the line to automatically draw expanding levels on divergence events.
Features available in both modes
• The color of all components can be selected from 15 base colors, with 16 gradient levels used for each base color in the indicator's gradients.
• A zero line can show a 6-state aggregate value of the three main volume balance modes.
• The background can be colored using any of 5 different methods.
• Chart bars can be colored using 5 different methods.
• Divergence and large neutral count ratio events can be shown in either Columns or Line mode, calculated in one of 4 different methods.
• Markers on 6 different conditions can be displayed.
█ CONCEPTS
Intrabar inspection
Intrabar inspection means the indicator looks at lower timeframe bars ( intrabars ) making up a given chart bar to gather its information. If your chart is on a 1-hour timeframe and the intrabar resolution determined by the indicator is 5 minutes, then 12 intrabars will be analyzed for each chart bar and the count of up/down/neutral intrabars among those will be tallied.
Bar Balances and calculation methods
The indicator uses a variety of methods to evaluate bar balance and to derive other calculations from them:
1. Balance on Bar : Uses the relative importance of instant Up and Down counts on the bar.
2. Balance Averages : Uses the difference between the EMAs of Up and Down counts.
3. Balance Momentum : Starts by calculating, separately for both Up and Down counts, the difference between the same EMAs used in Balance Averages and an SMA of double the period used for the EMAs. These differences are then aggregated and finally, a bounded momentum of that aggregate is calculated using RSI.
4. Markers Bias : It sums the bull/bear occurrences of the four previous markers over a user-defined period (the default is 14).
5. Combined Balances : This is the aggregate of the instant bull/bear bias of the three main bar balances.
6. Dual Up/Down Averages : This is a display mode showing the EMA calculated for each of the Up and Down counts.
Interpretation of neutral intrabars
What do neutral intrabars mean? When price does not change during a bar, it can be because there is simply no interest in the market, or because of a perfect balance between buyers and sellers. The latter being more improbable, Bar Balance assumes that neutral bars reveal a lack of interest, which entails uncertainty. That is the reason why the option is provided to interpret ratios of neutral intrabars greater than 50% as divergences. It is also the rationale behind the option to dampen signal lines on the inverse ratio of neutral intrabars, so that zero intrabars do not affect the signal, and progressively larger proportions of neutral intrabars will reduce the signal's amplitude, as the balance calcs using the up/down counts lose significance. The impact of the dampening will vary with markets. Weaker markets such as cryptos will often contain greater numbers of neutral intrabars, so dampening the Line in that sector will have a greater impact than in more liquid markets.
█ FEATURES
1 — Columns
• While the size of the Up/Down columns always represents their respective importance on the bar, their coloring mode is independent. The default setup uses a standard coloring mode where the Up/Down columns over/under the zero line are always in the bull/bear color with a higher intensity for the winning side. Six other coloring modes allow you to pack more information in the columns. When choosing to color the top columns using a bull/bear gradient on Balance Averages, for example, you will end up with bull/bear colored tops. In order for the color of the bottom columns to continue to show the instant bar balance, you can then choose the "Up/Down Ratio on Bar — Dual Solid Colors" coloring mode to make those bars the color of the winning side for that bar.
• Line mode shows only the line, but Columns mode allows displaying the line along with it. If the scale of the line is different than that of the scale of the columns, the line will often appear flat. Traders may find even a flat line useful as its bull/bear colors will be easily distinguishable.
2 — Line
• The default setup for Line mode uses a calculation on "Balance Momentum", with a fill on the longer-term "Balance Averages" and a line color based on the "Markers Bias". With the background set on "Line vs Divergence Levels" and the zero line on the hard-coded "Combined Bar Balances", you have access to five distinct sources of information at a glance, to which you can add divergences, divergences levels and chart bar coloring. This provides powerful potential in displaying bar balance information.
• When no columns are displayed, Line mode can show the full scale of whichever line you choose to calculate because the columns' scale no longer interferes with the line's scale.
• Note that when "Balance on Bar" is selected, the Neutral count is also displayed as a ratio of the balance line. This is the only instance where the Neutral count is displayed in Line mode.
• The "Dual Up/Down Averages" is an exception as it displays two lines: one average for the Up counts and another for the Down counts. This mode will be most useful when Columns are also displayed, as it provides a reference for the top and bottom columns.
3 — Zero Line
The zero line can be colored using two methods, both based on the Combined Balances, i.e., the aggregate of the instant bull/bear bias of the three main bar balances.
• In "Six-state Dual Color Gradient" mode, a dot appears on every bar. Its color reflects the bull/bear state of the Combined Balances, and the dot's brightness reflects the tally of balance biases.
• In "Dual Solid Colors (All Bull/All Bear Only)" a dot only appears when all three balances are either bullish or bearish. The resulting pattern is identical to that of Marker 1.
4 — Divergences
• Divergences are displayed as a small circle at the top of the scale. Four different types of divergence events can be detected. Divergences occur whenever the bull/bear bias of the method used diverges with the bar's price direction.
• An option allows you to include in divergence events instances where the count of neutral intrabars exceeds 50% of the total intrabar count.
• The divergence levels are dynamic levels that automatically build from the line's values on divergence events. On consecutive divergences, the levels will expand, creating a channel. This implementation of the divergence levels corresponds to my view that divergences indicate anomalies, hesitations, points of uncertainty if you will. It excludes any association of a pre-determined bullish/bearish bias to divergences. Accordingly, the levels merely take note of divergence events and mark those points in time with levels. Traders then have a reference point from which they can evaluate further movement. The bull/bear/neutral colors used to plot the levels are also congruent with this view in that they are determined by price's position relative to the levels, which is how I think divergences can be put to the most effective use.
5 — Background
• The background can show a bull/bear gradient on four different calculations. You can adjust its brightness to make its visual importance proportional to how you use it in your analysis.
6 — Chart bars
• Chart bars can be colored using five different methods.
• You have the option of emptying the body of bars where volume does not increase, as does my TLD indicator, the idea behind this being that movement on bars where volume does not increase is less relevant.
7 — Intrabar Resolution
You can choose between three modes. Two of them are automatic and one is manual:
a) Fast, Longer history, Auto-Steps (~12 intrabars) : Optimized for speed and deeper history. Uses an average minimum of 12 intrabars.
b) More Precise, Shorter History Auto-Steps (~24 intrabars) : Uses finer intrabar resolution. It is slower and provides less history. Uses an average minimum of 24 intrabars.
c) Fixed : Uses the fixed resolution of your choice.
Auto-Steps calculations vary for 24/7 and conventional markets in order to achieve the proper target of minimum intrabars.
You can choose to view the intrabar resolution currently used to calculate delta volume. It is the default.
The proper selection of the intrabar resolution is important. It must achieve maximal granularity to produce precise results while not unduly slowing down calculations, or worse, causing runtime errors.
8 — Markers
Six markers are available:
1. Combined Balances Agreement : All three Bar Balances are either bullish or bearish.
2. Up or Down % Agrees With Bar : An up marker will appear when the percentage of up intrabars in an up chart bar is greater than the specified percentage. Conditions mirror to down bars.
3. Divergence confirmations By Price : One of the four types of balance calculations can be used to detect divergences with price. Confirmations occur when the bar following the divergence confirms the balance bias. Note that the divergence events used here do not include neutral intrabar events.
4. Balance Transitions : Bull/bear transitions of the selected balance.
5. Markers Bias Transitions : Bull/bear transitions of the Markers Bias.
6. Divergence Confirmations By Line : Marks points where the line first breaches a divergence level.
Markers appear when the condition is detected, without delay. Since nothing is plotted in realtime, markers do not appear on the realtime bar.
9 — Settings
• Two modes can be selected to dampen the line on the ratio of neutral intrabars.
• A distinct weight can be attributed to the count of the latter half of intrabars, on the assumption that later intrabars may be more important in determining the outcome of chart bars.
• Allows control over the periods of the different moving averages used in calculations.
• The default periods used for the various calculations define the following hierarchy from slow to fast:
Balance Averages: 50,
Balance Momentum: 20,
Dual Up/Down Averages: 20,
Marker Bias: 10.
█ LIMITATIONS
• This script uses a special characteristic of the `security()` function allowing the inspection of intrabars—which is not officially supported by TradingView.
• The method used does not work on the realtime bar—only on historical bars.
• The indicator only works on some chart resolutions: 3, 5, 10, 15 and 30 minutes, 1, 2, 4, 6, and 12 hours, 1 day, 1 week and 1 month. The script’s code can be modified to run on other resolutions, but chart resolutions must be divisible by the lower resolution used for intrabars and the stepping mechanism could require adaptation.
• When using the "Line vs Divergence Levels — Dual Color Gradient" color mode to fill the line, background or chart bars, keep in mind that a line calculation mode must be defined for it to work, as it determines gradients on the movement of the line relative to divergence levels. If the line is hidden, it will not work.
• When the difference between the chart’s resolution and the intrabar resolution is too great, runtime errors will occur. The Auto-Steps selection mechanisms should avoid this.
• Alerts do not work reliably when `security()` is used at intrabar resolutions. Accordingly, no alerts are configured in the indicator.
• The color model used in the indicator provides for fancy visuals that come at a price; when you change values in Inputs , it can take 20 seconds for the changes to materialize. Luckily, once your color setup is complete, the color model does not have a large performance impact, as in normal operation the `security()` calls will become the most important factor in determining response time. Also, once in a while a runtime error will occur when you change inputs. Just making another change will usually bring the indicator back up.
█ RAMBLINGS
Is this thing useful?
I'll let you decide. Bar Balance acts somewhat like an X-Ray on bars. The intrabars it analyzes are no secret; one can simply change the chart's resolution to see the same intrabars the indicator uses. What the indicator brings to traders is the precise count of up/down/neutral intrabars and, more importantly, the calculations it derives from them to present the information in a way that can make it easier to use in trading decisions.
How reliable is Bar Balance information?
By the same token that an up bar does not guarantee that more up bars will follow, future price movements cannot be inferred from the mere count of up/down/neutral intrabars. Price movement during any chart bar for which, let's say, 12 intrabars are analyzed, could be due to only one of those intrabars. One can thus easily see how only relying on bar balance information could be very misleading. The rationale behind Bar Balance is that when the information mined for multiple chart bars is aggregated, it can provide insight into the history behind chart bars, and thus some bias as to the strength of movements. An up chart bar where 11/12 intrabars are also up is assumed to be stronger than the same up bar where only 2/12 intrabars are up. This logic is not bulletproof, and sometimes Bar Balance will stray. Also, keep in mind that balance lines do not represent price momentum as RSI would. Bar Balance calculations have no idea where price is. Their perspective, like that of any historian, is very limited, constrained that it is to the narrow universe of up/down/neutral intrabar counts. You will thus see instances where price is moving up while Balance Momentum, for example, is moving down. When Bar Balance performs as intended, this indicates that the rally is weakening, which does necessarily imply that price will reverse. Occasionally, price will merrily continue to advance on weakening strength.
Divergences
Most of the divergence detection methods used here rely on a difference between the bias of a calculation involving a multi-bar average and a given bar's price direction. When using "Bar Balance on Bar" however, only the bar's balance and price movement are used. This is the default mode.
As usual, divergences are points of interest because they reveal imbalances, which may or may not become turning points. I do not share the overwhelming enthusiasm traders have for the purported ability of bullish/bearish divergences to indicate imminent reversals.
Superfluity
In "The Bed of Procrustes", Nassim Nicholas Taleb writes: To bankrupt a fool, give him information . Bar Balance can display lots of information. While learning to use a new indicator inevitably requires an adaptation period where we put it through its paces and try out all its options, once you have become used to Bar Balance and decide to adopt it, rigorously eliminate the components you don't use and configure the remaining ones so their visual prominence reflects their relative importance in your analysis. I tried to provide flexible options for traders to control this indicator's visuals for that exact reason—not for window dressing.
█ NOTES
For traders
• To avoid misleading traders who don't read script descriptions, the indicator shows nothing in the realtime bar.
• The Data Window shows key values for the indicator.
• All gradients used in this indicator determine their brightness intensities using advances/declines in the signal—not their relative position in a fixed scale.
• Note that because of the way gradients are optimized internally, changing their brightness will sometimes require bringing down the value a few steps before you see an impact.
• Because this indicator does not use volume, it will work on all markets.
For coders
• For those interested in gradients, this script uses an advanced version of the Advance/Decline gradient function from the PineCoders Color Gradient (16 colors) Framework . It allows more precise control over the range, steps and min/max values of the gradients.
• I use the PineCoders Coding Conventions for Pine to write my scripts.
• I used functions modified from the PineCoders MTF Selection Framework for the selection of timeframes.
█ THANKS TO:
— alexgrover who helped me think through the dampening method used to attenuate signal lines on high ratios of neutral intrabars.
— A guy called Kuan who commented on a Backtest Rookies presentation of their Volume Profile indicator . The technique I use to inspect intrabars is derived from Kuan's code.
— theheirophant , my partner in the exploration of the sometimes weird abysses of `security()`’s behavior at intrabar resolutions.
— midtownsk8rguy , my brilliant companion in mining the depths of Pine graphics. He is also the co-author of the PineCoders Color Gradient Frameworks .

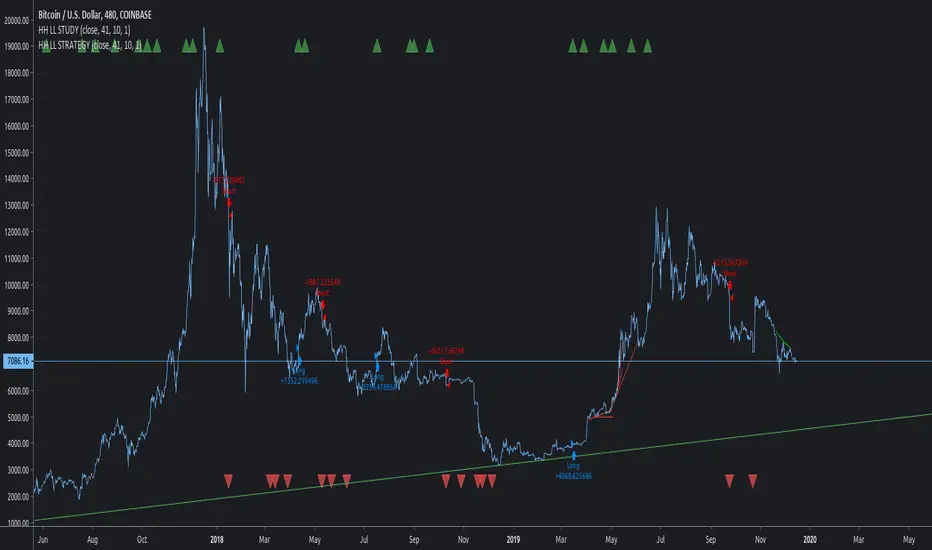
HIGHER HIGH LOWER LOW STRATEGYThis is my favorite for Tradingview.
Please use other indicators to find good entry and good exit. This is why this publication has so many indicators. A good indicator will find good results even on line chart. Feel free to try on "Heiken Ashi" but understand that "line" chart is much more realistic
Due to tradingview's crappy auto resize, the best way to view this script is to click on the share button and "Make it Mine".
Then you can see why my other indicators are "PRESENT"
Cheers!!!
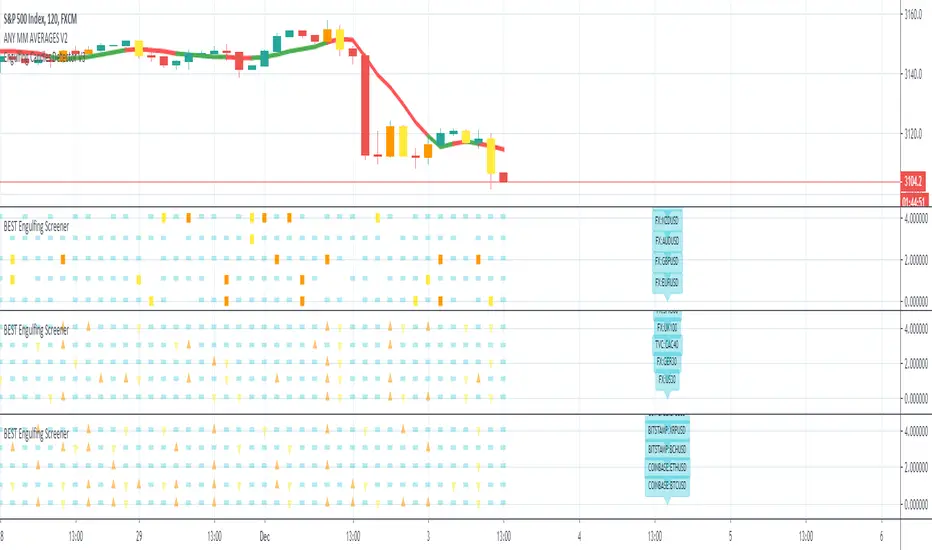
BEST Ultimate Engulfing ScreenerHello traders
Continuing deeper and stronger with the screeners serie. I keep getting requests private messages and requests saying that screeners aren't possible with TradingView.
My answer is always... "Reallyyy ??" (I never find a better answer than that...)
I'll publish a few screeners just for everyone to understand what can be done with Pinescript. We don't have to wait for TradingView to allow screener based on custom indicator - we can build our own ^^
I - What is an engulfing pattern
Let's start with a screener to check for a very famous candlestick pattern called engulfing
Engulfing candles tend to signal a reversal of the current trend in the market. This specific pattern involves two candles with the latter candle ‘engulfing’ the entire body of the candle before it.
The engulfing candle can be bullish or bearish depending on where it forms in relation to the existing trend
Source and more info here
These engulfing candles indicate a strong shift in direction, and when combined with observation of the price-trending direction that precedes it, this shift creates the opportunity for a trading strategy.
II - How did I set the screener
I added an optional filter being Price vs SMA. The idea is to select only the engulfing whenever the price also breaks an SMA - this usually translates a stronger move - but could sometimes give the signal too late (#meh #trading #ain't #easy)
The visual signals are as follow:
- square: whenever the engine detects an engulfing and an SMA breakout
- triangle: the engine only detects an engulfing
- dash: none of the above
Then the colors are:
- orange when bullish
- yellow when bearish
- aqua/dash when none of the above
Cool Hacks
"But sir... what can we do with only 5 instruments for a screener?" I agree not much but...
even if I allow only 5 instruments per indicator - nothing prevents you from adding multiple times the same indicator and changing the selected instruments for each. I also show why the SPX500 gave a yellow triangle (bearish engulfing) and how to match it with the screener.
=> imgur.com
Wishing you all the BEST trading
Dave
Crypto Multi Exchange Volume (CMEV)Crypto Multi Exchange Volume (CMEV) aggregates and plots trading volumes for supported cryptoasset pairs over multiple different cryptoasset exchanges. For developers looking for more information and for those who want to compile their own version of CMEV, please check out my GitHub (jakobpredin/crypto-multi-exchange-volume).
Configuration
CMEV comes with two configurable settings - whether base volume or quote volume is plotted and the length of the volume's EMA. By default, the base volume is used for plotting and the length of the EMA is set to 12 periods.
Use cases
The indicator was primarily developed in order to be able to chart using the trading pair with the longest available trading history. Due to the fast-changing preferences of where cryptoassets are traded, volumes tend to be very inconsistent and can give a distorted picture of a pairs history. For illustration, check out the SC-BTC pair from Poloniex using their native volume and compare it to the CMEV volume.
The other use case is to be able to spot divergences in volume. A great example here is bitcoin's 2019 rally where volumes from derivatives exchanges are at all time highs but volumes from retail/spot exchanges are not.
Supported exchanges
CMEV currently supports asset pairs from the following exchanges:
Binance
Bitfinex
Bitstamp
Bittrex
Coinbase
Gemini
Kraken
Poloniex
Limitations
Because of the fact that CMEV is pulling data from from multiple different exchanges and is computationally intensive it can take a couple of seconds to load while charting certain cryptoasset pairs.
Additionally, due to Tradingview's various limitations only a certain number of pairs can be supported at a time. By default, only pairs with a BTC or USD quote are supported and many non-unique pairs with consistently low trading volumes have been removed. For a full explanation, please refer to the docs in my GitHub (jakobpredin/crypto-multi-exchange-volume).
Future of the project
I plan on supporting pairs from more exchanges in the future as I see fit and as they become available for charting on Tradingview. Further, I may develop a strategy script using CMEV as its core indicator.
I welcome everybody from the community to help me extend the functionality of CMEV in order to make investing in cryptoassets more transparent for everybody.

Volume Profile Free Ultra SLI (100 Levels Value Area VWAP) - RRBVolume Profile Free Ultra SLI by RagingRocketBull 2019
Version 1.0
This indicator calculates Volume Profile for a given range and shows it as a histogram consisting of 100 horizontal bars.
This is basically the MAX SLI version with +50 more Pinescript v4 line objects added as levels.
It can also show Point of Control (POC), Developing POC, Value Area/VWAP StdDev High/Low as dynamically moving levels.
Free accounts can't access Standard TradingView Volume Profile, hence this indicator.
There are several versions: Free Pro, Free MAX SLI, Free Ultra SLI, Free History. This is the Free Ultra SLI version. The Differences are listed below:
- Free Pro: 25 levels, +Developing POC, Value Area/VWAP High/Low Levels, Above/Below Area Dimming
- Free MAX SLI: 50 levels, 2x SLI modes for Buy/Sell or even higher res 150 levels
- Free Ultra SLI: 100 levels, packed to the limit, 2x SLI modes for Buy/Sell or even higher res 300 levels
- Free History: auto highest/lowest, historic poc/va levels for each session
Features:
- High-Res Volume Profile with up to 100 levels (line implementation)
- 2x SLI modes for even higher res: 300 levels with 3x vertical SLI, 100 buy/sell levels with 2x horiz SLI
- Calculate Volume Profile on full history
- POC, Developing POC Levels
- Buy/Sell/Total volume modes
- Side Cover
- Value Area, VAH/VAL dynamic levels
- VWAP High/Low dynamic levels with Source, Length, StdDev as params
- Show/Hide all levels
- Dim Non Value Area Zones
- Custom Range with Highlighting
- 3 Anchor points for Volume Profile
- Flip Levels Horizontally
- Adjustable width, offset and spacing of levels
- Custom Color for POC/VA/VWAP levels, Transparency for buy/sell levels
WARNING:
- Compilation Time: 1 min 20 sec
Usage:
- specify max_level/min_level/spacing (required)
- select range (start_bar, range length), confirm with range highlighting
- select volume type: Buy/Sell/Total
- select mode Value Area/VWAP to show corresponding levels
- flip/select anchor point to position the buy/sell levels
- use Horiz Buy/Sell SLI mode with 100 or Vertical SLI with 300 levels if needed
- use POC/Developing POC/VA/VWAP High/Low as S/R levels. Usually daily values from 1-3 days back are used as levels for the current day.
SLI:
use SLI modes to extend the functionality of the indicator:
- Horiz Buy/Sell 2x SLI lets you view 100 Buy/Sell Levels at the same time
- Vertical Max_Vol 3x SLI lets you increase the resolution to 300 levels
- you need at least 2 instances of the indicator attached to the same chart for SLI to work
1) Enable Horiz SLI:
- attach 2 indicator instances to the chart
- make sure all instances have the same min_level/max_level/range/spacing settings
- select volume type for each instance: you can have a buy/sell or buy/total or sell/total SLI. Make sure your buy volume instance is the last attached to be displayed on top of sell/total instances without overlapping.
- set buy_sell_sli_mode to true for indicator instances with volume_type = buy/sell, for type total this is optional.
- this basically tells the script to calculate % lengths based on total volume instead of individual buy/sell volumes and use ext offset for sell levels
- Sell Offset is calculated relative to Buy Offset to stack/extend sell after buy. Buy Offset = Zero - Buy Length. Sell Offset = Buy Offset - Sell Length = Zero - Buy Length - Sell Length
- there are no master/slave instances in this mode, all indicators are equal, poc/va levels are not affected and can work independently, i.e. one instance can show va levels, another - vwap.
2) Enable Vertical SLI:
- attach the first instance and evaluate the full range to roughly determine where is the highest max_vol/poc level i.e. 0..20000, poc is in the bottom half (third, middle etc) or
- add more instances and split the full vertical range between them, i.e. set min_level/max_level of each corresponding instance to 0..10000, 10000..20000 etc
- make sure all instances have the same range/spacing settings
- an instance with a subrange containing the poc level of the full range is now your master instance (bottom half). All other instances are slaves, their levels will be calculated based on the max_vol/poc of the master instance instead of local values
- set show_max_vol_sli to true for the master instance. for slave instances this is optional and can be used to check if master/slave max_vol values match and slave can read the master's value. This simply plots the max_vol value
- you can also attach all instances and set show_max_vol_sli to true in all of them - the instance with the largest max_vol should become the master
Auto/Manual Ext Max_Vol Modes:
- for auto vertical max_vol SLI mode set max_vol_sli_src in all slave instances to the max_vol of the master indicator: "VolumeProfileFree_MAX_RRB: Max Volume for Vertical SLI Mode". It can be tricky with 2+ instances
- in case auto SLI mode doesn't work - assign max_vol_sli_ext in all slave instances the max_vol value of the master indicator manually and repeat on each change
- manual override max_vol_sli_ext has higher priority than auto max_vol_sli_src when both values are assigned, when they are 0 and close respectively - SLI is disabled
- master/slave max_vol values must match on each bar at all times to maintain proper level scale, otherwise slave's levels will look larger than they should relative to the master's levels.
- Max_vol (red) is the last param in the long list of indicator outputs
- the only true max_vol/poc in this SLI mode is the master's max_vol/poc. All poc/va levels in slaves will be irrelevant and are disabled automatically. Slaves can only show VWAP levels.
- VA Levels of the master instance in this SLI mode are calculated based on the subrange, not the whole range and may be inaccurate. Cross check with the full range.
WARNING!
- auto mode max_vol_sli_src is experimental and may not work as expected
- you can only assign auto mode max_vol_sli_src = max_vol once due to some bug with unhandled exception/buffer overflow in Tradingview. Seems that you can clear the value only by removing the indicator instance
- sometimes you may see a "study in error state" error when attempting to set it back to close. Remove indicator/Reload chart and start from scratch
- volume profile may not finish to redraw and freeze in an ugly shape after an UI parameter change when max_vol_sli_src is assigned a max_vol value. Assign it to close - VP should redraw properly, but it may not clear the assigned max_vol value
- you can't seem to be able to assign a proper auto max_vol value to the 3rd slave instance
- 2x Vertical SLI works and tested in both auto/manual, 3x SLI - only manual seems to work (you can have a mixed mode: 2nd instance - auto, 3rd - manual)
Notes:
- This code uses Pinescript v3 compatibility framework
- This code is 20x-30x faster (main for cycle is removed) especially on lower tfs with long history - only 4-5 sec load/redraw time vs 30-60 sec of the old Pro versions
- Instead of repeatedly calculating the total sum of volumes for the whole range on each bar, vol sums are now increased on each bar and passed to the next in the range making it a per range vs per bar calculation that reduces time dramatically
- 100 levels consist of 50 main plot levels and 50 line objects used as alternate levels, differences are:
- line objects are always shown on top of other objects, such as plot levels, zero line and side cover, it's not possible to cover/move them below.
- all line objects have variable lengths, use actual x,y coords and don't need side cover, while all plot levels have a fixed length of 100 bars, use offset and require cover.
- all key properties of line objects, such as x,y coords, color can be modified, objects can be moved/deleted, while this is not possible for static plot levels.
- large width values cause line objects to expand only up/down from center while their length remains the same and stays within the level's start/end points similar to an area style.
- large width values make plot levels expand in all directions (both h/v), beyond level start/end points, sometimes overlapping zero line, making them an inaccurate % length representation, as opposed to line objects/plot levels with area style.
- large width values translate into different widths on screen for line objects and plot levels.
- you can't compensate for this unwanted horiz width expansion of plot levels because width uses its own units, that don't translate into bars/pixels.
- line objects are visible only when num_levels > 50, plot levels are used otherwise
- Since line objects are lines, plot levels also use style line because other style implementations will break the symmetry/spacing between levels.
- if you don't see a volume profile check range settings: min_level/max_level and spacing, set spacing to 0 (or adjust accordingly based on the symbol's precision, i.e. 0.00001)
- you can view either of Buy/Sell/Total volumes, but you can't display Buy/Sell levels at the same time using a single instance (this would 2x reduce the number of levels). Use 2 indicator instances in horiz buy/sell sli mode for that.
- Volume Profile/Value Area are calculated for a given range and updated on each bar. Each level has a fixed length. Offsets control visible level parts. Side Cover hides the invisible parts.
- Custom Color for POC/VA/VWAP levels - UI Style color/transparency can only change shape's color and doesn't affect textcolor, hence this additional option
- Custom Width - UI Style supports only width <= 4, hence this additional option
- POC is visible in both modes. In VWAP mode Developing POC becomes VWAP, VA High and Low => VWAP High and Low correspondingly to minimize the number of plot outputs
- You can't change buy/sell level colors from input (only transparency) - this requires 2x plot outputs => 2x reduces the number of levels to fit the max 64 limit. That's why 2 additional plots are used to dim the non Value Area zones
- You can change level transparency of line objects. Due to Pinescript limitations, only discrete values are supported.
- Inverse transp correlation creates the necessary illusion of "covered" line objects, although they are shown on top of the cover all the time
- If custom lines_transp is set the illusion will break because transp range can't be skewed easily (i.e. transp 0..100 is always mapped to 100..0 and can't be mapped to 50..0)
- transparency can applied to lines dynamically but nva top zone can't be completely removed because plot/mixed type of levels are still used when num_levels < 50 and require cover
- transparency can't be applied to plot levels dynamically from script this can be done only once from UI, and you can't change plot color for the past length bars
- All buy/sell volume lengths are calculated as % of a fixed base width = 100 bars (100%). You can't set show_last from input to change it
- Range selection/Anchoring is not accurate on charts with time gaps since you can only anchor from a point in the future and measure distance in time periods, not actual bars, and there's no way of knowing the number of future gaps in advance.
- Adjust Width for Log Scale mode now also works on high precision charts with small prices (i.e. 0.00001)
- in Adjust Width for Log Scale mode Level1 width extremes can be capped using max deviation (when level1 = 0, shift = 0 width becomes infinite)
- There's no such thing as buy/sell volume, there's just volume, but for the purposes of the Volume Profile method, assume: bull candle = buy volume, bear candle = sell volume
P.S. I am your grandfather, Luke! Now, join the Dark Side in your father's steps or be destroyed! Once more the Sith will rule the Galaxy, and we shall have peace...

Volume Profile Free MAX SLI (50 Levels Value Area VWAP) by RRBVolume Profile Free MAX SLI by RagingRocketBull 2019
Version 1.0
All available Volume Profile Free MAX SLI versions are listed below (They are very similar and I don't want to publish them as separate indicators):
ver 1.0: style columns implementation
ver 2.0: style histogram implementation
ver 3.0: style line implementation
This indicator calculates Volume Profile for a given range and shows it as a histogram consisting of 50 horizontal bars.
It can also show Point of Control (POC), Developing POC, Value Area/VWAP StdDev High/Low as dynamically moving levels.
Free accounts can't access Standard TradingView Volume Profile, hence this indicator.
There are several versions: Free Pro, Free MAX SLI, Free History. This is the Free MAX SLI version. The Differences are listed below:
- Free Pro: 25 levels, +Developing POC, Value Area/VWAP High/Low Levels, Above/Below Area Dimming
- Free MAX SLI: 50 levels, packed to the limit, 2x SLI modes for Buy/Sell or even higher res 150 levels
- Free History: auto highest/lowest, historic poc/va levels for each session
Features:
- High-Res Volume Profile with up to 50 levels (3 implementations)
- 20-30x faster than the old Pro versions especially on lower tfs with long history
- 2x SLI modes for even higher res: 150 levels with 3x vertical SLI, 50 buy/sell levels with 2x horiz SLI
- Calculate Volume Profile on full history
- POC, Developing POC Levels
- Buy/Sell/Total volume modes
- Side Cover
- Value Area, VAH/VAL dynamic levels
- VWAP High/Low dynamic levels with Source, Length, StdDev as params
- Show/Hide all levels
- Dim Non Value Area Zones
- Custom Range with Highlighting
- 3 Anchor points for Volume Profile
- Flip Levels Horizontally
- Adjustable width, offset and spacing of levels
- Custom Color for POC/VA/VWAP levels and Transparency for buy/sell levels
Usage:
- specify max_level/min_level/spacing (required)
- select range (start_bar, range length), confirm with range highlighting
- select volume type: Buy/Sell/Total
- select mode Value Area/VWAP to show corresponding levels
- flip/select anchor point to position the buy/sell levels
- use Horiz SLI mode for 50 Buy/Sell or Vertical SLI for 150 levels if needed
- use POC/Developing POC/VA/VWAP High/Low as S/R levels. Usually daily values from 1-3 days back are used as levels for the current day.
SLI:
- use SLI modes to extend the functionality of the indicator:
- Horiz Buy/Sell 2x SLI lets you view 50 Buy/Sell Levels at the same time
- Vertical Max_Vol 3x SLI lets you increase the resolution to 150 levels
- you need at least 2 instances of the indicator attached to the same chart for SLI to work
1) Enable Horiz SLI:
- attach 2 indicator instances to the chart
- make sure all instances have the same min_level/max_level/range/spacing settings
- select volume type for each instance: you can have a buy/sell or buy/total or sell/total SLI. Make sure your buy volume instance is the last attached to be displayed on top of sell/total instances without overlapping.
- set buy_sell_sli_mode to true for indicator instances with volume_type = buy/sell, for type total this is optional.
- this basically tells the script to calculate % lengths based on total volume instead of individual buy/sell volumes and use ext offset for sell levels
- Sell Offset is calculated relative to Buy Offset to stack/extend sell after buy. Buy Offset = Zero - Buy Length. Sell Offset = Buy Offset - Sell Length = Zero - Buy Length - Sell Length
- there are no master/slave instances in this mode, all indicators are equal, poc/va levels are not affected and can work independently, i.e. one instance can show va levels, another - vwap.
2) Enable Vertical SLI:
- attach the first instance and evaluate the full range to roughly determine where is the highest max_vol/poc level i.e. 0..20000, poc is in the bottom half (third, middle etc) or
- add more instances and split the full vertical range between them, i.e. set min_level/max_level of each corresponding instance to 0..10000, 10000..20000 etc
- make sure all instances have the same range/spacing settings
- an instance with a subrange containing the poc level of the full range is now your master instance (bottom half). All other instances are slaves, their levels will be calculated based on the max_vol/poc of the master instance instead of local values
- set show_max_vol_sli to true for the master instance. for slave instances this is optional and can be used to check if master/slave max_vol values match and slave can read the master's value. This simply plots the max_vol value
- you can also attach all instances and set show_max_vol_sli to true in all of them - the instance with the largest max_vol should become the master
Auto/Manual Ext Max_Vol Modes:
- for auto vertical max_vol SLI mode set max_vol_sli_src in all slave instances to the max_vol of the master indicator: "VolumeProfileFree_MAX_RRB: Max Volume for Vertical SLI Mode". It can be tricky with 2+ instances
- in case auto SLI mode doesn't work - assign max_vol_sli_ext in all slave instances the max_vol value of the master indicator manually and repeat on each change
- manual override max_vol_sli_ext has higher priority than auto max_vol_sli_src when both values are assigned, when they are 0 and close respectively - SLI is disabled
- master/slave max_vol values must match on each bar at all times to maintain proper level scale, otherwise slave's levels will look larger than they should relative to the master's levels.
- Max_vol (red) is the last param in the long list of indicator outputs
- the only true max_vol/poc in this SLI mode is the master's max_vol/poc. All poc/va levels in slaves will be irrelevant and are disabled automatically. Slaves can only show VWAP levels.
- VA Levels of the master instance in this SLI mode are calculated based on the subrange, not the whole range. Cross check with the full range.
WARNING!
- auto mode max_vol_sli_src is experimental and may not work as expected
- you can only assign auto mode max_vol_sli_src = max_vol once due to some bug with unhandled exception/buffer overflow in Tradingview. Seems that you can clear the value only by removing the indicator instance
- sometimes you may see a "study in error state" error when attempting to set it back to close. Remove indicator/Reload chart and start from scratch
- volume profile may not finish to redraw and freeze in an ugly shape after an UI parameter change when max_vol_sli_src is assigned a max_vol value. Assign it to close - VP should redraw properly, but it may not clear the assigned max_vol value
- you can't seem to be able to assign a proper auto max_vol value to the 3rd slave instance
- 2x Vertical SLI works and tested in both auto/manual, 3x SLI - only manual seems to work
Notes:
- This code is 20x-30x faster (main for cycle is removed) especially on lower tfs with long history - only 2-3 sec load/redraw time vs 30-60 sec of the old Pro versions
- Instead of repeatedly calculating the total sum of volumes for the whole range on each bar, vol sums are now increased on each bar and passed to the next in the range making it a per range vs per bar calculation that reduces time dramatically
- hist_base for levels still results is ugly redraw
- if you don't see a volume profile check range settings: min_level/max_level and spacing, set spacing to 0 (or adjust accordingly based on the symbol's precision, i.e. 0.00001)
- you can view either of Buy/Sell/Total volumes, but you can't display Buy/Sell levels at the same time using a single instance (this would 2x reduce the number of levels). Use 2 indicator instances in horiz buy/sell sli mode for that.
- Volume Profile/Value Area are calculated for a given range and updated on each bar. Each level has a fixed length. Offsets control visible level parts. Side Cover hides the invisible parts.
- Custom Color for POC/VA/VWAP levels - UI Style color/transparency can only change shape's color and doesn't affect textcolor, hence this additional option
- Custom Width - UI Style supports only width <= 4, hence this additional option
- POC is visible in both modes. In VWAP mode Developing POC becomes VWAP, VA High and Low => VWAP High and Low correspondingly to minimize the number of plot outputs
- You can't change buy/sell level colors from input (only plot transparency) - this requires 2x plot outputs => 2x reduces the number of levels to fit the max 64 limit. That's why 2 additional plots are used to dim the non Value Area zones
- All buy/sell volume lengths are calculated as % of a fixed base width = 100 bars (100%). You can't set show_last from input to change it
- There's no such thing as buy/sell volume, there's just volume, but for the purposes of the Volume Profile method, assume: bull candle = buy volume, bear candle = sell volume
P.S. Gravitonium Levels Are Increasing. Unobtainium is nowhere to be found!
Links on Volume Profile and Value Area calculation and usage:
www.tradingview.com
stockcharts.com
onlinelibrary.wiley.com

Correlate 3 - Correlation IndicatorThe code in contains a simple correlation indicator that can be used as an alternative to Tradingview’s built-in “Correlation Coefficient” indicator. The indicator allows users to correlate up to 3 separate instruments on the same subplot. This allows you, for example, to easily see the correlation of your instrument with stocks, bonds and FX. Alternatively, a user can also see the correlation with sector, industry peers or any other data available in Tradingview.
Features
Level Guides to easily see the key correlation coefficient levels
Multi-instrument:

Wolfe Waves Signals [NXT2017] by the rules of Bill WolfeScript to find entries of Wolfe Wave Point 5 for Pinescript in Tradingview
Dear followers,
in my search for a good Wolfe Wave screener I havn't success. This is why I wrote my own script for find good Wolfe Waves entries for Pinescript in Tradingview.
The script calculate the relationsship between wave 4 (point 4 to point 5) and wave 3 (point 3 and point 4) in combination with the relationsship of wave 3 and wave 2 (point 2 to point 3). The first relationship should like the rules be 127.2 % and the second relationship 68.2% - but not every pattern join in this rule. This is why I give a little room to move around this values.
In one hand the higher the green peak, the longer and stronger the wave for buysetup and on the other hand the lower the red Peak, the longer and stronger the wave for sellsetup.
My skills didn't sufficient for show the lines of Wolfe Waves. If you have a modified version with lines with EPA and ETA Points, so please be so Kind to inform me.
Of course, not every signal is a good signal, so look to the rules of Bill Wolfe and on a perfect pattern be active.
At least I wish everyone a good tradingtime.

EMA EnvelopeThis is an attempt to convert gunbot's SG strategy into a proper TradingView strategy. The problem is that SG Sell Level relies on % above purchase price, which we don't actually know in TradingView. So we could try to get the average of the next bar or something, which maybe this is what the Slippage setting is? I'm not sure.
Anyways, using % above EMA does actually work as a strategy a bit. It's nothing like Turtle Rules by tmr0 though!
Will keep working on this gradually; feedback greatly appreciated!

CMC Macro Regime PanelOverview (what it is):
A macro‑regime gate built entirely from TradingView-native symbols (CRYPTOCAP, FRED, DXY/VIX, HYG/LQD). It aggregates central‑bank liquidity (Fed balance sheet − RRP − Treasury General Account), USD strength, credit conditions, stablecoin flows/dominance, tech beta and BTC–NDX co‑move into one normalized score (CLRC). The panel outputs Risk‑ON/OFF regimes, an Early 3/5 pre‑signal, and an automatic BTC vs ETH vs ALTs preference. It is intentionally scoped to Daily & Weekly reads (no intraday timing). Publish with a clean chart and a clear description as per TradingView rules.
TradingView
Why we also use other TradingView screens (and why that is compliant)
This script pulls data via request.security() from official TV symbols only; users often want to open the raw series on separate charts to sanity‑check:
CRYPTOCAP indices: TOTAL, TOTAL2, TOTAL3 (market cap aggregates) and dominance tickers like BTC.D, USDT.D. Helpful for regime & rotation (ALTs vs BTC). TradingView provides definitions for crypto market cap and dominance symbols.
TradingView
+3
TradingView
+3
TradingView
+3
FRED releases: WALCL (Fed assets, weekly), RRPONTSYD (ON RRP, daily), WTREGEN (TGA, weekly), M2SL (M2, monthly). These are the official macro sources exposed on TV.
FRED
+3
FRED
+3
FRED
+3
Risk proxies: TVC:DXY (USD index), TVC:VIX (implied vol), AMEX:HYG/AMEX:LQD (credit), NASDAQ:NDX (tech beta), BINANCE:ETHBTC. VIX/NDX relationship is well-documented; VIX measures 30‑day expected S&P500 vol.
TradingView
+2
TradingView
+2
Compliance note: Using multiple screens is optional for users, but it explains/justifies how components work together (a requirement for public scripts). Keep publication chart clean; use extra screens only to illustrate in the description.
TradingView
How it works (high level)
Liquidity block (Weekly/Monthly)
Net Liquidity = WALCL − RRPONTSYD − WTREGEN (YoY z‑score). WALCL is weekly (as of Wednesday) via H.4.1; RRP is daily; TGA is a Fed liability series. M2 YoY is monthly.
FRED
+3
FRED
+3
FRED
+3
Risk conditions (Daily)
DXY 3‑month momentum (inverted), VIX level (inverted), Credit (HYG/LQD ratio or HY OAS). VIX is a 30‑day constant‑maturity implied vol index per Cboe methodology.
Cboe
+1
Crypto‑internal (Daily)
Stablecoins (USDT+USDC+DAI 30‑day log change), USDT dominance (20‑day, inverted), TOTAL3 (63‑day momentum). Dominance symbols on TV follow a documented formula.
TradingView
Beta & co‑move (Daily)
NDX 63‑day momentum, BTC↔NDX 90‑day correlation.
All components become z‑scores (optionally clipped), weighted, missing inputs drop and weights renormalize. We never use lookahead; we confirm on bar close to avoid repainting per Pine docs (barstate.isconfirmed, multi‑TF).
TradingView
+2
TradingView
+2
What you see on the chart
White line (CLRC) = macro regime score.
Background: Green = Risk‑ON, Red = Risk‑OFF, Teal = Early 3/5 (pre‑signal).
Table: shows each component’s z‑score and the Preference: BTC / ETH / ALTs / Mixed.
Signals & interpretation
Designed for Daily (1D) and Weekly (1W) only.
Regime gates (default Fast preset):
Enter ON: CLRC ≥ +0.8; Hold ON while ≥ +0.5.
Enter OFF: CLRC ≤ −1.0; Hold OFF while ≤ −0.5.
0 / ±1 reading: CLRC is a standardized composite.
~0 = neutral baseline (no macro edge).
≥ +1 = strong macro tailwind (≈ +1σ).
≤ −1 = strong headwind (≈ −1σ).
Early 3/5 (teal): a fast pre‑signal when at least 3 of 5 daily checks align: USDT.D↓, DXY↓, VIX↓, HYG/LQD↑, ETHBTC↑ or TOTAL3↑. It often precedes a full ON flip—use for pre‑positioning rather than full sizing.
BTC/ETH/ALTs selector (only when ON):
ALTs when BTC.D↓ and (ETHBTC↑ or TOTAL3↑) ⇒ rotate down the risk curve.
BTC when BTC.D↑ and ETHBTC↓ ⇒ keep it concentrated.
ETH when ETHBTC↑ while BTC.D flat/up ⇒ add ETH beta.
(Dominance mechanics are documented by TV.)
TradingView
Dissonance (incompatibility) rules — when to stand down
Use these overrides to avoid false comfort:
CLRC > +1 but USDT.D↑ and/or VIX spikes day‑over‑day → downgrade to Neutral; wait for USDT.D to stabilize and VIX to cool (VIX is a fear gauge of 30‑day expectation).
Cboe Global Markets
CLRC > +1 but DXY↑ sharply (USD squeeze) → size below normal; require DXY momentum to roll over.
CLRC < −1 but Early 3/5 = true two days in a row → start reducing underweights; look for ON flip within a few bars.
NetLiq improving (W) but credit (HYG/LQD) deteriorating (D) → treat as mixed regime; prefer BTC over ALTs.
How to use (step‑by‑step)
A. Read on Daily (1D) — main regime
Open CRYPTOCAP:TOTAL3, 1D (panel applied).
Wait for bar close (use alerts on confirmed bar). Pine docs recommend barstate.isconfirmed to avoid repainting on realtime bars.
TradingView
If ON, check Preference (BTC / ETH / ALTs).
Then drop to 4H on your trading pair for micro entries (this indicator itself is not for intraday timing).
B. Confirm weekly macro (1W) — once per week)
Review WALCL/RRP/TGA after the H.4.1 release on Thursdays ~4:30 pm ET. WALCL is “Weekly, as of Wednesday”; M2 is Monthly—so do not expect daily responsiveness from these.
Federal Reserve
+2
FRED
+2
Recommended check times (practical schedule)
Daily regime read: right after your chart’s daily close (confirmed bar). For consistent timing across crypto, many users set chart timezone to UTC and read ~00:05 UTC; you can change chart timezone in TV’s settings.
TradingView
In‑day monitoring: optional spot checks 16:00 & 20:00 UTC (DXY/VIX move during US hours), but act only after the daily bar confirms.
Weekly macro pass: Thu 21:30–22:30 UTC (after H.4.1 4:30 pm ET) or Fri after daily close, to let weekly FRED series propagate.
Federal Reserve
Limitations & data latency (be explicit)
Higher‑TF data & confirmation: FRED weekly/monthly series will not reflect intraday risk in crypto; we aggregate them for regime, not for entry timing.
Repainting 101: Realtime bars move until close. This script does not use lookahead and follows Pine guidance on multi‑TF series; still, always act on confirmed bars.
TradingView
+1
Public‑library compliance: Title EN‑only; description starts in EN; clean chart; justify component mash‑up; no lookahead; no unrealistic claims.
TradingView
Alerts you can use
“Macro Risk‑ON (entry)” — fires on ON flip (confirmed bar).
“Macro Risk‑OFF (entry)” — fires on OFF flip.
“Early 3/5” — fires when the teal pre‑signal appears (not a regime flip).
“Preference change” — BTC/ETH/ALTs toggles while ON.
Publish note: Alerts are fine; just avoid implying guaranteed accuracy/performance.
TradingView
Background research (why these inputs matter)
Liquidity → Crypto: Fed H.4.1 timing and series definitions (WALCL, RRP, TGA) formalize the “net liquidity” concept used here.
FRED
+3
Federal Reserve
+3
FRED
+3
Stablecoins ↔ Non‑stable crypto: empirical work shows bi‑directional causality between stablecoin market cap and non‑stable crypto cap; stablecoin growth co‑moves with broader crypto activity.
Global liquidity link: world liquidity positively relates to total crypto market cap; lagged effects are observed at monthly horizons.
VIX/Uncertainty effect: fear shocks impair BTC’s “safe haven” behavior; VIX is a meaningful risk‑off read.

Advanced RSI — Mark 4 RSI was introduced by J. Welles Wilder Jr. in 1978 in New Concepts in Technical Trading Systems. It measures the velocity of gains vs. losses on a bounded 0–100 scale and popularized the 14-period lookback with 70/30 guide rails for overbought/oversold. Over time, traders added variations (different lengths, thresholds, smoothing, adaptive levels), but the core idea stayed the same: momentum turns often precede price turns.
and i initially started to make minor adjustments for personal use like changing the default to 17 , and using Tradingviews official RSI which comes with a MA embedded. but it was not enough. especially the visuals.
so, for this public release Mark 4 i enhanced RSI by incorporating :
1. Dual-Length Fusion
Two RSI periods (default 17 + 21) blended then lightly smoothed (TEMA by default) → steadier
line without dulling turns.
2. Adaptive OB/OS (ATR-aware) for fewer whipsaws.
3. OB/OS alt solution:
Brief yellow segments appear only at local extremes (default: >72 tops, <32 bottoms) to
emphasize exhaustion without repainting the whole line.
4. Signals you can actually see
Triangle markers for:
Bullish: RSI crossing up through adaptive OS (and still <40 at the cross).
Bearish: RSI crossing down through adaptive OB (and still >60 at the cross).
“Strong Bull/Bear” background nudges appear when momentum is pushing beyond the
bands.
Optional Divergence Tags
and
Tiny diamonds to flag potential bullish/bearish divergences (look-back based).
Info Table (can be hidden)
my Fav feature i included 5 colorways with modern themes.(pls check under INPUTS)
and i made all that to make the indicator visualization look awesome on high end displays.
Credits & acknowledgment
Inspired by the original RSI by J. Welles Wilder Jr. (1978).
Built to be modern, focused, and comfortable for long sessions—especially on dark/OLED displays.
THIS INDICATOR IS MORE THAN ENOUGH BUT I DO HAVE PRIVATE INDICATORS WITH DIFFERENT LOGIC FUNCTIONS.
I'm open for feedback/collaboration.
drsamc.

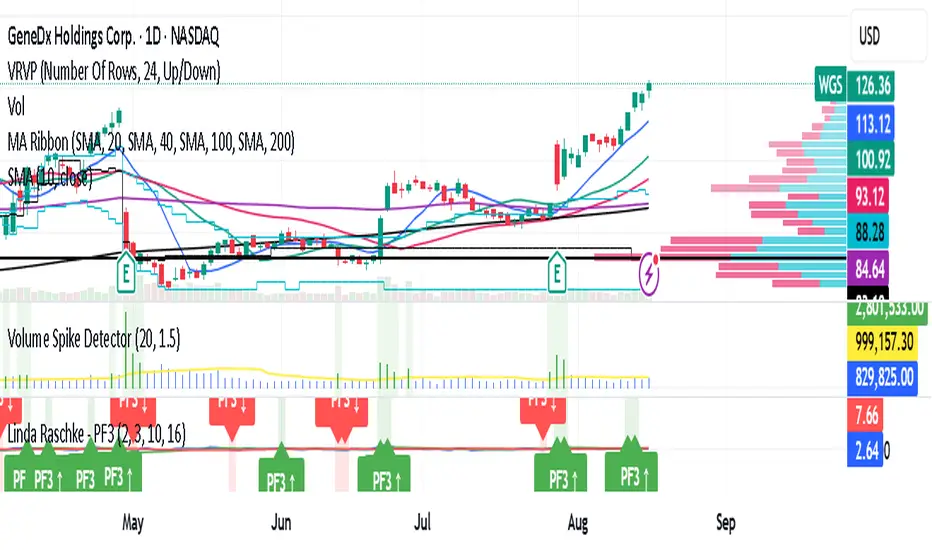
Volume Spike DetectorDetects a spike in Volume . based on volume on tradingviews. It highlights when volume is 1.5X of usual average
OB/OS adaptative v1.1# OB/OS Adaptative v1.1 - Multi-Timeframe Adaptive Overbought/Oversold Indicator
## Overview
The `tradingview_indicator_emas.pine` script is a sophisticated multi-timeframe indicator designed to identify dynamic overbought and oversold levels in financial markets. It combines EMA (Exponential Moving Average) crossovers and Bollinger Bands across monthly, weekly, and daily timeframes to create adaptive support and resistance levels that adjust to changing market conditions.
## Core Functionality
### Multi-Timeframe Analysis
The indicator analyzes three timeframes simultaneously:
- **Monthly (M)**: Long-term trend identification
- **Weekly (W)**: Intermediate-term trend identification
- **Daily (D)**: Short-term volatility measurement
### Technical Indicators Used
- **EMA 9 and EMA 20**: For trend identification and momentum assessment
- **Bollinger Bands (20-period)**: For volatility measurement and extreme level identification
- **Price action**: For confirmation of level validity and signal generation
## Key Features
### Adaptive Level Calculation
The indicator dynamically determines overbought and oversold levels based on market structure and trend bias:
#### Monthly Level Logic
- **Bullish Bias** (when monthly open > EMA20):
- Oversold = lower of EMA9 or EMA20
- Overbought = upper of EMA9 or Bollinger Upper Band
- **Bearish/Neutral Bias** (when monthly open ≤ EMA20):
- Oversold = Bollinger Lower Band
- Overbought = upper of EMA20 or EMA9
#### Weekly Level Logic
- **Bullish Bias** (when weekly open > EMA20):
- Oversold = lower of EMA9 or EMA20
- Overbought = Bollinger Upper Band
- **Bearish/Neutral Bias** (when weekly open ≤ EMA20):
- Oversold = Bollinger Lower Band
- Overbought = upper of EMA20 or EMA9
#### Daily Level Logic
- Simple Bollinger Bands:
- Oversold = Bollinger Lower Band
- Overbought = Bollinger Upper Band
### Final Level Determination
The indicator combines all three timeframes through a weighted averaging process:
1. Calculates initial values as the average of monthly, weekly, and daily levels
2. Ensures mathematical consistency by enforcing overbought_final ≥ oversold_final using min/max functions
3. Calculates a midpoint average level as the center of the range
### Visual Elements
- **Dynamic Lines**: Draws horizontal lines for current and previous period overbought, oversold, and average levels
- **Labels**: Places clear textual labels at the start of each period
- **Color Coding**:
- Red for overbought levels (resistance)
- Green for oversold levels (support)
- Blue for average levels (pivot point)
- **Transparency**: Previous period lines use semi-transparent colors to distinguish between current and historical levels
### Update Mechanism
- **Calculation Day**: User-defined day of the week (default: Monday)
- On the specified calculation day, the indicator:
- Updates all levels based on previous bar's data
- Draws new lines extending forward for a user-defined number of days
- Maintains previous period lines for comparison and trend analysis
- Automatically deletes and recreates lines to ensure clean visualization
### Proximity Detection
- Alerts when price approaches overbought/oversold levels (configurable distance in percentage)
- Helps identify potential reversal zones before actual crossovers occur
- Distance thresholds are user-configurable for both overbought and oversold conditions
### Alert Conditions
The indicator provides four distinct alert types:
1. **Cross below oversold**: Triggered when price crosses below the oversold level
2. **Cross above overbought**: Triggered when price crosses above the overbought level
3. **Near oversold**: Triggered when price approaches the oversold level within the configured distance
4. **Near overbought**: Triggered when price approaches the overbought level within the configured distance
### Debug Mode
When enabled, displays comprehensive debug information including:
- Current values for all levels (oversold, overbought, average)
- Timeframe-specific calculations and raw data points
- System status information (current day, calculation day, etc.)
- Lines existence and timing information
- Organized in multiple labels at different price levels to avoid overlap
## Configuration Parameters
| Parameter | Default Value | Description |
|---------|---------------|-------------|
| Short EMA (9) | 9 | Length for short-term EMA calculation |
| Long EMA (20) | 20 | Length for long-term EMA calculation |
| BB Length | 20 | Period for Bollinger Bands calculation |
| Std Dev | 2.0 | Standard deviation multiplier for Bollinger Bands |
| Distance to overbought (%) | 0.5 | Percentage threshold for "near overbought" alerts |
| Distance to oversold (%) | 0.5 | Percentage threshold for "near oversold" alerts |
| Calculation day | Monday | Day of week when levels are recalculated |
| Lookback days | 7 | Number of days to extend previous period lines backward |
| Forward days | 7 | Number of days to extend current period lines forward |
| Show Debug Labels | false | Toggle for comprehensive debug information display |
## Trading Applications
### Primary Use Cases
1. **Reversal Trading**: Identify potential reversal zones when price approaches overbought/oversold levels
2. **Trend Confirmation**: Use the adaptive nature of levels to confirm trend strength and direction
3. **Position Sizing**: Adjust position size based on distance from key levels
4. **Stop Placement**: Use opposite levels as dynamic stop-loss references
### Strategic Advantages
- **Adaptive Nature**: Levels adjust to changing market volatility and trend structure
- **Multi-Timeframe Confirmation**: Signals are validated across multiple timeframes
- **Visual Clarity**: Clear color-coded lines and labels enhance decision-making
- **Proactive Alerts**: "Near" conditions provide early warnings before crossovers
## Implementation Details
### Data Security
Uses `request.security()` function to fetch data from higher timeframes (monthly, weekly) while maintaining proper bar indexing with ` ` offset for open prices.
### Performance Optimization
- Uses `var` keyword to declare persistent variables that maintain state across bars
- Efficient line and label management with proper deletion before recreation
- Conditional execution of debug code to minimize performance impact
### Error Handling
- Comprehensive NA (not available) checks throughout the code
- Graceful degradation when data is unavailable for higher timeframes
- Mathematical safeguards to prevent invalid level calculations
## Conclusion
The OB/OS Adaptative v1.1 indicator represents a sophisticated approach to identifying market extremes by combining multiple technical analysis concepts. Its adaptive nature makes it particularly useful in trending markets where static levels may be less effective. The multi-timeframe approach provides a comprehensive view of market structure, while the visual elements and alert system enhance its practical utility for active traders.

Project SynthIntroducing Project Synth !
Inspired by Pace of Tape and Cumulative Delta I created Project Synth in order to aggregate volume flow data across multiple marketsfor two primary reasions:
Traditional orderflow tools are not available on Tradingview. My script attempts to bring an original; calculus-based approach to creating not only an alternative for traditional orderflow tools, but also a more accurate one.
In order to detect genuine buying and selling pressure that cannot be easily manipulated. I did this because while I've always enjoyed concept behind both of those tools, I did not think they captured enough data to be useful. By analyzing assets that move together (positive correlation) and assets that move inversely (negative correlation), my system aims to fix the fundamental problems with those indicators and create an objective view of market sentiment based on aggregate orderflow.
Some more detailed explanations (using QQQ and SQQQ as an example):
Inverse Market Dynamics (QQQ vs SQQQ):
In an inverse market like SQQQ, aggressive buyers hit the ask when they expect the underlying (QQQ) to fall, while passive buyers wait on the bid hoping for cheaper inverse exposure. When QQQ rallies, SQQQ sees aggressive selling (people dumping their bearish bets) hitting bids, while passive sellers sit on the ask hoping to exit at better prices. The aggression flows opposite to the underlying market direction.
Why Utilizing Both Markets Provides A More Accurate Delta:
Watching both QQQ and SQQQ gives cross-validation - real buying pressure in QQQ should coincide with selling pressure in SQQQ. If you see buying in QQQ but also buying in SQQQ, that's a conflicting signal suggesting the move might be artificial or driven by other factors. The inverse relationship acts as a confirmation filter, making false signals much harder to generate.
Multiple Markets = Authentic Pressure:
The more unique, important markets you track, the harder it becomes to create fake delta moves. Real institutional buying/selling pressure affects multiple correlated assets simultaneously in predictable patterns - you can't easily manipulate tech stocks, treasury bonds, VIX, and currency pairs all at once to create a false signal. Each additional market acts as a fraud detection layer, ensuring the delta measurement reflects genuine ecosystem-wide buying and selling pressure rather than isolated manipulation or noise.
My Suggestions For Usage:
In order to keep the explanation simple and short for now, I suggest using it just like a cumulative delta indicator. For example: let's say you were watching CME_MINI:ES1! , and you had a resistance level at 6000. When the price reaches your resistance level, you would be looking for a significant divergence between price and Delta. Price : rising, Delta : falling. This means that even though the price was going up, strong and aggressive sellers are jumping in more and more, this can be used as a confirmation tool for a resistance level.
Notes For Moderators, Authors and Users:
Firstly, to the best of my knowledge, I have not been able to find many tools built around the concept of cumulative delta or pace of tape. While I know there are a couple projects, none to the magnitude of synthetically recreating these tools via an algorithm designed around basic calculus principles. While tools like Volume Delta are built in, they do not attempt to capture an accurate picture of aggregated orderflow from what I understand.
Secondly, it needs to be noted that tool aims to create an approximation of buying and selling pressure. To my knowledge it is not possible to create an accurate full picture, at least not within the limitations of Tradingview.

Buffett Indicator with Historical Bubbles (Clean)The Buffett Indicator is a trusted macroeconomic gauge that compares the total US stock market capitalization to the nation’s GDP. Popularized by Warren Buffett, this metric highlights periods of overvaluation and undervaluation in the market.
This tool offers a clean and accurate visualization of the Buffett Indicator, enhanced with historical bubble annotations for key market events:
Dot-com Bubble (2000)
Global Financial Crisis Peak (2007)
COVID-19 Pre-crash Peak (2020)
Post-COVID Bull Market Peak (2021)
Features:
Dynamic Buffett Ratio (%) calculation using Wilshire 5000 Index as the market cap proxy.
Customizable GDP input for accuracy (update quarterly).
Visual thresholds for fair value, undervaluation, and overvaluation zones.
Historical event markers for educational and analytical context.
Optimized to display clearly across all timeframes: Daily, Weekly, Monthly.
How to Use:
Manually update the GDP input as new data is released.
Use this indicator for macro-level market sentiment analysis and valuation tracking.
Combine with other tools and risk management strategies for comprehensive market insights.
Disclaimer:
This indicator is for educational purposes only. It does not constitute financial advice. Always perform your own research and analysis.
Version: 1.0
we ask Allah reconcile and repay
#BuffettIndicator #MarketValuation #MacroAnalysis #BubbleDetector #LongTermInvestor #USMarket #Wilshire5000 #TradingViewScript

Smart Liquidity Wave [The_lurker]"Smart Liquidity Wave" هو مؤشر تحليلي متطور يهدف لتحديد نقاط الدخول والخروج المثلى بناءً على تحليل السيولة، قوة الاتجاه، وإشارات السوق المفلترة. يتميز المؤشر بقدرته على تصنيف الأدوات المالية إلى أربع فئات سيولة (ضعيفة، متوسطة، عالية، عالية جدًا)، مع تطبيق شروط مخصصة لكل فئة تعتمد على تحليل الموجات السعرية، الفلاتر المتعددة، ومؤشر ADX.
فكرة المؤشر
الفكرة الأساسية هي الجمع بين قياس السيولة اليومية الثابتة وتحليل ديناميكي للسعر باستخدام فلاتر متقدمة لتوليد إشارات دقيقة. المؤشر يركز على تصفية الضوضاء في السوق من خلال طبقات متعددة من التحليل، مما يجعله أداة ذكية تتكيف مع الأدوات المالية المختلفة بناءً على مستوى سيولتها.
طريقة عمل المؤشر
1- قياس السيولة:
يتم حساب السيولة باستخدام متوسط حجم التداول على مدى 14 يومًا مضروبًا في سعر الإغلاق، ويتم ذلك دائمًا على الإطار الزمني اليومي لضمان ثبات القيمة بغض النظر عن الإطار الزمني المستخدم في الرسم البياني.
يتم تصنيف السيولة إلى:
ضعيفة: أقل من 5 ملايين (قابل للتعديل).
متوسطة: من 5 إلى 20 مليون.
عالية: من 20 إلى 50 مليون.
عالية جدًا: أكثر من 50 مليون.
هذا الثبات في القياس يضمن أن تصنيف السيولة لا يتغير مع تغير الإطار الزمني، مما يوفر أساسًا موثوقًا للإشارات.
2- تحليل الموجات السعرية:
يعتمد المؤشر على تحليل الموجات باستخدام متوسطات متحركة متعددة الأنواع (مثل SMA، EMA، WMA، HMA، وغيرها) يمكن للمستخدم اختيارها وتخصيص فتراتها ، يتم دمج هذا التحليل مع مؤشرات إضافية مثل RSI (مؤشر القوة النسبية) وMFI (مؤشر تدفق الأموال) بوزن محدد (40% للموجات، 30% لكل من RSI وMFI) للحصول على تقييم شامل للاتجاه.
3- الفلاتر وطريقة عملها:
المؤشر يستخدم نظام فلاتر متعدد الطبقات لتصفية الإشارات وتقليل الضوضاء، وهي من أبرز الجوانب المخفية التي تعزز دقته:
الفلتر الرئيسي (Main Filter):
يعمل على تنعيم التغيرات السعرية السريعة باستخدام معادلة رياضية تعتمد على تحليل الإشارات (Signal Processing).
يتم تطبيقه على السعر لاستخراج الاتجاهات الأساسية بعيدًا عن التقلبات العشوائية، مع فترة زمنية قابلة للتعديل (افتراضي: 30).
يستخدم تقنية مشابهة للفلاتر عالية التردد (High-Pass Filter) للتركيز على الحركات الكبيرة.
الفلتر الفرعي (Sub Filter):
يعمل كطبقة ثانية للتصفية، مع فترة أقصر (افتراضي: 12)، لضبط الإشارات بدقة أكبر.
يستخدم معادلات تعتمد على الترددات المنخفضة للتأكد من أن الإشارات الناتجة تعكس تغيرات حقيقية وليست مجرد ضوضاء.
إشارة الزناد (Signal Trigger):
يتم تطبيق متوسط متحرك على نتائج الفلتر الرئيسي لتوليد خط إشارة (Signal Line) يُقارن مع عتبات محددة للدخول والخروج.
يمكن تعديل فترة الزناد (افتراضي: 3 للدخول، 5 للخروج) لتسريع أو تبطيء الإشارات.
الفلتر المربع (Square Filter):
خاصية مخفية تُفعّل افتراضيًا تعزز دقة الفلاتر عن طريق تضييق نطاق التذبذبات المسموح بها، مما يقلل من الإشارات العشوائية في الأسواق المتقلبة.
4- تصفية الإشارات باستخدام ADX:
يتم استخدام مؤشر ADX كفلتر نهائي للتأكد من قوة الاتجاه قبل إصدار الإشارة:
ضعيفة ومتوسطة: دخول عندما يكون ADX فوق 40، خروج فوق 50.
عالية: دخول فوق 40، خروج فوق 55.
عالية جدًا: دخول فوق 35، خروج فوق 38.
هذه العتبات قابلة للتعديل، مما يسمح بتكييف المؤشر مع استراتيجيات مختلفة.
5- توليد الإشارات:
الدخول: يتم إصدار إشارة شراء عندما تنخفض خطوط الإشارة إلى ما دون عتبة محددة (مثل -9) مع تحقق شروط الفلاتر، السيولة، وADX.
الخروج: يتم إصدار إشارة بيع عندما ترتفع الخطوط فوق عتبة (مثل 109 أو 106 حسب الفئة) مع تحقق الشروط الأخرى.
تُعرض الإشارات بألوان مميزة (أزرق للدخول، برتقالي للضعيفة والمتوسطة، أحمر للعالية والعالية جدًا) وبثلاثة أحجام (صغير، متوسط، كبير).
6- عرض النتائج:
يظهر مستوى السيولة الحالي في جدول في أعلى يمين الرسم البياني، مما يتيح للمستخدم معرفة فئة الأصل بسهولة.
7- دعم التنبيهات:
تنبيهات فورية لكل فئة سيولة، مما يسهل التداول الآلي أو اليدوي.
%%%%% الجوانب المخفية في الكود %%%%%
معادلات الفلاتر المتقدمة: يستخدم المؤشر معادلات رياضية معقدة مستوحاة من معالجة الإشارات لتنعيم البيانات واستخراج الاتجاهات، مما يجعله أكثر دقة من المؤشرات التقليدية.
التكيف التلقائي: النظام يضبط نفسه داخليًا بناءً على التغيرات في السعر والحجم، مع عوامل تصحيح مخفية (مثل معامل التنعيم في الفلاتر) للحفاظ على الاستقرار.
التوزيع الموزون: الدمج بين الموجات، RSI، وMFI يتم بأوزان محددة (40%، 30%، 30%) لضمان توازن التحليل، وهي تفاصيل غير ظاهرة مباشرة للمستخدم لكنها تؤثر على النتائج.
الفلتر المربع: خيار مخفي يتم تفعيله افتراضيًا لتضييق نطاق الإشارات، مما يقلل من التشتت في الأسواق ذات التقلبات العالية.
مميزات المؤشر
1- فلاتر متعددة الطبقات: تضمن تصفية الضوضاء وإنتاج إشارات موثوقة فقط.
2- ثبات السيولة: قياس السيولة اليومي يجعل التصنيف متسقًا عبر الإطارات الزمنية.
3- تخصيص شامل: يمكن تعديل حدود السيولة، عتبات ADX، فترات الفلاتر، وأنواع المتوسطات المتحركة.
4- إشارات مرئية واضحة: تصميم بصري يسهل التفسير مع تنبيهات فورية.
5- تقليل الإشارات الخاطئة: الجمع بين الفلاتر وADX يعزز الدقة ويقلل من التشتت.
إخلاء المسؤولية
لا يُقصد بالمعلومات والمنشورات أن تكون، أو تشكل، أي نصيحة مالية أو استثمارية أو تجارية أو أنواع أخرى من النصائح أو التوصيات المقدمة أو المعتمدة من TradingView.
#### **What is the Smart Liquidity Wave Indicator?**
"Smart Liquidity Wave" is an advanced analytical indicator designed to identify optimal entry and exit points based on liquidity analysis, trend strength, and filtered market signals. It stands out with its ability to categorize financial instruments into four liquidity levels (Weak, Medium, High, Very High), applying customized conditions for each category based on price wave analysis, multi-layered filters, and the ADX (Average Directional Index).
#### **Concept of the Indicator**
The core idea is to combine a stable daily liquidity measurement with dynamic price analysis using sophisticated filters to generate precise signals. The indicator focuses on eliminating market noise through multiple analytical layers, making it an intelligent tool that adapts to various financial instruments based on their liquidity levels.
#### **How the Indicator Works**
1. **Liquidity Measurement:**
- Liquidity is calculated using the 14-day average trading volume multiplied by the closing price, always based on the daily timeframe to ensure value consistency regardless of the chart’s timeframe.
- Liquidity is classified as:
- **Weak:** Less than 5 million (adjustable).
- **Medium:** 5 to 20 million.
- **High:** 20 to 50 million.
- **Very High:** Over 50 million.
- This consistency in measurement ensures that liquidity classification remains unchanged across different timeframes, providing a reliable foundation for signals.
2. **Price Wave Analysis:**
- The indicator relies on wave analysis using various types of moving averages (e.g., SMA, EMA, WMA, HMA, etc.), which users can select and customize in terms of periods.
- This analysis is integrated with additional indicators like RSI (Relative Strength Index) and MFI (Money Flow Index), weighted specifically (40% waves, 30% RSI, 30% MFI) to provide a comprehensive trend assessment.
3. **Filters and Their Functionality:**
- The indicator employs a multi-layered filtering system to refine signals and reduce noise, a key hidden feature that enhances its accuracy:
- **Main Filter:**
- Smooths rapid price fluctuations using a mathematical equation rooted in signal processing techniques.
- Applied to price data to extract core trends away from random volatility, with an adjustable period (default: 30).
- Utilizes a technique similar to high-pass filters to focus on significant movements.
- **Sub Filter:**
- Acts as a secondary filtering layer with a shorter period (default: 12) for finer signal tuning.
- Employs low-frequency-based equations to ensure resulting signals reflect genuine changes rather than mere noise.
- **Signal Trigger:**
- Applies a moving average to the main filter’s output to generate a signal line, compared against predefined entry and exit thresholds.
- Trigger period is adjustable (default: 3 for entry, 5 for exit) to speed up or slow down signals.
- **Square Filter:**
- A hidden feature activated by default, enhancing filter precision by narrowing the range of permissible oscillations, reducing random signals in volatile markets.
4. **Signal Filtering with ADX:**
- ADX is used as a final filter to confirm trend strength before issuing signals:
- **Weak and Medium:** Entry when ADX exceeds 40, exit above 50.
- **High:** Entry above 40, exit above 55.
- **Very High:** Entry above 35, exit above 38.
- These thresholds are adjustable, allowing the indicator to adapt to different trading strategies.
5. **Signal Generation:**
- **Entry:** A buy signal is triggered when signal lines drop below a specific threshold (e.g., -9) and conditions for filters, liquidity, and ADX are met.
- **Exit:** A sell signal is issued when signal lines rise above a threshold (e.g., 109 or 106, depending on the category) with all conditions satisfied.
- Signals are displayed in distinct colors (blue for entry, orange for Weak/Medium, red for High/Very High) and three sizes (small, medium, large).
6. **Result Display:**
- The current liquidity level is shown in a table at the top-right of the chart, enabling users to easily identify the asset’s category.
7. **Alert Support:**
- Instant alerts are provided for each liquidity category, facilitating both automated and manual trading.
#### **Hidden Aspects in the Code**
- **Advanced Filter Equations:** The indicator uses complex mathematical formulas inspired by signal processing to smooth data and extract trends, making it more precise than traditional indicators.
- **Automatic Adaptation:** The system internally adjusts based on price and volume changes, with hidden correction factors (e.g., smoothing coefficients in filters) to maintain stability.
- **Weighted Distribution:** The integration of waves, RSI, and MFI uses fixed weights (40%, 30%, 30%) for balanced analysis, a detail not directly visible but impactful on results.
- **Square Filter:** A hidden option, enabled by default, narrows signal range to minimize dispersion in high-volatility markets.
#### **Indicator Features**
1. **Multi-Layered Filters:** Ensures noise reduction and delivers only reliable signals.
2. **Liquidity Stability:** Daily liquidity measurement keeps classification consistent across timeframes.
3. **Comprehensive Customization:** Allows adjustments to liquidity thresholds, ADX levels, filter periods, and moving average types.
4. **Clear Visual Signals:** User-friendly design with easy-to-read visuals and instant alerts.
5. **Reduced False Signals:** Combining filters and ADX enhances accuracy and minimizes clutter.
#### **Disclaimer**
The information and publications are not intended to be, nor do they constitute, financial, investment, trading, or other types of advice or recommendations provided or endorsed by TradingView.

Adaptive Trend FinderAdaptive Trend Finder - The Ultimate Trend Detection Tool
Introducing Adaptive Trend Finder, the next evolution of trend analysis on TradingView. This powerful indicator is an enhanced and refined version of Adaptive Trend Finder (Log), designed to offer even greater flexibility, accuracy, and ease of use.
What’s New?
Unlike the previous version, Adaptive Trend Finder allows users to fully configure and adjust settings directly within the indicator menu, eliminating the need to modify chart settings manually. A major improvement is that users no longer need to adjust the chart's logarithmic scale manually in the chart settings; this can now be done directly within the indicator options, ensuring a smoother and more efficient experience. This makes it easier to switch between linear and logarithmic scaling without disrupting the analysis. This provides a seamless user experience where traders can instantly adapt the indicator to their needs without extra steps.
One of the most significant improvements is the complete code overhaul, which now enables simultaneous visualization of both long-term and short-term trend channels without needing to add the indicator twice. This not only improves workflow efficiency but also enhances chart readability by allowing traders to monitor multiple trend perspectives at once.
The interface has been entirely redesigned for a more intuitive user experience. Menus are now clearer, better structured, and offer more customization options, making it easier than ever to fine-tune the indicator to fit any trading strategy.
Key Features & Benefits
Automatic Trend Period Selection: The indicator dynamically identifies and applies the strongest trend period, ensuring optimal trend detection with no manual adjustments required. By analyzing historical price correlations, it selects the most statistically relevant trend duration automatically.
Dual Channel Display: Traders can view both long-term and short-term trend channels simultaneously, offering a broader perspective of market movements. This feature eliminates the need to apply the indicator twice, reducing screen clutter and improving efficiency.
Fully Adjustable Settings: Users can customize trend detection parameters directly within the indicator settings. No more switching chart settings – everything is accessible in one place.
Trend Strength & Confidence Metrics: The indicator calculates and displays a confidence score for each detected trend using Pearson correlation values. This helps traders gauge the reliability of a given trend before making decisions.
Midline & Channel Transparency Options: Users can fine-tune the visibility of trend channels, adjusting transparency levels to fit their personal charting style without overwhelming the price chart.
Annualized Return Calculation: For daily and weekly timeframes, the indicator provides an estimate of the trend’s performance over a year, helping traders evaluate potential long-term profitability.
Logarithmic Adjustment Support: Adaptive Trend Finder is compatible with both logarithmic and linear charts. Traders who analyze assets like cryptocurrencies, where log scaling is common, can enable this feature to refine trend calculations.
Intuitive & User-Friendly Interface: The updated menu structure is designed for ease of use, allowing quick and efficient modifications to settings, reducing the learning curve for new users.
Why is this the Best Trend Indicator?
Adaptive Trend Finder stands out as one of the most advanced trend analysis tools available on TradingView. Unlike conventional trend indicators, which rely on fixed parameters or lagging signals, Adaptive Trend Finder dynamically adjusts its settings based on real-time market conditions. By combining automatic trend detection, dual-channel visualization, real-time performance metrics, and an intuitive user interface, this indicator offers an unparalleled edge in trend identification and trading decision-making.
Traders no longer have to rely on guesswork or manually tweak settings to identify trends. Adaptive Trend Finder does the heavy lifting, ensuring that users are always working with the strongest and most reliable trends. The ability to simultaneously display both short-term and long-term trends allows for a more comprehensive market overview, making it ideal for scalpers, swing traders, and long-term investors alike.
With its state-of-the-art algorithms, fully customizable interface, and professional-grade accuracy, Adaptive Trend Finder is undoubtedly one of the most powerful trend indicators available.
Try it today and experience the future of trend analysis.
This indicator is a technical analysis tool designed to assist traders in identifying trends. It does not guarantee future performance or profitability. Users should conduct their own research and apply proper risk management before making trading decisions.
// Created by Julien Eche - @Julien_Eche
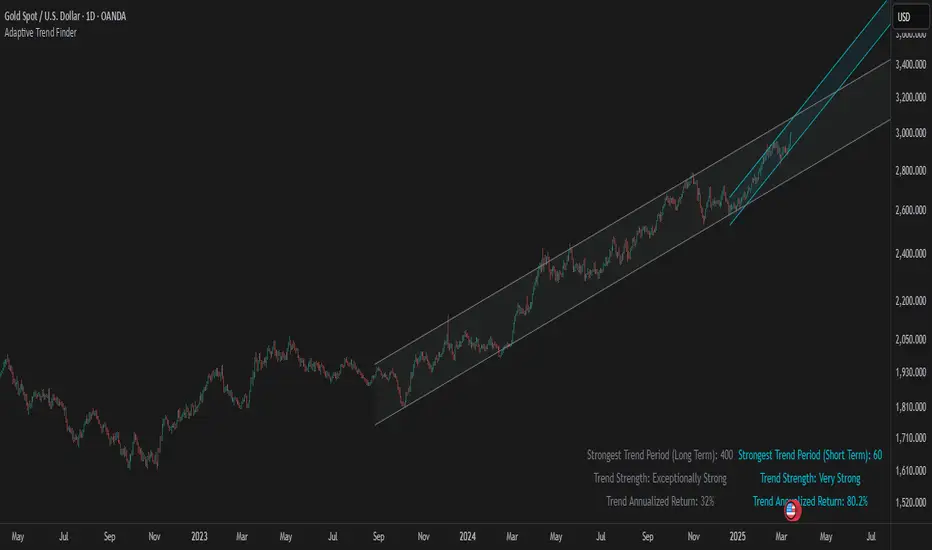
Casa_UtilsLibrary "Casa_Utils"
A collection of convenience and helper functions for indicator and library authors on TradingView
formatNumber(num)
My version of format number that doesn't have so many decimal places...
Parameters:
num (float) : The number to be formatted
Returns: The formatted number
getDateString(timestamp)
Convenience function returns timestamp in yyyy/MM/dd format.
Parameters:
timestamp (int) : The timestamp to stringify
Returns: The date string
getDateTimeString(timestamp)
Convenience function returns timestamp in yyyy/MM/dd hh:mm format.
Parameters:
timestamp (int) : The timestamp to stringify
Returns: The date string
getInsideBarCount()
Gets the number of inside bars for the current chart. Can also be passed to request.security to get the same for different timeframes.
Returns: The # of inside bars on the chart right now.
getLabelStyleFromString(styleString, acceptGivenIfNoMatch)
Tradingview doesn't give you a nice way to put the label styles into a dropdown for configuration settings. So, I specify them in the following format: "Center", "Left", "Lower Left", "Lower Right", "Right", "Up", "Upper Left", "Upper Right", "Plain Text", "No Labels". This function takes care of converting those custom strings back to the ones expected by tradingview scripts.
Parameters:
styleString (string)
acceptGivenIfNoMatch (bool) : If no match for styleString is found and this is true, the function will return styleString, otherwise it will return tradingview's preferred default
Returns: The string expected by tradingview functions
getTime(hourNumber, minuteNumber)
Given an hour number and minute number, adds them together and returns the sum. To be used by getLevelBetweenTimes when fetching specific price levels during a time window on the day.
Parameters:
hourNumber (int) : The hour number
minuteNumber (int) : The minute number
Returns: The sum of all the minutes
getHighAndLowBetweenTimes(start, end)
Given a start and end time, returns the high or low price during that time window.
Parameters:
start (int) : The timestamp to start with (# of seconds)
end (int) : The timestamp to end with (# of seconds)
Returns: The high or low value
getPremarketHighsAndLows()
Returns an expression that can be used by request.security to fetch the premarket high & low levels in a tuple.
Returns: (tuple)
getAfterHoursHighsAndLows()
Returns an expression that can be used by request.security to fetch the after hours high & low levels in a tuple.
Returns: (tuple)
getOvernightHighsAndLows()
Returns an expression that can be used by request.security to fetch the overnight high & low levels in a tuple.
Returns: (tuple)
getNonRthHighsAndLows()
Returns an expression that can be used by request.security to fetch the high & low levels for premarket, after hours and overnight in a tuple.
Returns: (tuple)
getLineStyleFromString(styleString, acceptGivenIfNoMatch)
Tradingview doesn't give you a nice way to put the line styles into a dropdown for configuration settings. So, I specify them in the following format: "Solid", "Dashed", "Dotted", "None/Hidden". This function takes care of converting those custom strings back to the ones expected by tradingview scripts.
Parameters:
styleString (string) : Plain english (or TV Standard) version of the style string
acceptGivenIfNoMatch (bool) : If no match for styleString is found and this is true, the function will return styleString, otherwise it will return tradingview's preferred default
Returns: The string expected by tradingview functions
getPercentFromPrice(price)
Get the % the current price is away from the given price.
Parameters:
price (float)
Returns: The % the current price is away from the given price.
getPositionFromString(position)
Tradingview doesn't give you a nice way to put the positions into a dropdown for configuration settings. So, I specify them in the following format: "Top Left", "Top Center", "Top Right", "Middle Left", "Middle Center", "Middle Right", "Bottom Left", "Bottom Center", "Bottom Right". This function takes care of converting those custom strings back to the ones expected by tradingview scripts.
Parameters:
position (string) : Plain english position string
Returns: The string expected by tradingview functions
getRsiAvgsExpression(rsiLength)
Call request.security with this as the expression to get the average up/down values that can be used with getRsiPrice (below) to calculate the price level where the supplied RSI level would be reached.
Parameters:
rsiLength (simple int) : The length of the RSI requested.
Returns: A tuple containing the avgUp and avgDown values required by the getRsiPrice function.
getRsiPrice(rsiLevel, rsiLength, avgUp, avgDown)
use the values returned by getRsiAvgsExpression() to calculate the price level when the provided RSI level would be reached.
Parameters:
rsiLevel (float) : The RSI level to find price at.
rsiLength (int) : The length of the RSI to calculate.
avgUp (float) : The average move up of RSI.
avgDown (float) : The average move down of RSI.
Returns: The price level where the provided RSI level would be met.
getSizeFromString(sizeString)
Tradingview doesn't give you a nice way to put the sizes into a dropdown for configuration settings. So, I specify them in the following format: "Auto", "Huge", "Large", "Normal", "Small", "Tiny". This function takes care of converting those custom strings back to the ones expected by tradingview scripts.
Parameters:
sizeString (string) : Plain english size string
Returns: The string expected by tradingview functions
getTimeframeOfChart()
Get the timeframe of the current chart for display
Returns: The string of the current chart timeframe
getTimeNowPlusOffset(candleOffset)
Helper function for drawings that use xloc.bar_time to help you know the time offset if you want to place the end of the drawing out into the future. This determines the time-size of one candle and then returns a time n candleOffsets into the future.
Parameters:
candleOffset (int) : The number of items to find singular/plural for.
Returns: The future time
getVolumeBetweenTimes(start, end)
Given a start and end time, returns the sum of all volume across bars during that time window.
Parameters:
start (int) : The timestamp to start with (# of seconds)
end (int) : The timestamp to end with (# of seconds)
Returns: The volume
isToday()
Returns true if the current bar occurs on today's date.
Returns: True if current bar is today
padLabelString(labelText, labelStyle)
Pads a label string so that it appears properly in or not in a label. When label.style_none is used, this will make sure it is left-aligned instead of center-aligned. When any other type is used, it adds a single space to the right so there is padding against the right end of the label.
Parameters:
labelText (string) : The string to be padded
labelStyle (string) : The style of the label being padded for.
Returns: The padded string
plural(num, singular, plural)
Helps format a string for plural/singular. By default, if you only provide num, it will just return "s" for plural and nothing for singular (eg. plural(numberOfCats)). But you can optionally specify the full singular/plural words for more complicated nomenclature (eg. plural(numberOfBenches, 'bench', 'benches'))
Parameters:
num (int) : The number of items to find singular/plural for.
singular (string) : The string to return if num is singular. Defaults to an empty string.
plural (string) : The string to return if num is plural. Defaults to 's' so you can just add 's' to the end of a word.
Returns: The singular or plural provided strings depending on the num provided.
timeframeInSeconds(timeframe)
Get the # of seconds in a given timeframe. Tradingview's timeframe.in_seconds() expects a simple string, and we often need to use series string, so this is an alternative to get you the value you need.
Parameters:
timeframe (string)
Returns: The number of secondsof that timeframe
timeframeOfChart()
Convert a timeframe string to a consistent standard.
Returns: The standard format for the string, or the unchanged value if it is unknown.
timeframeToString(timeframe)
Convert a timeframe string to a consistent standard.
Parameters:
timeframe (string)
Returns: (string) The standard format for the string, or the unchanged value if it is unknown.
stringToTimeframe(strTimeframe)
Convert an english-friendly timeframe string to a value that can be used by request.security. Specifically, this corrects hour strings (eg. 4h) to their numeric "minute" equivalent (eg. 240)
Parameters:
strTimeframe (string)
Returns: (string) The standard format for the string, or the unchanged value if it is unknown.
getPriceLabel(price, labelOffset, labelStyle, labelSize, labelColor, textColor)
Defines a label for the end of a price level line.
Parameters:
price (float) : The price level to render the label at.
labelOffset (int) : The number of candles to place the label to the right of price.
labelStyle (string) : A plain english string as defined in getLabelStyleFromString.
labelSize (string) : The size of the label.
labelColor (color) : The color of the label.
textColor (color) : The color of the label text (defaults to #ffffff)
Returns: The label that was created.
setPriceLabel(label, labelName, price, labelOffset, labelTemplate, labelStyle, labelColor, textColor)
Updates the label position & text based on price changes.
Parameters:
label (label) : The label to update.
labelName (string) : The name of the price level to be placed on the label.
price (float) : The price level to render the label at.
labelOffset (int) : The number of candles to place the label to the right of price.
labelTemplate (string) : The str.format template to use for the label. Defaults to: '{0}: {1} {2}{3,number,#.##}%' which means '{price}: {labelName} {+/-}{percentFromPrice}%'
labelStyle (string)
labelColor (color)
textColor (color)
getPriceLabelLine(price, labelOffset, labelColor, lineWidth)
Defines a line that will stretch from the plot line to the label.
Parameters:
price (float) : The price level to render the label at.
labelOffset (int) : The number of candles to place the label to the right of price.
labelColor (color)
lineWidth (int) : The width of the line. Defaults to 1.
setPriceLabelLine(line, price, labelOffset, lastTime, lineColor)
Updates the price label line based on price changes.
Parameters:
line (line) : The line to update.
price (float) : The price level to render the label at.
labelOffset (int) : The number of candles to place the label to the right of price.
lastTime (int) : The last time that the line should stretch from. Defaults to time.
lineColor (color)
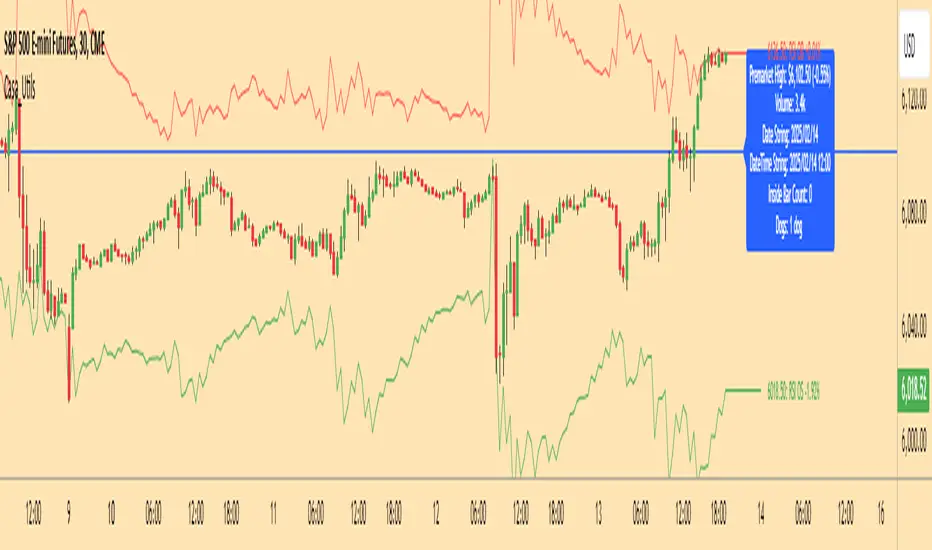
Smart Volume S/R Pro [The_lurker]مؤشر "Smart Volume S/R Pro " هو أداة تحليل فني متقدمة مصممة لمساعدة المتداولين في تحديد مستويات الدعم والمقاومة القوية بناءً على حجم التداول، مع إضافة ميزات تحليلية متطورة مثل تصفية الاتجاه ، مناطق الثقة ، تقييم القوة ، حساب احتمالية الاختراق ، قياس السيولة ، تحديد الأهداف السعرية ، ومستويات فيبوناتشي . وايضا تقديم تسميات (Labels) بجانب كل مستوى دعم ومقاومة، تحتوي على أرقام ومعلومات دقيقة تعكس حالة السوق. هذه التسميات ليست مجرد زينة، بل أدوات تحليلية تساعد المتداولين على اتخاذ قرارات مستنيرة بناءً على بيانات السوقيهدف هذا المؤشر إلى توفير رؤية شاملة للسوق .
الوظائف الرئيسية للمؤشر
1- تحديد مستويات الدعم والمقاومة بناءً على حجم التداول العالي
يقوم المؤشر بتحليل الأشرطة (Bars) السابقة (حتى 300 شريط افتراضيًا) لتحديد النقاط التي شهدت أعلى مستويات حجم التداول.
يرسم خطوط أفقية تمثل مستويات المقاومة (عند أعلى سعر في تلك الأشرطة) والدعم (عند أدنى سعر)، ويمكن للمستخدم اختيار عدد الخطوط المعروضة (من 1 إلى 6).
2- تصفية الاتجاه باستخدام مؤشر ADX
يستخدم المؤشر مؤشر الاتجاه المتوسط (ADX) لتقييم قوة الاتجاه في السوق.
عندما تكون قوة الاتجاه عالية (تتجاوز عتبة محددة، 25 افتراضيًا)، يقلل المؤشر عدد مستويات الدعم والمقاومة المعروضة للتركيز فقط على المستويات الأكثر أهمية.
3- مناطق الثقة الديناميكية
يضيف المؤشر مناطق حول مستويات الدعم والمقاومة بناءً على متوسط المدى الحقيقي (ATR)، مما يساعد المتداولين على تصور النطاقات التي قد يتفاعل فيها السعر مع هذه المستويات.
يمكن تعديل عرض هذه المناطق باستخدام مضاعف ATR.
4- تقييم قوة المستويات
يحسب المؤشر قوة كل مستوى بناءً على حجم التداول، عدد المرات التي تم اختبار المستوى فيها (Touch Count)، وقرب السعر الحالي من المستوى.
يتم عرض درجة القوة (من 0 إلى 100) بجانب كل مستوى إذا تم تفعيل هذه الخاصية.
5- احتمالية الاختراق
يقدّر المؤشر احتمالية اختراق كل مستوى بناءً على الزخم (ROC)، قوة المستوى، والمسافة بين السعر الحالي والمستوى.
يظهر الاحتمال كنسبة مئوية إذا تم تفعيل الخيار، مما يساعد المتداولين على توقع الحركات المحتملة.
6- تحليل السيولة التاريخية
يقيس المؤشر السيولة حول كل مستوى بناءً على حجم التداول في النطاقات القريبة منه.
يمكن عرض قيم السيولة في التسميات أو استخدامها لتعديل عرض الخطوط (الخطوط الأكثر سيولة تظهر أعرض).
7- الأهداف السعرية
عند تفعيل هذه الخاصية، يحسب المؤشر أهداف سعرية للاختراق (Breakout) والارتداد (Reversal) بناءً على الزخم وقوة المستوى وATR.
يمكن عرض هذه الأهداف كنصوص في التسميات أو كخطوط أفقية على الرسم البياني.
8- مستويات فيبوناتشي
يرسم المؤشر مستويات فيبوناتشي (0.0، 0.236، 0.382، 0.5، 0.618، 0.786، 1.0) بناءً على أعلى وأدنى سعر في فترة النظرة الخلفية.
يمكن للمستخدم اختيار أي من هذه المستويات لعرضها أو إخفائها.
9- تنبيه شامل للاختراق
يوفر المؤشر تنبيهًا واحدًا يشمل جميع المستويات، حيث يُطلق التنبيه عندما يخترق السعر أي مستوى دعم أو مقاومة مع رسالة توضح نوع الاختراق والمستوى المخترق.
كيفية عمل المؤشر
الخطوة الأولى: يحدد المؤشر الأشرطة ذات الحجم العالي خلال فترة النظرة الخلفية المحددة (Lookback Period).
الخطوة الثانية: يرسم مستويات الدعم والمقاومة بناءً على أعلى وأدنى الأسعار في تلك الأشرطة، مع مراعاة عدد الخطوط المختارة من المستخدم.
الخطوة الثالثة: يطبق مرشح الاتجاه (إذا كان مفعلاً) لتقليل عدد المستويات في حالة الاتجاه القوي.
الخطوة الرابعة: يضيف التحليلات الإضافية مثل القوة، السيولة، احتمالية الاختراق، والأهداف السعرية، ويرسم مناطق الثقة ومستويات فيبوناتشي حسب الإعدادات.
الخطوة الخامسة: يراقب السعر ويطلق تنبيهًا عند الاختراق.
الإعدادات القابلة للتخصيص
1- فترة النظرة الخلفية (Lookback Period): عدد الأشرطة التي يتم تحليلها (افتراضيًا 300).
2- عدد الخطوط (Number of Lines): من 1 إلى 6 مستويات دعم ومقاومة.
3- الألوان والأنماط: يمكن تغيير ألوان الخطوط وأنماطها (ممتلئة، متقطعة، منقطة).
4- التسميات: تفعيل/تعطيل التسميات، وحجمها، وموقعها، ولون النص.
5- مرشح الاتجاه: تفعيل/تعطيل ADX، وتعديل طوله وعتبته.
6- مناطق الثقة: تفعيل/تعطيل، وتعديل طول ATR ومضاعفه.
7- القوة واحتمالية الاختراق: تفعيل/تعطيل العرض، وتعديل طول ROC.
8- السيولة: تفعيل/تعطيل تأثير السيولة على عرض الخطوط وقيمها في التسميات.
9- الأهداف السعرية: تفعيل/تعطيل الأهداف وعرضها كخطوط.
10- فيبوناتشي: اختيار المستويات المعروضة ولون الخطوط.
فوائد المؤشر
دقة عالية: يعتمد على حجم التداول لتحديد المستويات، مما يجعله أكثر موثوقية من المستويات العشوائية.
مرونة: يوفر خيارات تخصيص واسعة تتيح للمتداولين تكييفه حسب استراتيجياتهم.
تحليل شامل: يجمع بين الدعم والمقاومة، الاتجاه، السيولة، والأهداف في أداة واحدة.
سهولة الاستخدام: التسميات والتنبيهات تجعل من السهل متابعة السوق دون تعقيد.
==================================================================================تسميات (Labels) بجانب كل مستوى دعم ومقاومة، تحتوي على أرقام ومعلومات دقيقة تعكس حالة السوق. هذه التسميات ليست مجرد زينة، بل أدوات تحليلية تساعد المتداولين على اتخاذ قرارات مستنيرة بناءً على بيانات السوق. في هذا الشرح، سنستعرض كل رقم أو قيمة تظهر في التسميات ومعناها العملي.
مكونات التسميات
التسميات تظهر بجانب كل مستوى دعم (Support) ومقاومة (Resistance) وتبدأ بحرف "S" للدعم أو "R" للمقاومة، تليها مجموعة من الأرقام والقيم التي يمكن تفعيلها أو تعطيلها حسب إعدادات المستخدم. إليك تفصيل كل عنصر:
1- عدد اللمسات (Touch Count)
الرمز: يظهر مباشرة بعد "S" أو "R" (مثال: "R: 5" أو "S: 3").
المعنى: يشير إلى عدد المرات التي اختبر فيها السعر هذا المستوى دون اختراقه.
الفائدة: كلما زاد عدد اللمسات، كلما كان المستوى أقوى وأكثر أهمية. على سبيل المثال، إذا كان "R: 5"، فهذا يعني أن السعر ارتد من هذا المستوى 5 مرات، مما يجعله مقاومة قوية محتملة.
2- قوة المستوى (Strength Rating)
الرمز: يظهر بين قوسين مربعين (مثال: " ").
المعنى: قيمة من 0 إلى 100 تعكس قوة المستوى بناءً على عوامل مثل حجم التداول، عدد اللمسات، وقرب السعر الحالي من المستوى.
الفائدة: القيم العالية (مثل 75 أو أكثر) تشير إلى مستوى قوي يصعب اختراقه، بينما القيم المنخفضة (مثل 30 أو أقل) تدل على ضعف المستوى وسهولة اختراقه. يمكن للمتداول استخدام هذا لتحديد المستويات الأكثر موثوقية.
3- احتمالية الاختراق (Breakout Probability)
الرمز: يبدأ بحرف "B" متبوعًا بنسبة مئوية (مثال: "B: 60%").
المعنى: نسبة من 0% إلى 100% تُظهر احتمالية اختراق السعر للمستوى بناءً على الزخم الحالي، قوة المستوى، والمسافة بين السعر والمستوى.
الفائدة: نسبة مرتفعة (مثل 60% أو أكثر) تعني أن السعر قد يخترق المستوى قريبًا، بينما النسب المنخفضة (مثل 20%) تشير إلى احتمال ارتداد السعر. هذا مفيد لتوقع الحركة التالية.
4- قيمة السيولة (Liquidity Value)
الرمز: يبدأ بحرف "L" متبوعًا برقم (مثال: "L: 1200").
المعنى: يمثل متوسط حجم التداول في النطاق القريب من المستوى، مما يعكس السيولة التاريخية حوله.
الفائدة: القيم العالية تدل على وجود سيولة كبيرة، مما يعني أن السعر قد يتفاعل بقوة مع هذا المستوى (إما بالارتداد أو الاختراق). القيم المنخفضة تشير إلى سيولة ضعيفة، مما قد يجعل المستوى أقل تأثيرًا.
5- الأهداف السعرية (Price Targets)
الرمز: يبدأ بـ "BT" (هدف الاختراق) و"RT" (هدف الارتداد) متبوعين بأرقام (مثال: "BT: 150.50 RT: 148.20").
المعنى:
BT (Breakout Target): السعر المحتمل الذي قد يصل إليه السعر بعد اختراق المستوى.
RT (Reversal Target): السعر المحتمل الذي قد يصل إليه السعر إذا ارتد من المستوى.
الفائدة: تساعد المتداولين في تحديد نقاط الخروج المحتملة بعد الاختراق أو الارتداد، مما يسهل وضع خطة تداول دقيقة.
أمثلة عملية
تسمية مقاومة: "R: 4 B: 25% L: 1500 BT: 155.00 RT: 152.00"
المستوى اختُبر 4 مرات، قوته 80 (قوي جدًا)، احتمالية الاختراق 25% (منخفضة، أي احتمال ارتداد أعلى)، السيولة 1500 (مرتفعة)، هدف الاختراق 155.00، هدف الارتداد 152.00.
الاستنتاج: المستوى قوي ومن المرجح أن يرتد السعر منه، لكن إذا اخترق، فقد يصل إلى 155.00.
تسمية دعم: "S: 2 B: 70% L: 800 BT: 145.00 RT: 147.50"
المستوى اختُبر مرتين، قوته 40 (متوسطة إلى ضعيفة)، احتمالية الاختراق 70% (مرتفعة)، السيولة 800 (متوسطة)، هدف الاختراق 145.00، هدف الارتداد 147.50.
الاستنتاج: المستوى ضعيف ومن المحتمل أن يخترقه السعر ليهبط إلى 145.00.
كيفية الاستفادة من التسميات
تحديد القوة والضعف: استخدم قوة المستوى (Strength) لمعرفة ما إذا كان المستوى موثوقًا للارتداد أو عرضة للاختراق.
توقع الحركة: انظر إلى احتمالية الاختراق (Breakout Probability) لتحديد ما إذا كنت ستنتظر اختراقًا أو ترتدًا.
إدارة المخاطر: استخدم الأهداف السعرية (BT وRT) لتحديد نقاط جني الأرباح أو وقف الخسارة.
تقييم السيولة: ركز على المستويات ذات السيولة العالية لأنها غالبًا تكون نقاط تحول رئيسية في السوق.
تأكيد التحليل: ادمج عدد اللمسات مع القوة والسيولة للحصول على صورة كاملة عن أهمية المستوى.
تخصيص التسميات
يمكن للمستخدم تفعيل أو تعطيل أي من هذه القيم (القوة، الاحتمالية، السيولة، الأهداف) من إعدادات المؤشر.
يمكن أيضًا تغيير حجم التسميات (صغير، عادي، كبير)، موقعها (يمين، يسار، أعلى، أسفل)، ولون النص لتناسب احتياجاتك.
التسميات في هذا المؤشر هي بمثابة لوحة تحكم صغيرة بجانب كل مستوى دعم ومقاومة، تقدم لك معلومات فورية عن قوته، احتمالية اختراقه، سيولته، وأهدافه السعرية. بفهم هذه الأرقام، يمكنك تحسين قراراتك في التداول، سواء كنت تبحث عن نقاط دخول، خروج، أو إدارة مخاطر. إذا كنت تريد أداة تجمع بين البساطة والعمق التحليلي .
تنويه:
المؤشر هو أداة مساعدة فقط ويجب استخدامه مع التحليل الفني والأساسي لتحقيق أفضل النتائج.
إخلاء المسؤولية
لا يُقصد بالمعلومات والمنشورات أن تكون، أو تشكل، أي نصيحة مالية أو استثمارية أو تجارية أو أنواع أخرى من النصائح أو التوصيات المقدمة أو المعتمدة من TradingView.
The Smart Volume S/R Pro indicator is an advanced technical analysis tool designed to help traders identify strong support and resistance levels based on trading volume, with the addition of advanced analytical features such as trend filtering, confidence zones, strength assessment, breakout probability calculation, liquidity measurement, price target identification, and Fibonacci levels. It also provides labels next to each support and resistance level, containing accurate numbers and information that reflect the market condition. These labels are not just decorations, but analytical tools that help traders make informed decisions based on market data. This indicator aims to provide a comprehensive view of the market.
Main functions of the indicator
1- Identifying support and resistance levels based on high trading volume
The indicator analyzes previous bars (up to 300 bars by default) to identify the points that witnessed the highest levels of trading volume.
It draws horizontal lines representing resistance levels (at the highest price in those bars) and support (at the lowest price), and the user can choose the number of lines displayed (from 1 to 6).
2- Filtering the trend using the ADX indicator
The indicator uses the Average Directional Index (ADX) to assess the strength of a trend in the market.
When the strength of the trend is high (exceeding a specified threshold, 25 by default), the indicator reduces the number of support and resistance levels displayed to focus only on the most important levels.
3- Dynamic Confidence Zones
The indicator adds zones around support and resistance levels based on the Average True Range (ATR), helping traders visualize the ranges in which the price may interact with these levels.
The width of these zones can be adjusted using the ATR multiplier.
4- Assessing the Strength of Levels
The indicator calculates the strength of each level based on trading volume, the number of times the level has been tested (Touch Count), and the proximity of the current price to the level.
A strength score (from 0 to 100) is displayed next to each level if this feature is enabled.
5- Breakout Probability
The indicator estimates the probability of breaking each level based on momentum (ROC), the strength of the level, and the distance between the current price and the level.
The probability is displayed as a percentage if the option is enabled, helping traders anticipate potential moves.
6- Historical Liquidity Analysis
The indicator measures liquidity around each level based on the trading volume in the ranges near it.
The liquidity values can be displayed in the labels or used to adjust the width of the lines (the most liquid lines appear wider).
7- Price Targets
When this feature is enabled, the indicator calculates price targets for breakout and reversal based on momentum, level strength and ATR.
These targets can be displayed as text in the labels or as horizontal lines on the chart.
8- Fibonacci Levels
The indicator plots Fibonacci levels (0.0, 0.236, 0.382, 0.5, 0.618, 0.786, 1.0) based on the highest and lowest price in the lookback period.
The user can choose which of these levels to display or hide.
9- Comprehensive Breakout Alert
The indicator provides a single alert that includes all levels, where the alert is triggered when the price breaks any support or resistance level with a message explaining the type of breakout and the level broken.
How the indicator works
Step 1: The indicator identifies the bars with high volume during the specified Lookback Period.
Step 2: Draws support and resistance levels based on the highest and lowest prices in those bars, taking into account the number of lines selected by the user.
Step 3: Apply the trend filter (if enabled) to reduce the number of levels in case of a strong trend.
Step 4: Adds additional analyses such as strength, liquidity, breakout probability, and price targets, and draws confidence zones and Fibonacci levels according to the settings.
Step 5: Monitors the price and triggers an alert when the breakout occurs.
Customizable Settings
1- Lookback Period: Number of bars to analyze (default 300).
2- Number of Lines: From 1 to 6 support and resistance levels.
3- Colors and Styles: Line colors and styles can be changed (filled, dashed, dotted).
4- Labels: Enable/disable labels, their size, location, and text color.
5- Trend Filter: Enable/disable ADX, and modify its length and threshold.
6- Confidence Zones: Enable/disable, and modify the ATR length and multiplier.
7- Strength and Breakout Probability: Enable/disable the display, and modify the ROC length.
8- Liquidity: Enable/disable the effect of liquidity on the display of the lines and their values in the labels.
9- Price Targets: Enable/disable the targets and display them as lines.
10- Fibonacci: Choose the displayed levels and the color of the lines.
Indicator Benefits
High Accuracy: It relies on trading volume to determine the levels, which makes it more reliable than random levels.
Flexibility: It provides extensive customization options that allow traders to adapt it to their strategies.
Comprehensive Analysis: Combines support and resistance, trend, liquidity, and targets in one tool. Ease of Use: Labels and alerts make it easy to follow the market without complexity.
Labels next to each support and resistance level contain accurate numbers and information that reflect the market situation. These labels are not just decorations, but analytical tools that help traders make informed decisions based on market data. In this explanation, we will review each number or value that appears in the labels and their practical meaning.
Label Components
Labels appear next to each support and resistance level and begin with the letter "S" for support or "R" for resistance, followed by a set of numbers and values that can be enabled or disabled according to the user's settings. Here is a breakdown of each element:
1- Touch Count
Symbol: Appears immediately after "S" or "R" (example: "R: 5" or "S: 3").
Meaning: Indicates the number of times the price has tested this level without breaking it.
Benefit: The more touches, the stronger and more important the level. For example, if it is "R: 5", it means that the price has bounced off this level 5 times, making it a potentially strong resistance.
2- Strength Rating
Symbol: Appears between square brackets (example: " ").
Meaning: A value from 0 to 100 that reflects the strength of the level based on factors such as trading volume, number of touches, and proximity of the current price to the level.
Benefit: High values (such as 75 or more) indicate a strong level that is difficult to break, while low values (such as 30 or less) indicate a weak level that is easy to break. A trader can use this to determine the most reliable levels.
3- Breakout Probability
Symbol: Starts with the letter "B" followed by a percentage (example: "B: 60%").
Meaning: A percentage from 0% to 100% that shows the probability of the price breaking the level based on the current momentum, the strength of the level, and the distance between the price and the level.
Interest: A high percentage (such as 60% or more) means that the price may soon break through the level, while low percentages (such as 20%) indicate that the price may bounce. This is useful for anticipating the next move.
4- Liquidity Value
Symbol: Starts with the letter "L" followed by a number (example: "L: 1200").
Meaning: Represents the average trading volume in the range near the level, reflecting historical liquidity around it.
Interest: High values indicate high liquidity, meaning that the price may react strongly to this level (either by bouncing or breaking through). Low values indicate low liquidity, which may make the level less influential.
5- Price Targets
Symbol: Starts with "BT" (breakout target) and "RT" (rebound target) followed by numbers (example: "BT: 150.50 RT: 148.20").
Meaning:
BT (Breakout Target): The potential price that the price may reach after breaking the level.
RT (Reversal Target): The potential price that the price may reach if it rebounds from the level.
Utility: Helps traders identify potential exit points after a breakout or rebound, making it easier to develop an accurate trading plan.
Working examples
Resistance label: "R: 4 B: 25% L: 1500 BT: 155.00 RT: 152.00"
Level tested 4 times, strength 80 (very strong), probability of breakout 25% (low, i.e. higher probability of rebound), liquidity 1500 (high), breakout target 155.00, rebound target 152.00.
Conclusion: The level is strong and the price is likely to rebound from it, but if it breaks, it may reach 155.00.
Support Label: "S: 2 B: 70% L: 800 BT: 145.00 RT: 147.50"
Level tested twice, Strength 40 (medium to weak), Breakout Probability 70% (high), Liquidity 800 (medium), Breakout Target 145.00, Rebound Target 147.50.
Conclusion: The level is weak and the price is likely to break it to drop to 145.00.
How to use labels
Determine strength and weakness: Use the level's strength to see if the level is reliable for a bounce or vulnerable to a breakout.
Predict the move: Look at the Breakout Probability to determine whether to wait for a breakout or a bounce.
Risk Management: Use price targets (BT and RT) to set take profit or stop loss points.
Liquidity Evaluation: Focus on levels with high liquidity as they are often key turning points in the market.
Analysis Confirmation: Combine the number of touches with strength and liquidity to get a complete picture of the level’s importance.
Customize Labels
The user can enable or disable any of these values (strength, probability, liquidity, targets) from the indicator settings.
The size of the labels (small, normal, large), their position (right, left, top, bottom), and the color of the text can also be changed to suit your needs.
The labels in this indicator act as a small dashboard next to each support and resistance level, providing you with instant information about its strength, probability of breakout, liquidity, and price targets. By understanding these numbers, you can improve your trading decisions, whether you are looking for entry points, exit points, or risk management. If you want a tool that combines simplicity with analytical depth.
Disclaimer:
The indicator is an auxiliary tool only and should be used in conjunction with technical and fundamental analysis for best results.
Disclaimer
The information and posts are not intended to be, or constitute, any financial, investment, trading or other types of advice or recommendations provided or endorsed by TradingView.
