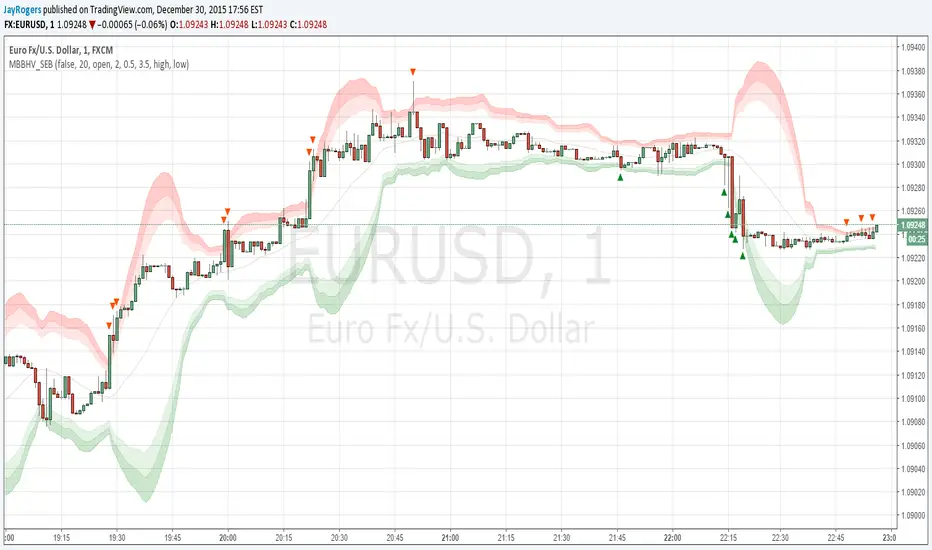
Multi BB Heat Vis - SMA/EMA/Breakout - r2I don't expect to iterate any further on this script, unless any weird issue crops up.
Description and usage detailed in the comments at the top of the script. Cheers!
To repaint or not to repaint, all the relevant sources are exposed as inputs for customisation - so the choice is yours.
Cheers!
Signal
[RS]Linear Regression Bands V2EXPERIMENTAL:
added titles to inputs and plots for better understanding what is what(DCC)
M = middle, T = top, B = bottom, S = signal.

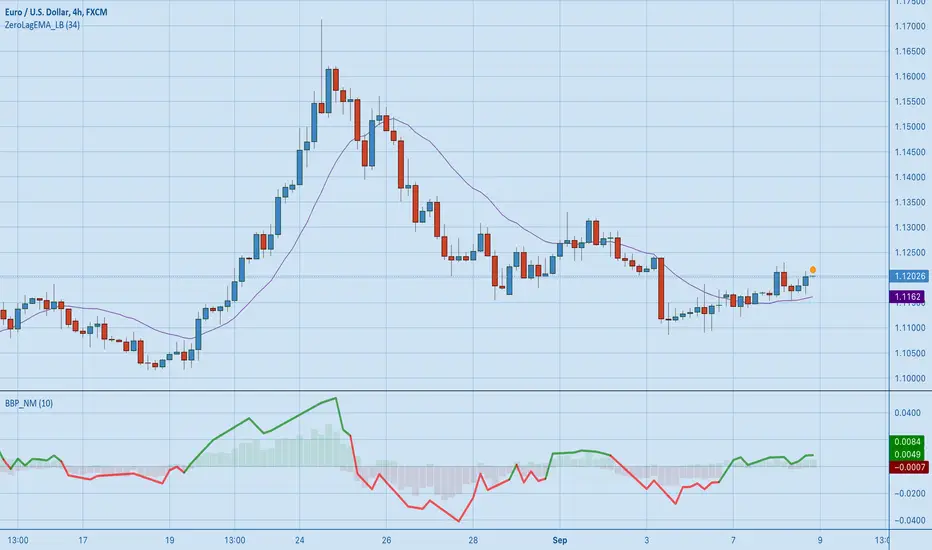
[RS][NM]Improved Linear Regression Bull and Bear Power v01The base code for this indicator was created by RicardoSantos
What I added is a signal line that indicates when to buy and when to sell.
Advised use :
Combine with a zero-lag indicator like ZeroLagEMA_LB by LazyBear (suggested period = 34)
Then use the following Rules of engagement :
Current price > ZLEMA & Signal line of BBP_NM is green : BUY
Current price < ZLEMA & Signal line of BBP_NM is red : SELL Please click the like button if you dig this indicator !
TonyUX EMA Scalper - Buy / SellThis is a simple scalping strategy that works for all time frames... I have only tested it on FOREX
It works by checking if the price is currently in an uptrend and if it crosses the 20 EMA.
If it crosses the 20 EMA and its in and uptrend it will post a BUY SIGNAL.
If it crosses the 20 EMA and its in and down it will post a SELL SIGNAL.
The red line is the highest close of the previous 8 bars --- This is resistance
The green line is the lowest close of the previous 8 bars -- This is support

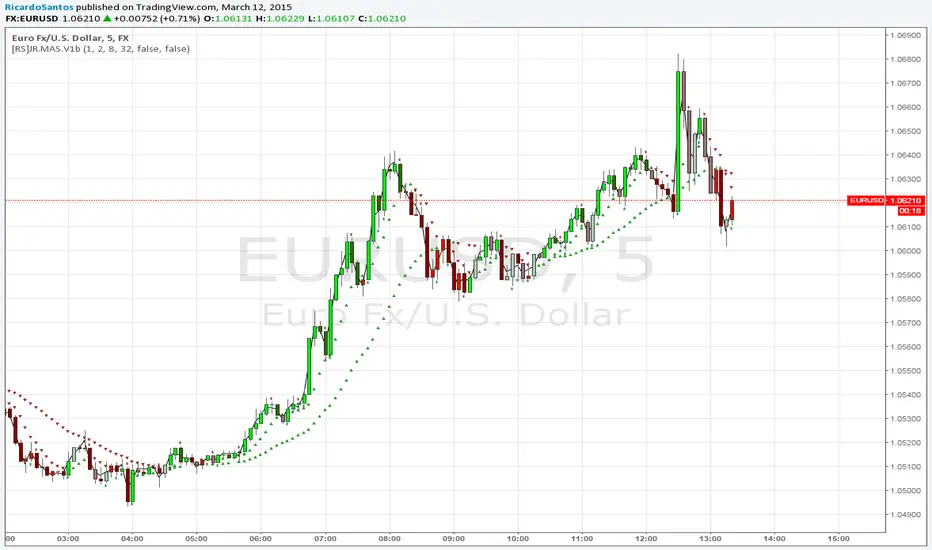
[RS]JR Moving Average System V1.bupdate: changes to code, ma's now split over 3 sets fast, medium and slow, removed cloud and sl_lines(no use?), ma's visually display as shapes :p added option to toggle the ma's on/off.
RN MACD SignalsThis is my simple way to quickly see MACD signals without having the MACD taking up space. The one at the bottom is for display to show how this works. A crossover occurs when the arrow flips over. The position of the arrow tells you if it is currently above or below the zero line. You can change the script to overlay and have it show up above or below price also. Let me know what you think.

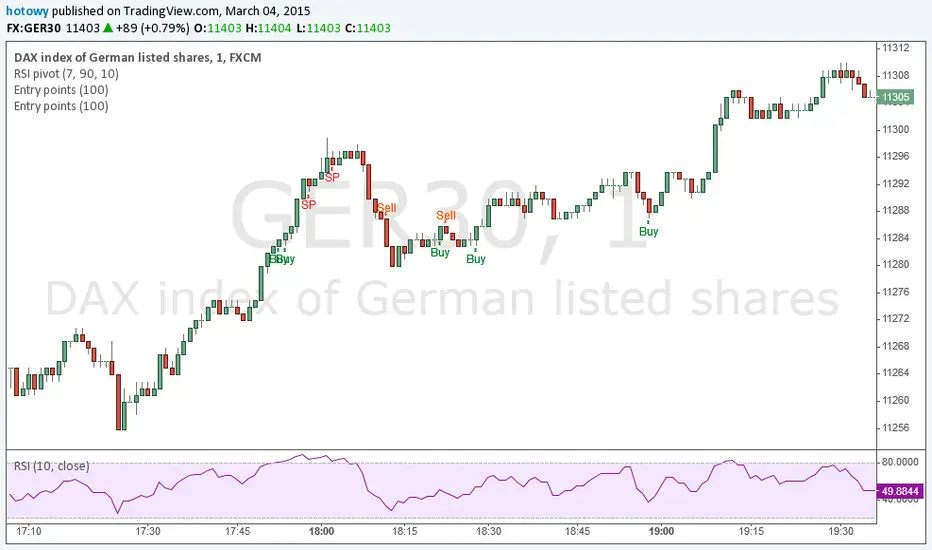
Entry pointsThis great and simple indicator based on EMA generates information about entry points at close of the candle. First signal is the best entry point but you can re-enter at the next. IMPORTANT: this script does not generate exit signals and those shoud be find using money management rules or else. Perfectly catches long runs in trends at all underlayings (forex, stocks, indexes, commodities) at all timeframes. Period=100 works best independently on timeframe but I encourage you to try other. Lower period gives more incorrect signals and shorter runs, higher period gives you late entry and less. Ofcourse it gives false signals from time to time but fortunately it makes a correction very fast. Try it! Good luck and good traiding!
Patrick's Buy HistogramSet up a trailing stop at about 0. Look for the red dots.and that's a good point to enter a long trade.

MAGNUS® CyclesThis indicator will help you if you struggle making any profit in bitcoin.
It generates very few signals with very nice profit potential ( around 100% this year ! ).
Perfect tool for longterm swing traders and new traders that need help figuring out the midterm trend.
Use it with these parameters only:
weekly: 13, 5, 12
daily: 92, 21, 96

MAGNUS™A CHANGE of background color indicates a trade opportunity :
Cyan background = BUY
Purple background = SELL
The bullish signals seem to be better than the bearish ones.
Based on the "Willy" indicator.
Don't change the parameters unless you fully understand the consequences.
Use with brains and caution :)

Bill Williams. Awesome Oscillator (AC) Signal Line This indicator plots the oscillator as a histogram where blue denotes
periods suited for buying and red . for selling. If the current value
of AO (Awesome Oscillator) is above previous, the period is considered
suited for buying and the period is marked blue. If the AO value is not
above previous, the period is considered suited for selling and the
indicator marks it as red.
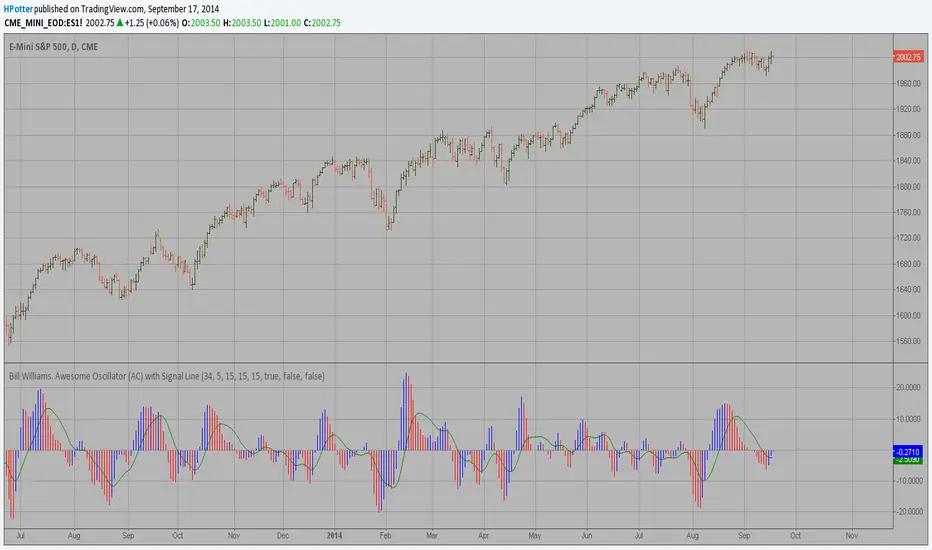
Bill Williams. Awesome Oscillator (AO) Signal Line This indicator is based on Bill Williams` recommendations from his book
"New Trading Dimensions". We recommend this book to you as most useful reading.
The wisdom, technical expertise, and skillful teaching style of Williams make
it a truly revolutionary-level source. A must-have new book for stock and
commodity traders.
The 1st 2 chapters are somewhat of ramble where the author describes the
"metaphysics" of trading. Still some good ideas are offered. The book references
chaos theory, and leaves it up to the reader to believe whether "supercomputers"
were used in formulating the various trading methods (the author wants to come across
as an applied mathemetician, but he sure looks like a stock trader). There isn't any
obvious connection with Chaos Theory - despite of the weak link between the title and
content, the trading methodologies do work. Most readers think the author's systems to
be a perfect filter and trigger for a short term trading system. He states a goal of
10%/month, but when these filters & axioms are correctly combined with a good momentum
system, much more is a probable result.
There's better written & more informative books out there for less money, but this author
does have the "Holy Grail" of stock trading. A set of filters, axioms, and methods which are
the "missing link" for any trading system which is based upon conventional indicators.
This indicator plots the oscillator as a histogram where periods fit for buying are marked
as blue, and periods fit for selling as red. If the current value of AC (Awesome Oscillator)
is over the previous, the period is deemed fit for buying and the indicator is marked blue.
If the AC values is not over the previous, the period is deemed fir for selling and the indicator
is marked red.
