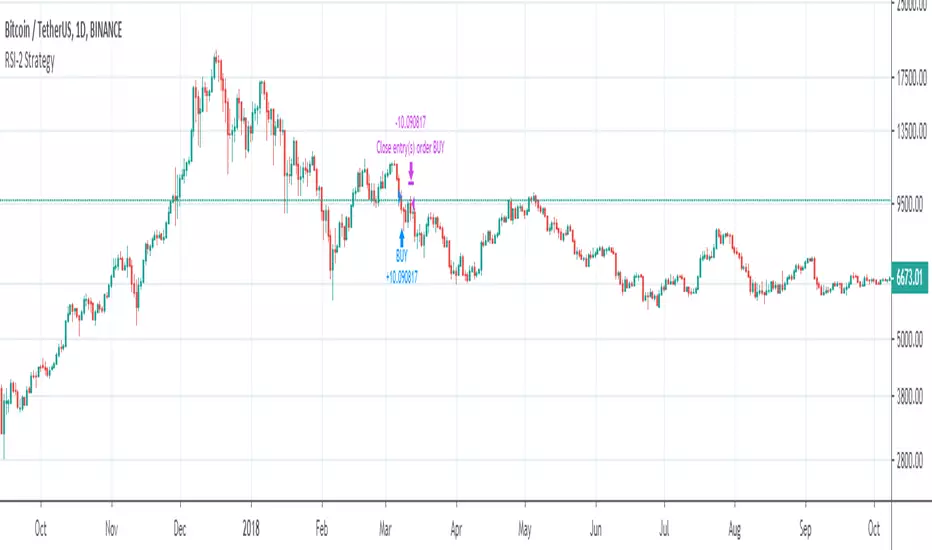
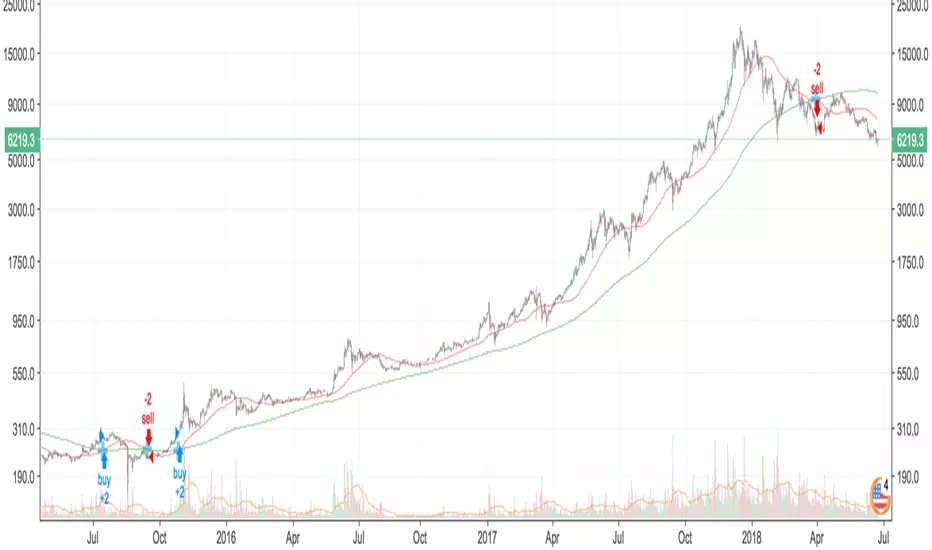
Double 7's StrategyStrategy described in the book "Short Term Trading Strategies that Work", written by Larry Connors and Cesar Alvarez.
It is the simplest strategy I know and has only 3 rules:
- Price must be above the arithmetic moving average of 200 periods.
- Buy when the price closes below the closing of the last 7 days.
- Sale when the price closes above the closing of the last 7 days.
Simple as it may seem, this strategy works very well in some stocks and/or graphical times (in some stocks it overcomes many RSI 2 strategies). It was developed for the daily chart and does not usually work well on weekly or monthly charts, but can be used for day trades if the back-test proves to be favorable.
If you want, you can change the input and output rules by setting other values for the input or output period and thus find more positive results for specific stocks.
There is no stop loss because in tests the stop loss usually reduces the gains of the strategy.
Good luck and good trades.
================================
Estrategia descrita no livro "Short Term Trading Strategies that Work", escrito por Larry Connors e Cesar Alvarez.
É a estratégia mais simples que eu conheço e tem apenas 3 regras:
- Preço deve estar acima da média móvel aritmética de 200 períodos.
- Compre quando o preço fechar abaixo do fechamento dos ultimos 7 dias.
- Venda quando o preço fechar acima do fechamento dos ultimos 7 dias.
Por mais simples que pareça, esta estratégia funciona muito bem em alguns papeis e/ou tempos gráficos (em alguns papeis a mesma supera muitas estratégias pelo IFR2). A mesma foi desenvolvida para o gráfico diário e normalmente não funciona muito bem em gráficos semanais ou mensais, mas pode ser utilizado no intraday caso o backtest se mostre favorável.
Caso você queira, é possível alterar a regra de entrada e saída definindo outros valores para o período de entrada ou saída e assim encontrar resultados mais positivos para cada papel.
Não existe stop loss pois nos testes normalmente o stop loss reduz os ganhos da estratégia.
Boa sorte e bons trades.
Media mobile semplice (SMA)

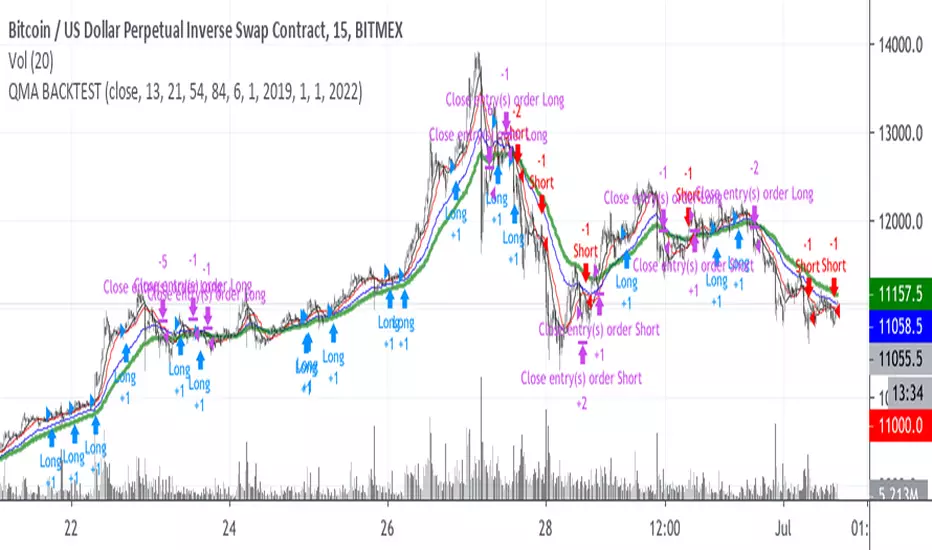
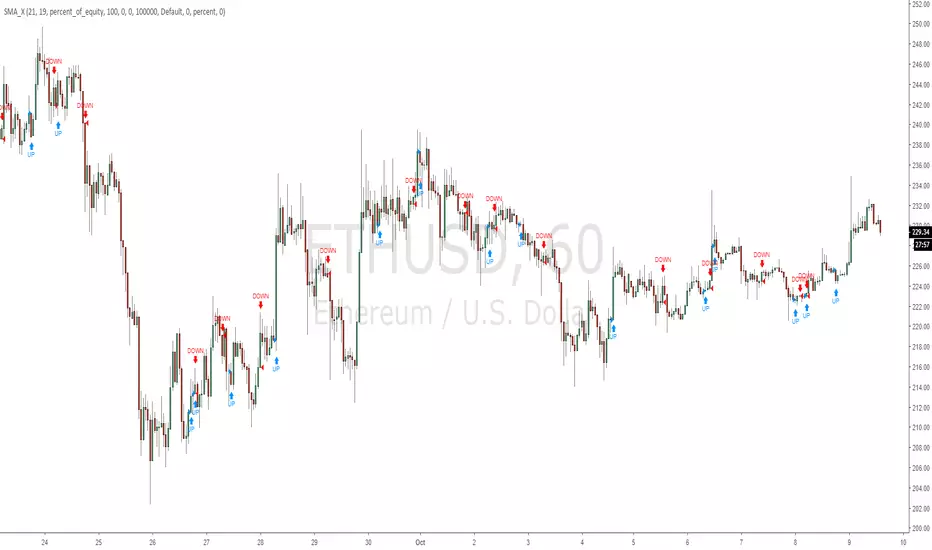
[M10] Quad MA Trend ScalperFour adjustable moving averages set in order to produce buy and sell signals, works best on smaller timeframes from my backtesting, 10M - 30M seems optimal for scalping.
The idea behind this script is to only enter positions that are following the trend in order to minimise drawdown and decrease risk when using leverage.
The script will only enter long positions when MA crossover occurs above the Long MA 2.
The script will exit a long position when MA Short crosses below Long MA 1.
The script will only enter short positions when MA cross under occurs below the Long MA 2.
The script will exit a short position when MA Short crosses below Long MA 1.

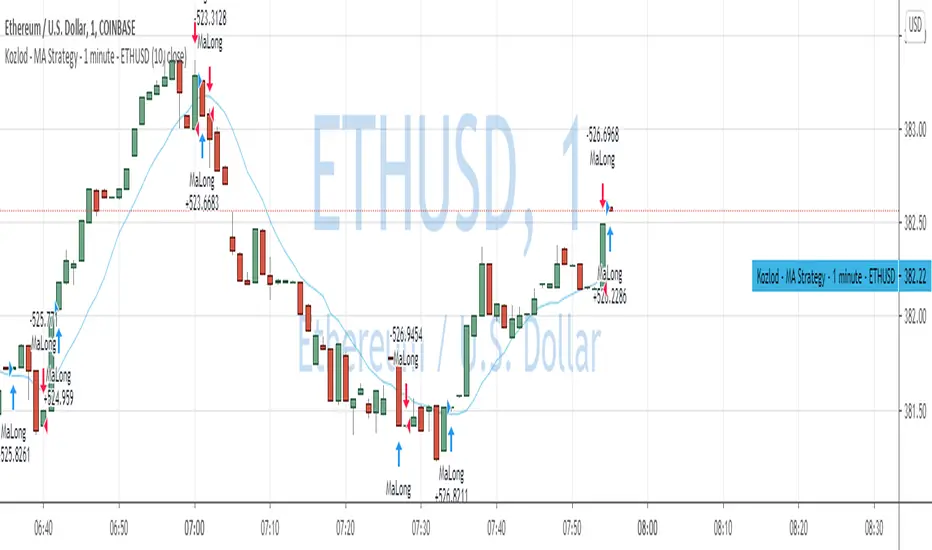
QuantNomad - MA Strategy - 1 minute - ETHUSDInteresting performance for simple MA strategy on 1m ETHUSD. I used only close price and 15 SMA in it.
Performance is 55% over 10 days with a drawdown of only 3.5%.
Percent profitable is only 30% with almost 2k trades.
For sure this won't work as a standalone strategy, with 2k trades commission and slippage will destroy all your PNL but it can be a pretty good base for a more complicated strategy with good filters.
And remember:
Past performance does not guarantee future results.
Custom Band Strategy1. Trend
if ema200 > ema30 Long entry only
else Short entry only
2. Custom Band
Upper band = sma(period) + max(close, period) * multiplier
Lower band = sma(period) - max(close, period) * multiplier
Multiplier can be either 1.3 or 1.1 depending on the trend.
(If trend is long, upper band's factor would be 1.3, lower band be 1.1)
2. Long entry condition
- Cross over the lower band and band width is greater than (close price)*2.2%(assume this band width as an expected ROE)
- Previous candle change rate((close-open)/open*100) is less than 3%.
3. Short entry condition
- Cross under the upper band and band width is greater than (close price)*2.2%
- Previous candle change rate is less than 3%.
4. Long/Short exit condition
- cross over/under the lower/upper band and roe is higher than 2%.
5. Stop/Target condition
- Target 10%, Stoploss 3%
- Previous candle change rate is higher than 3%.
Most variables can be set manually.
Test period changeable.

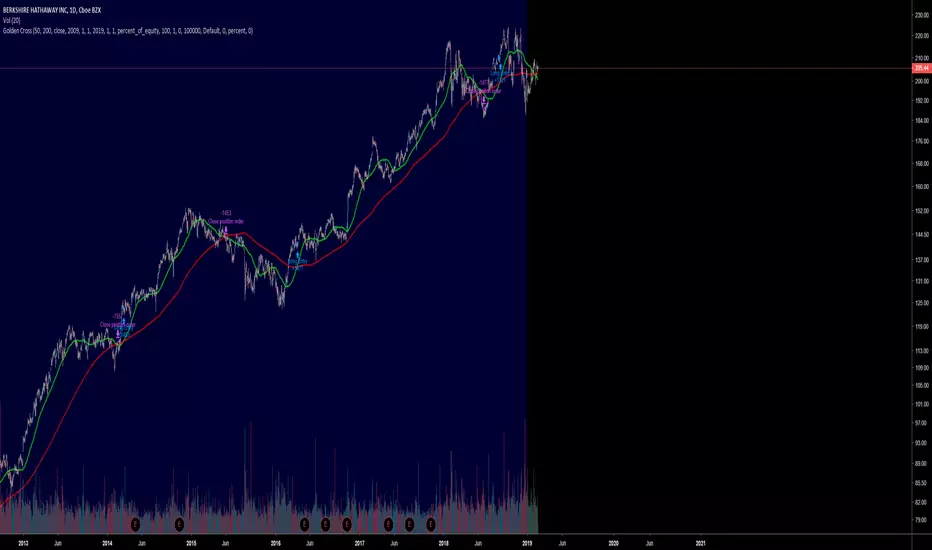
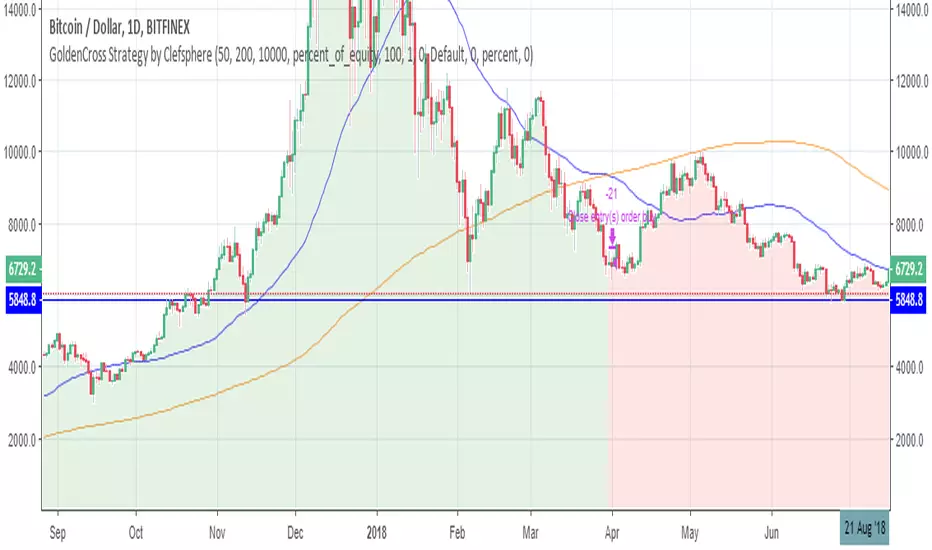
Dumb Strategy 2 - Golden CrossThe Golden Cross is one of the simplest market indicator who helps long term investors to entry a position.
With that in mind, I made a very easy to understand backtest showing how much we could earn if we entered in a Golden Cross and exit when Death Cross happening.
Take this code and try in your favorite market.
Of course, never use only this indicator to trade.
MACD/EMA Long StrategyThis incredibly simple strategy uses a combination of the 20 EMA and bullish/bearish MACD crosses as a low risk method of getting in and out of markets.
Depending on whether the market is above or below the 200 SMA, the script determines if the market is in bullish or bearish territory. Above the 200 SMA, the script will ignore the 20 EMA as a buy condition and buy solely on the confirmation of a bullish MACD cross upon the close of a candle. In this bullish market, the script will only enable the sell condition if both the MACD is bearish AND a close below the 20 EMA occurs. This is to reduce the chances of the script selling prematurely in the event of a bearish MACD cross, if the market is still in overall bullish territory.
When the market is below the 200 SMA, the confirmation occurs in the opposite direction. The buy condition will only be met if both the MACD is bullish AND a close above the 20 EMA occurs. However, the sell condition ignores the 20 EMA and will sell solely on the confirmation of a bearish MACD cross upon the close of the candle.
This strategy can be used in both bullish and bearish markets. This conservative strategy will slightly underperform in a bull market, with the sell condition occasionally being met and then potentially buying back higher. However, it will successfully get you out of a turning market and automatically switch into a more 'risk-off' mentality during a bear market. This strategy is not recommended for sideways markets, as trading around the 20 EMA coupled with a relatively flat MACD profile can cause the strategy to buy the peaks and sell troughs easily.

RSI2 ScaplingRule
1. Price is above its 200-period moving average
2. The 2-period RSI of price closes below 5
3. Buy price on the close
4. Exit when price closes above its 5-period moving average

CS: 2 Moving Averages Script - Strategy (Testing)2 Moving Averages Trading Script - Strategy Version (For Backtesting)

Ichimoku+SMAsmoothedSMA_smoothed with Ichimoku added makes good yet still simple strategy perhaps useful to APIbot programmers

TDI - Traders Dynamic Index - Roshan [Mehdi]This method is based on Mr. Roshan's technique which use TDI with upper timeframe

SimpleMA smoothed crossover strategyExperimental simple Bot script for ETH/USD 1 hour chart. welcome to test on other pairs. put feedback in comments.
This is a crossbreed between SMA and HULLMA
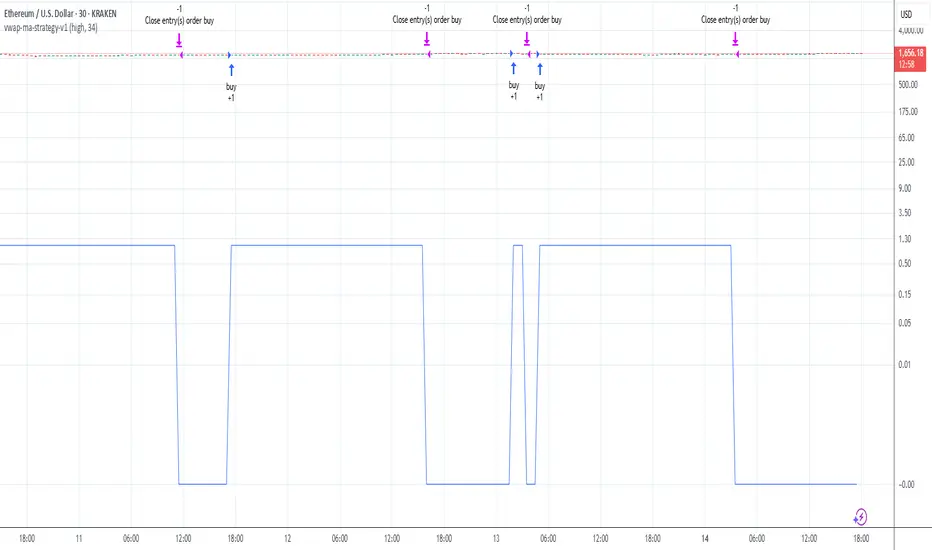
vwap-ma-strategy-v0.7This strategy was inspired by my Israeli fellow iAtiya.
I love it because it's my first pine v3 script that actually works.
Powerful with respect to it's simplicity.
Average DownThis strategy has been published for a Pyramiding tutorial on the Backtest Rookies website.
For a full overview of the code and an introduction to Pyramiding check out our site.
Summary
The code example will create a simple script that allows us to average down whenever our portfolio is down x%. The idea will be to bring our average cost down so that we can still exit with a profit when conditions improve. With this in mind, the strategy shall also have a simple take profit exit at x% above our average price.
Inputs
Target Loss to Average Down (%) : This is the target percentage level will trigger us to average down. In other words, if we have a close below this level from our average buying price, we will average down.
Target Take Profit : A standard take profit percentage level. Use this to set how much profit you will target.
% Of Current Holdings to Buy : Is the number of shares/contracts we will aim to buy when we average down. 50 will mean we buy 50% of our current holdings. So if we have 100 shares, then we buy 50 when we average down.
SMA Period : Defines our SMA lookback period. Our strategy will enter the first/initial position when we have a close above our SMA level.

GoldenCross Strategy by ClefsphereGolden cross when 50SMA crosses 200SMA. Can be used for any market. Day time frame is ideal.
14/28 Day SMA Divergence and RSI - No RepaintIf you are interested in purchasing my algorithmic trading bot that receives Tradingview indicator alerts via email and then executes them in Bittrex, please visit my product page here: ilikestocks.com Additionally, I would love to create video/blog guides on creating Tradingview scripts or strategies. If you are a knowledgeable in finance or other related fields and would like to be featured on my page, please contact me at tanner@ilikestocks.com.
No crossovers were used in this script, and this is likely the reason for the no repaint(Correct me if wrong).
This strategy script uses a 14-day SMA signal line, a 28-day SMA and RSI. The strategy works by determining whether the (14-day SMA is above the 28-day SMA and the RSI levels are overbought(below 30)) or RSI is very overbought(below 13 or so). Once either of these conditions have been met, a long position is opened.
The initial long position must be partially closed by the take profit first and then the final close is executed if the 14-day signal SMA is below the 28-day SMA; you may also exclusively use take profit to close positions.
The green plotted spikes are the initial long position conditions. The orange plotted spikes are take profit signals once a long position is opened. The red plotted spikes are plotted when the SMA 14-day is below the 28-day SMA.
Please do leave constructive criticism or comments below because it helps me better create scripts!

BB limitMarket maker strategy using Bollinger bands as entry, moving average as close and simple stop-loss with percentage of entry position. It was extremely profitable in june on xbtusd.

Moving Average Mean Reversion StrategyA basic mean-reversion strategy. Shorts when the close is 10% above the MA, and goes long when it's 10% below the MA.
Script functionality test - work in progress (2RS + BB + MA)This is the first script I've written. Its sole purpose is to make me learn a bit of pine script. Its not intended to trade live.
Feel free to modify it if you wish and let me know if you do it. Also any comments are welcome!
Also i need help in two things:
1. Im unable to print the "in-strategy" rsi on chart
2. I want to ignore the first buy signal after each sell. I was looking to ad a counter to the signals but im unable to do it.
Any help will be greatly appreciated!

SMA Diff stratHello Tradingviewers
I don’t claim that anything I share is original, but I will never intentionally steal someone else’s work other than using plug and play pieces of code that are shared publicly
This strategy's code is the same from the previous "study" post that can be found here:
It's primarily made for back-testing
--------------------------------------------------------------------------
Indicator info:
In addition to the main entry/exit points marked in green/red circles, this indicator as many others can be used in more than one way, see the chart for details
Any kind of feedback is appreciated, coding advice and such…
Feel free to use and share but please no commercial use. Happy trading everyone
--------------------------------------------------------------------------
ETH/TUSD: 0xc66c009140553ef5dec23045399d9dcfddd096a5
LTC: LW4TP527c3HK6FnewXRZt3i6jnrhAynJMA
XVG: DE7uD66rYdmpqe4Fd3MxsXv7F1kNfCrzLk
