Linear Regression Slope HistogramThis is the slope of linear regression plotted as a histogram. It has a threshold for the slope in case there is a minimum slope amount that the user wants for it to show green or red. The color shows a dim and bright effect depending on the direction of the slope to better show its rise and fall. You can set the length of the slope in the input setting screen.
Some interesting things about linear regression slope that I found out: It kind of looks like the histogram of ADX or the directional movement lines depending on the length used for the slope. According to Tushar Chande, linear regression can be used as an alternative of finding trend direction, although it is hard to say what length to use for it, I haven't been able to figure out a good way to apply it yet. According to Bulkowski, linear regression of the volume can be used with certain chart patterns that he listed to increase their chance of success by taking trades where the linear regression line points towards, so if you use volume as a source on this indicator you can take trades in whatever said direction. Got any other ideas on how to use linear regression? Feel free to let me knows, would gladly appreciate it.
Slope

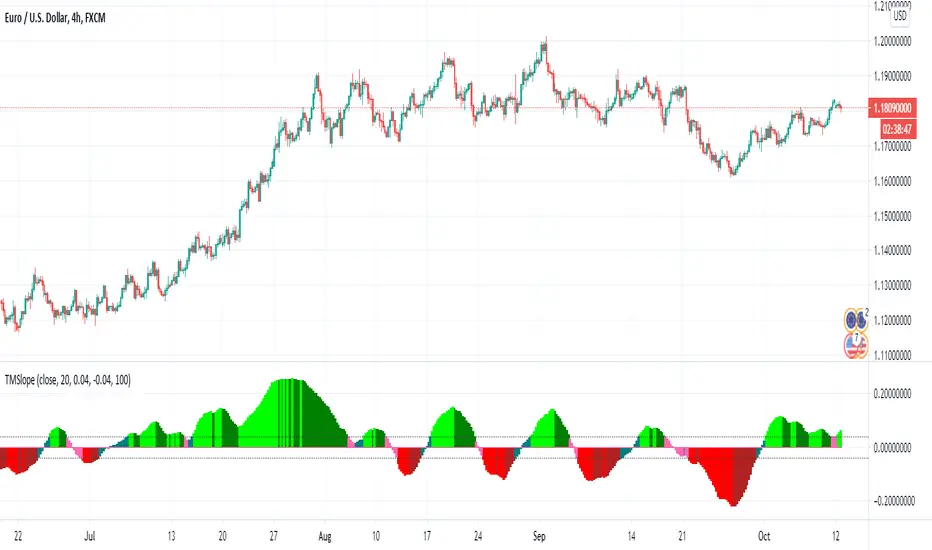
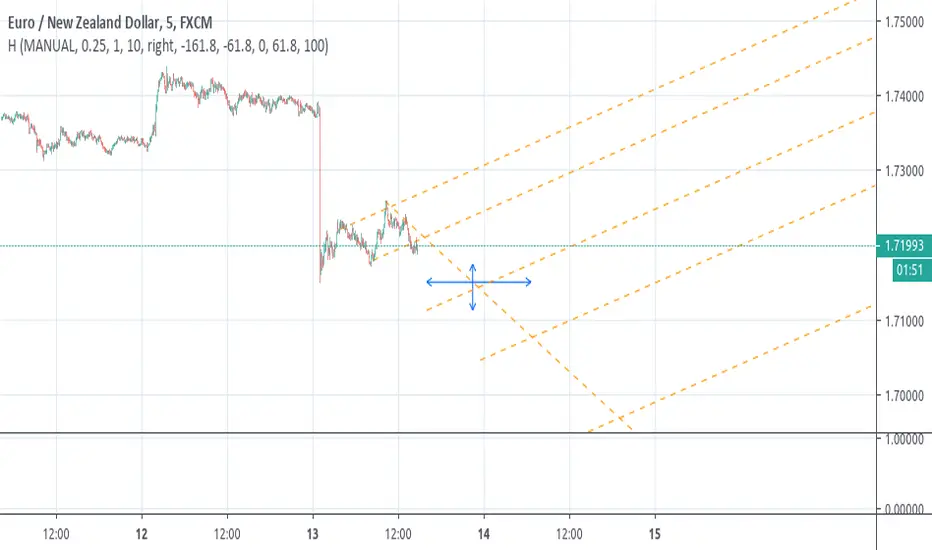
The TMA Slope - TMSlope Oscillator The TMA Slope oscillator is a simple slope of a Triangular Moving Average compared and normalized with the Average True Range of the last 100 periods (default setting).
This specific version add 2 triggers to give trading signals according to the slope:
- Above superior trigger, the trend is bullish, so trading is “Buy”
- Below inferior trigger, the trend is bearish, trading is “Sell”
- If the slope is included between these 2 levels, the market is probably ranging and no new orders should be initiated
3 MA w price slope The MA is indicating historical cost on the market.
This script will help you observe MA with price and slope.
This stript is inspired by LEI & LoneCapital.
All thanks to LEI.

Directional Movement IndexThis is a standard ADX DMI indicator with Background colour and the option to draw the Background colour of the next higher timeframe.

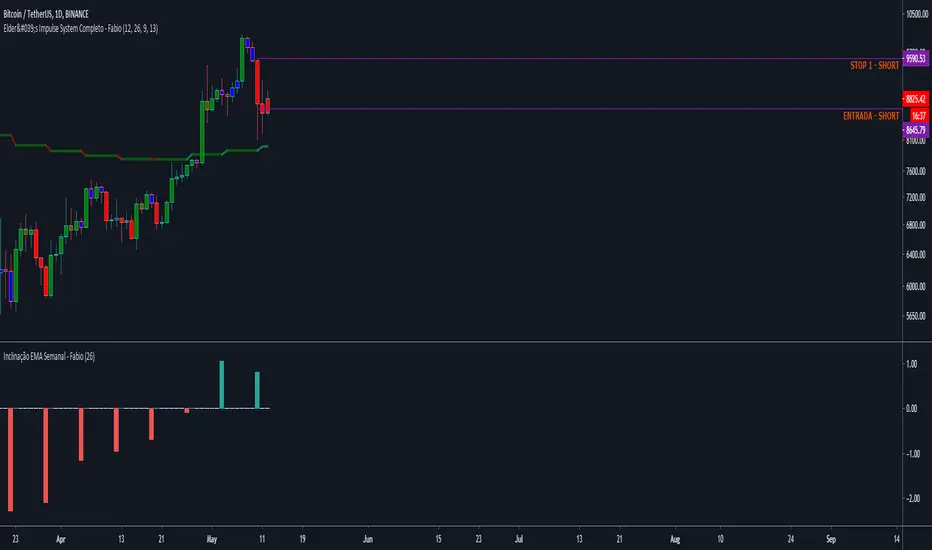
EMA Slope - ValenteThis indicator will show you the EMA SLOPE as a HISTOGRAM.
Este indicador mostra a INCLINACAO da EMA como um HISTOGRAMA

Leavitt Convolutions Multicator - Jay Leavitt, Ph.D.Hot off the press, I present this next generation "Leavitt Convolutions Multicator" employing PSv4.0, originally formulated by Jay Leavitt, Ph.D. for TASC - January 2020 Traders Tips. Basically it's an all-in-one combination of three Leavitt indicators. This triplet indicator, being less than a 60 line implementation at initial release, is a heavily modified version of the original indicator using novel techniques, surpassing Leavitt's original intended design.
Utilizing the "Power of Pine", I included the maximum amount of features I could surmise in an ultra small yet powerful package. Configurations are displayed above in multiple scenarios that should be suitable for most traders.
Features List Includes:
Dark Background - Easily disabled in indicator Settings->Style for "Light" charts or with Pine commenting
AND much, much more... You have the source!
For those of you who are new to Pine Script, this script may also help you understand advanced programming techniques in Pine and how they may be utilized in a most effective manner. Most notably, the script shows how to potentially combine three indicators in one with Pine. This is commonly what my dense intricate code looks like behind the veil, and if you are wondering why there is no notes, that's because the notation is in the variable naming.
The comments section below is solely just for commenting and other remarks, ideas, compliments, etc... regarding only this indicator, not others. When available time provides itself, I will consider your inquiries, thoughts, and concepts presented below in the comments section, should you have any questions or comments regarding this indicator. When my indicators achieve more prevalent use by TV members, I may implement more ideas when they present themselves as worthy additions. As always, "Like" it if you simply just like it with a proper thumbs up, and also return to my scripts list occasionally for additional postings. Have a profitable future everyone!

[RS][V4]ZigZag Percent Reversal - Helper - AntiSlopeEXPERIMENTAL:
A helper script to map the Anti derivative slopes.
EMA slopeA very simple script to get the slope of the EMA.
Can be used together with "Inverse Volatility" and "Support Resistance IV Finder" for optimal results

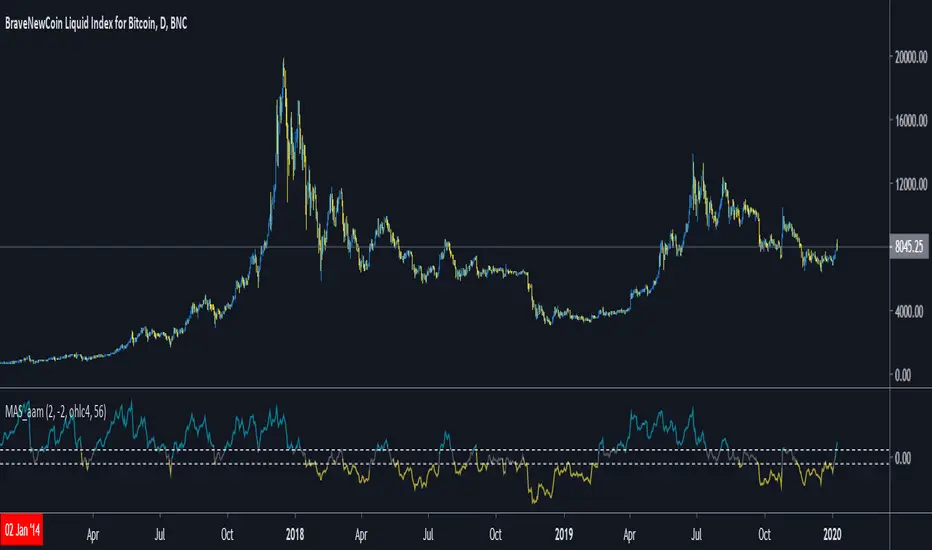
Moving Average Slope [aamonkey]This indicator tries to identify ranging and trending markets.
It measures the angle of a Moving Average in order to filter out ranging markets.
The idea is to only enter a trend following trade if the slope is steep enough.
In order to create this indicator, I used a strategy script from bennef called "Trend Angle BF" and slightly modified it to transform it from an entry/exit indicator to a filter.
The calculations are based on Evergrets "Jurik MA" and angle calculation by KyJ.
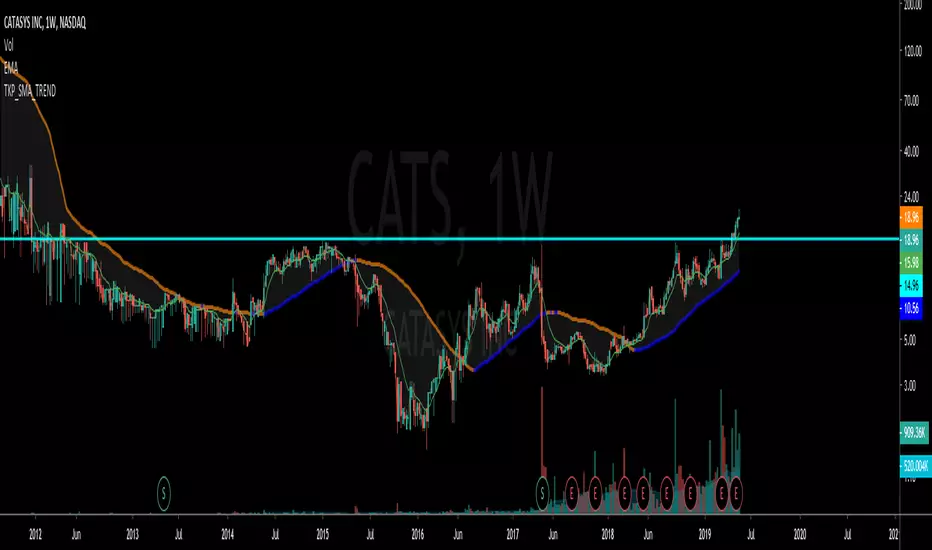
SMA_TKP_TREND SYSTEMI took the "EMA_TKP_TREND SYSTEM" and converted it to plot a simple moving average for the "slow moving average".
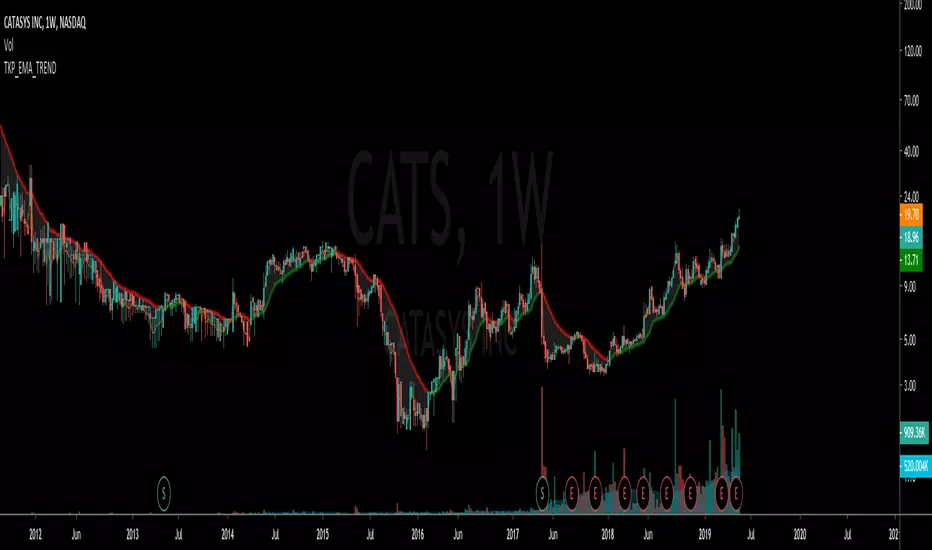
EMA_TKP_TREND_ SYSTEMThis script was cannibalized by another member on here (Kudos given in Script). I trimmed down the script and created this to give a visual representation of the changing slope on exponential moving averages.
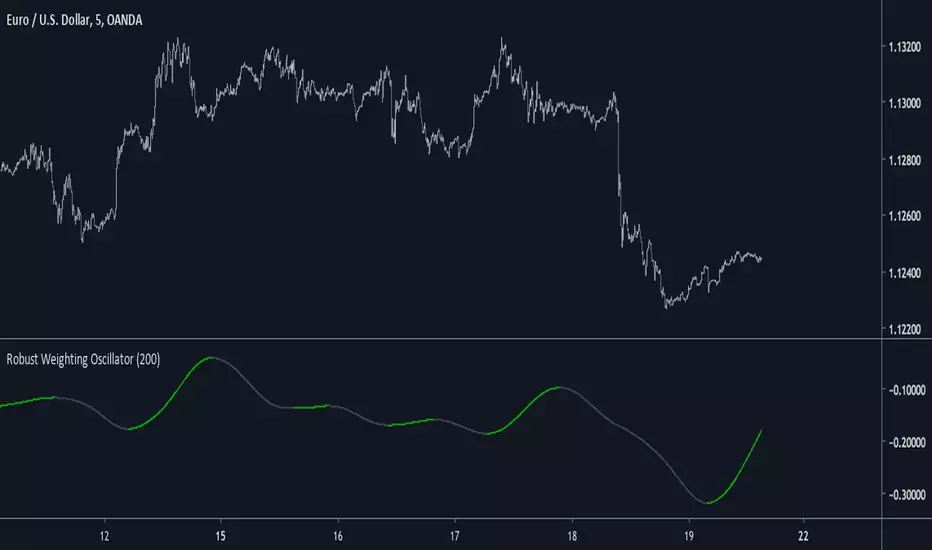
Robust Weighting OscillatorIntroduction
A simple oscillator using a modified lowess architecture, good in term of smoothness and reactivity.
Lowess Regression
Lowess or local regression is a non-parametric (can be used with data not fitting a normal distribution) smoothing method. This method fit a curve to the data using least squares.
In order to have a lowess regression one must use tricube kernel for the weightings w , the weightings are determined using a k-nearest-neighbor model.
lowess is then calculated like so :
Σ (wG(y-a-bx)^2)
Our indicator use G , a , b and remove the square as well as replacing x by y
Conclusion
The oscillator is simple and nothing revolutionary but its still interesting to have new indicators.
Lowess would be a great method to be made on pinescript, i have an estimate but its not that good. Some codes use a simple line equation in order to estimate a lowess smoother, i can describe it as ax + b where a is a smooth oscillator, b some kind of filter defined by lp + bp with lp a smooth low pass filter and bp a bandpass filter, x is a variable dependent of the smoothing span.
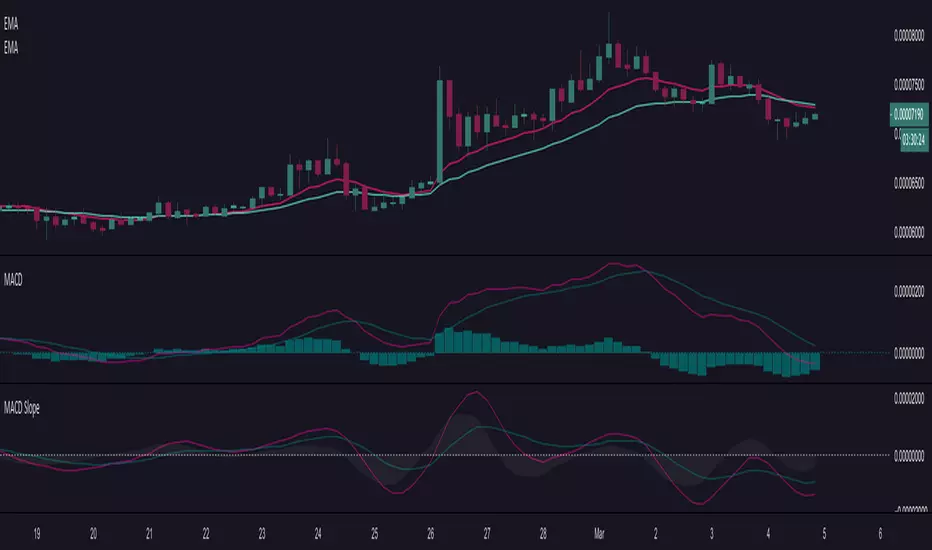
MACD SlopeShows slopes of macd line, signal line and histogram. A negative and rising slope shows improvement within a downtrend. A positive and falling slope shows deterioration within an uptrend.
Function for Least Squares Moving AverageThank you to alexgrover for putting me wide to this, after putting up with long conversations and stupid questions. Follow him and behold: www.tradingview.com
What is this?
This is simply the function for a Least Squares Moving Average. You can render this on the chart by using the linreg() function in Pine.
Personally I like to use the slope of the LSMA to help determine what direction to take a trade in, but I'm sure there are other, more exotic ways of using it and, if you know how to get your fingers dirty with Pine, you can create more exotic versions of it by modifying the function provided.
Want to learn?
If you'd like the opportunity to learn Pine but you have difficulty finding resources to guide you, take a look at this rudimentary list: docs.google.com
The list will be updated in the future as more people share the resources that have helped, or continue to help, them. Follow me on Twitter to keep up-to-date with the growing list of resources.
Suggestions or Questions?
Don't even kinda hesitate to forward them to me. My (metaphorical) door is always open.

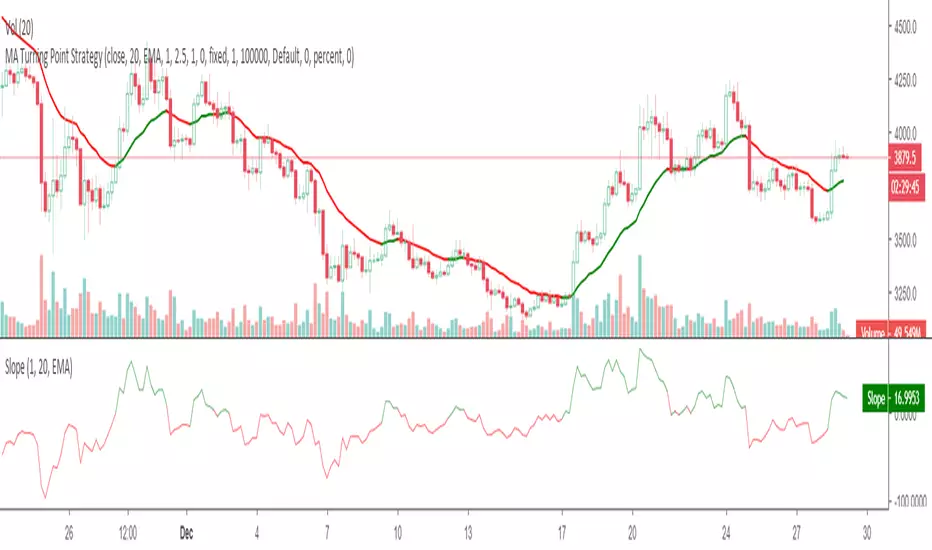
SlopeA simple slope indicator of common moving average types with the slope represented in degrees aligned with the trend angle tool on TV after reset chart.
Quadratic Regression Slope [DW]This is a study geared toward identifying price trends using Quadratic regression.
Quadratic regression is the process of finding the equation of a parabola that best fits the set of data being analyzed.
In this study, first a quadratic regression curve is calculated, then the slope of the curve is calculated and plotted.
Custom bar colors are included. The color scheme is based on whether the slope is positive or negative, and whether it is increasing or decreasing.

IO_EMA_Delta_OscillatorThis is a EMA Delta Oscillator: An attempt to show ranging markets based on the slope of the EMA.
Green = Bullish Market
Blue = Ranging Market
Red = Bearish Market
The EMA Slope is normalized to make it work like an oscillator with values between 0 and 1.
Bar colors show the oscillator colors, bar borders show the actual candle colors.
- Invsto
(sarangab)

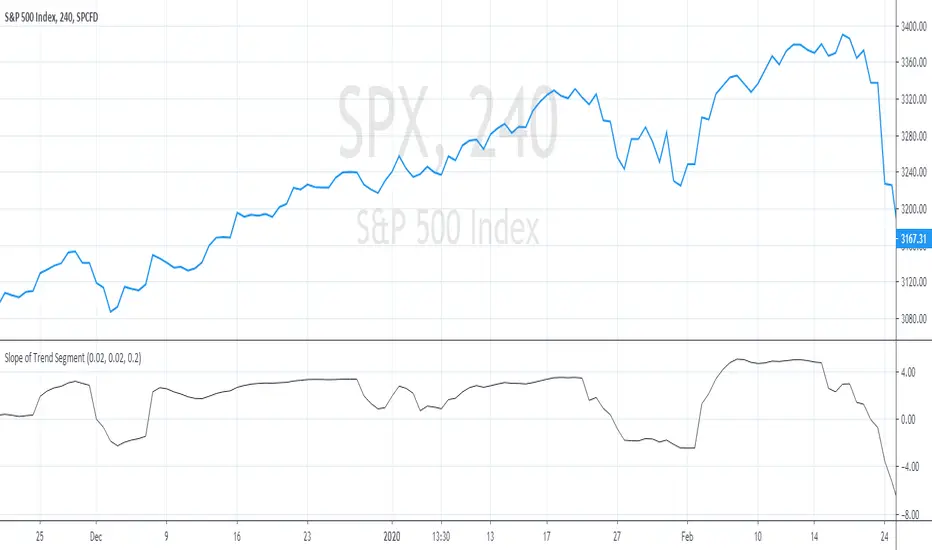
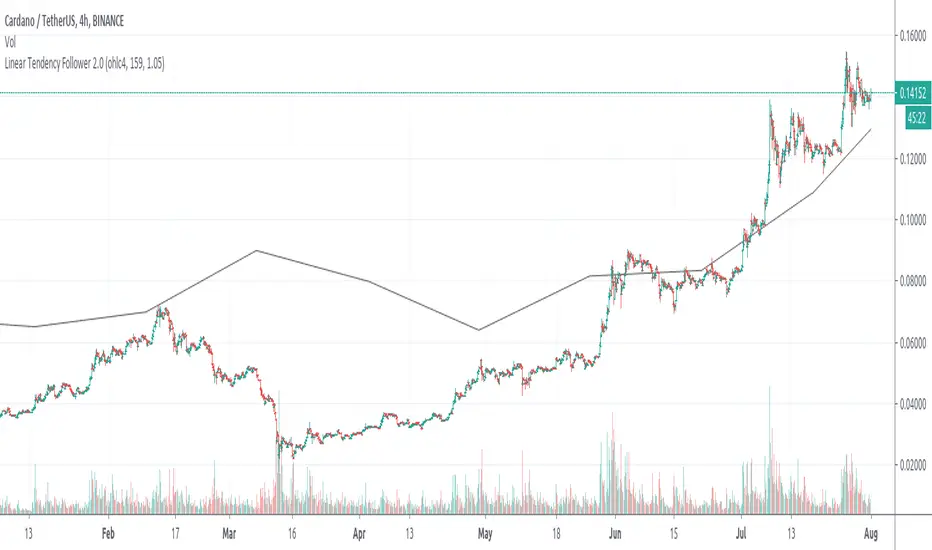
Linear Tendency FollowerLinear Trend Follower follows 'source' trend using lines within a number of periods ('length') using the last n periods source variation divided by 'length' as line slope. It is delayed by 'length' periods.
SMA slopeSlope function for SMA in degrees. This slope function you can use or modify for your own strategies. Feel free to change source to calculate the slope of another indicator. In this case you can see that the indicator is above the zero line indicating a positive momentum.

SMACDGraphs slope of ohlc4 MACD
When it =0, trend change
play with slow&fast lengths as well as the length used to calculate the slope.
-in progress(?)
Vertical lines in the image are as close as I could get them to SMACD=0.

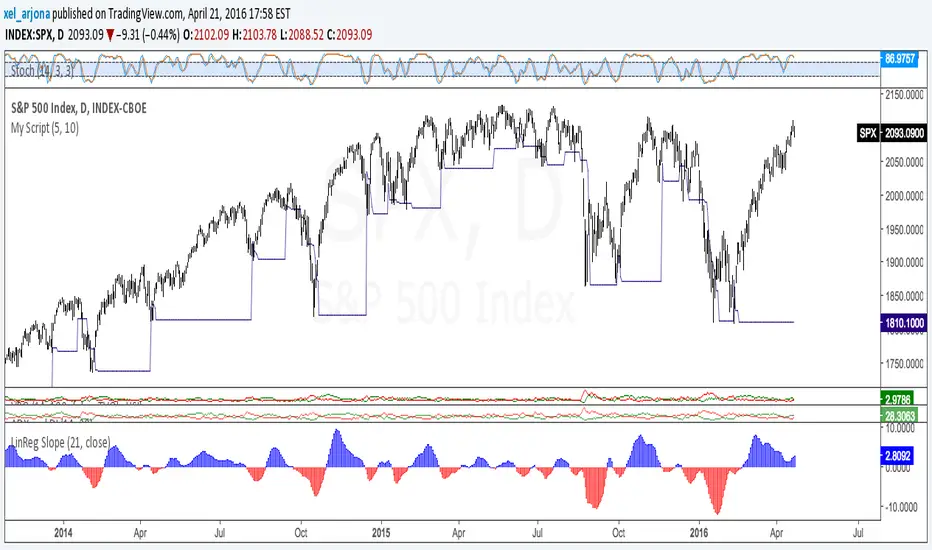
ORDINARY LEAST SQUARES Slope by @XeL_ArjonaORDINARY LEAST SQUARES Slope by @XeL_Arjona
Ver. 1 by Ricardo M Arjona @XeL_Arjona
DISCLAIMER:
The Following indicator/code IS NOT intended to be a formal investment advice or recommendation by the author, nor should be construed as such. Users will be fully responsible by their use regarding their own trading vehicles/assets.
The embedded code and ideas within this work are FREELY AND PUBLICLY available on the Web for NON LUCRATIVE ACTIVITIES and must remain as is.
WHAT'S THIS?
This is a REAL mathematically approach of an ORDINARY LEAST SQUARES LINE FITTING SLOPE as TradingView currently don't have a native one embedded, neither as a pine function. Other "Sope" indicators from this linear regression model I found on public library are currently based on "momentum" rather tan slope.
Any modifications or additions are quite welcome!
Cheers!
@XeL_Arjona