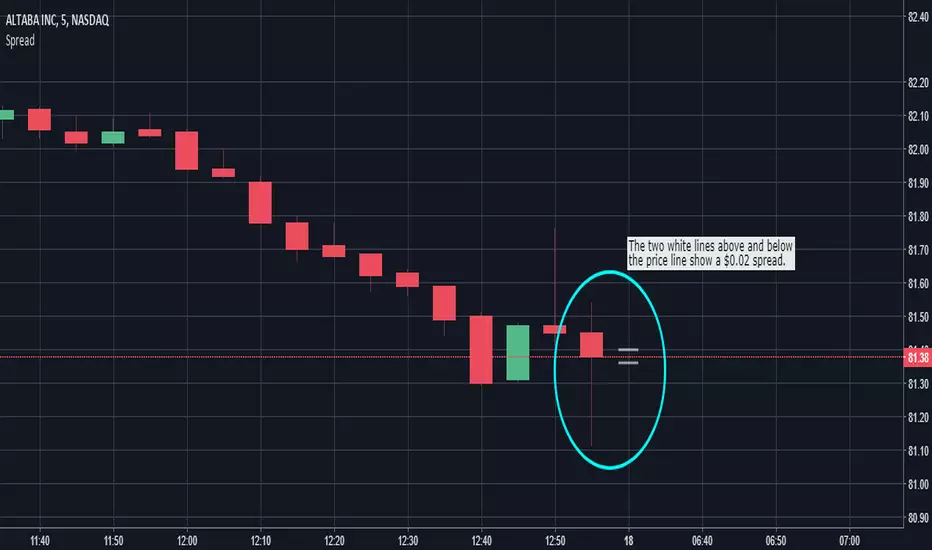
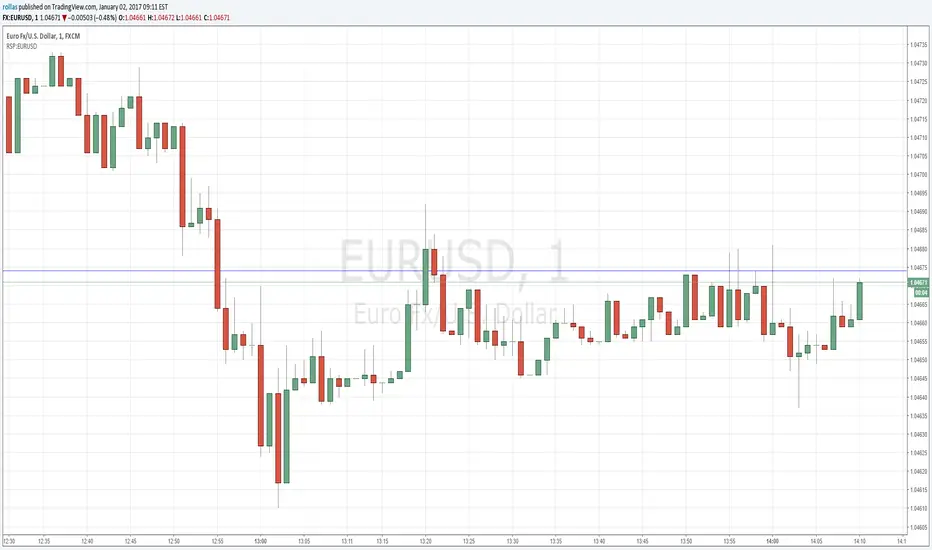
Spread VisualizerRelatively simple indicator to help you visualize your spreads with two white lines on the chart. You can input up to ten symbol-specific presets along with one other that will be applied to all unspecified symbols. "Spread Visualizer" will only be helpful for those trading with fixed spreads. So, if your broker uses variable spreads, do not use this script.
Spread
Price SpreadIncludes logarithmic and linear plotting of price spread (high-low).
See comments for more information.
Thanks to @GravitasProblem for the inspiration.

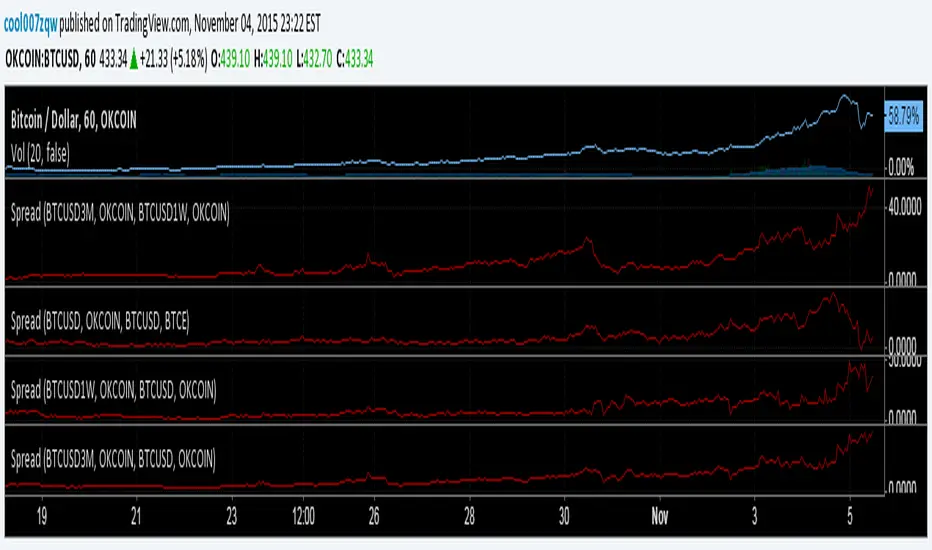
Spreads + MA + Bollinger BandsCryptocurrency adoption is on a constant upward trajectory. The interest for trading 'crypto assets' could not stay anywhere behind. The amateur nature of the market together with huge 'price inefficiencies' is always giving rise to excellent arbitrage opportunities throughout the globe. This code aims to help traders to make money placing safe and profitable trades which will eventually help the community to move towards more efficient price discovery.
The script combines up to three assets to be monitored at the same time. It also allows the trader to plot Simple or Exponential Moving Averages and Bollinger Bands (BB) for each asset he wants to trade.
Instructions:
* International/local -- it allows the trader to switch between international spreads and local (currency) spreads, considering the market he is targeting. The default value is international. Unchecking the field will set the script for local trades.
* Fees -- enables one to add his effective operational cost directly on the chart. This feature might be potentially relevant for traders who engage with fast-moving markets which demands action to be taken right away. The logic for calculations when fees are in place is the following (fee ≠ 0): if (spread > 0), then (spread - fee). If (spread < 0), then (spread + fee). When the spread is too short, the code may plot somewhat weird charts. In this case, it might be interesting to keep fee = 0.
* Standard/ Absolute BB -- it changes from standard Bollinger Bands (default value) to absolute Bollinger Bands. The standard version calculates the bands over the moving average. The absolute version calculates each band in isolation taking absolute values as arguments. Play with the two options (and deviation) to see which is better regarding your market and the instrument of your choice. Uncheck the field to get the absolute version. Feedback on this point is particularly appreciated.
* Expon. Ma -- it switches everything from Simple Moving Averages (SMA) to Exponential Moving Averages (EMA). Default value: SMA.
I hope you guys manage to make money using the script. And if you do, feel free to show your appreciation. Any amount is welcome! Let's take advantage of what crypto enabled us.
Tips : =>
BTC: 33RUY4AXBEL89gEsoqDpXRgvdZWePhLrqc
LTC: M9mBqVhxWNuZuCPEsrRtH3ygxNYnCdMEki
LTC: 36btZsgNxqiPibag6quTEtdX367wXskUnJ (old format)
ETH: 0x1D3E1701F1A0C379e7Fcb60BADBcd14AcE8160c4
DASH: XnKHHcmhZmR2SAqavP1x6FbEBrqTYa4kTk
If you want to use the script, please, let me know leaving a comment below.
Trade wisely and good luck out there.
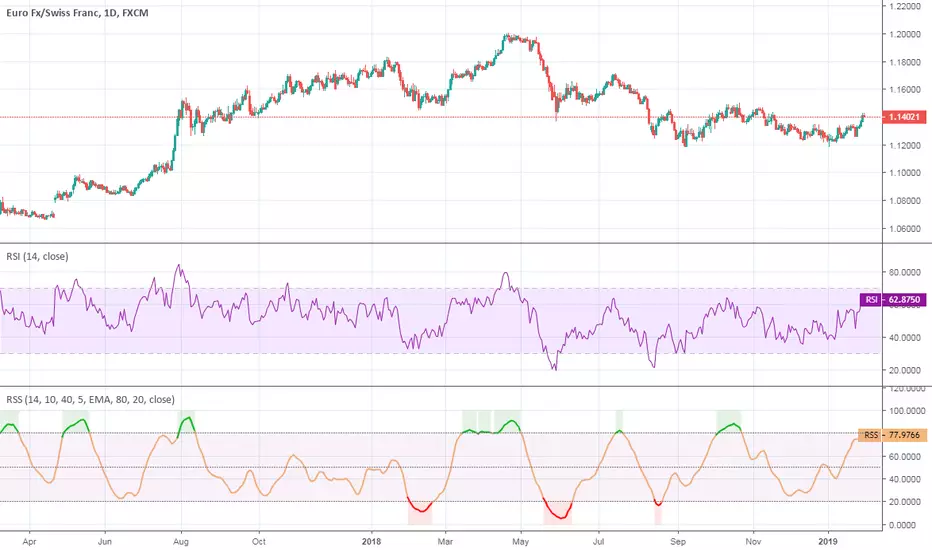
Relative Spread StrengthRelative Spread Strength indicator script. This indicator was originally developed by Ian Copsey (Stocks & Commodities V. 24:10 (16-23): Forex Focus).
Simple Spread Indicator + EMASimple indicator to see the spread between high and low, great to spot volatile moves. Put an exponential moving average of the spread in there too, adjustable to ones preferences.

EMA Spread OscillatorEMA Spread Oscillator
Quickly see past levels where diff maxed out. Momentum and price can only keep going up for so long. This obviously differs per underlying asset. So that is where this oscillator comes in handy.
Of course you can see on the chart how far apart the moving averages are, but it is easier to spot on an oscillator.
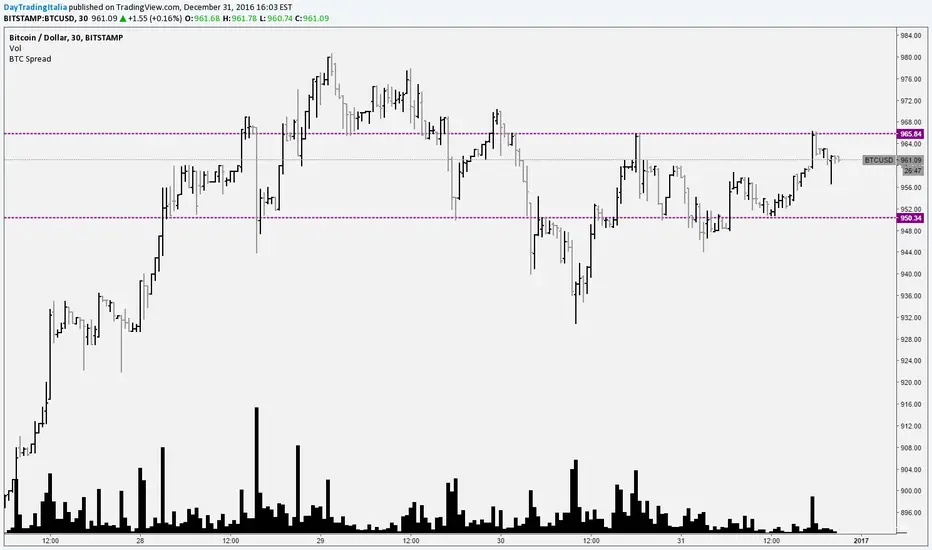
Simple Spread Simple spread between two tickers. Click format to set inputs for tickers. ex: "COINBASE:BTC:USD"

EMA and SMA SpreadI had hard time to find a simple script to show EMA and SMA spread.
Bonus add for PT users :)
Set "buy_value" as you have in PAIRS.properties to show you when your buys will become potential.

Kovach Crypto SpreadThe Kovach Crypto Spread indicator calculates the spread in profit between Bitcoin and the leading Altcoins. The Altcoins are weighted by market cap and this script is update weekly so you constantly have the most relevant Altcoins and their coefficients in the indicator.
Values above zero indicate a net flow from Altcoins to Bitcoin and vice versa. Let's consider how to use this data.
1. If Bitcoin is rallying, and the spread is well above zero, this indicates that Bitcoin is providing more profit than Altcoins. Consider taking some profits from BTC and investing in Altcoins.
2. If Bitcoin is retracing, but the spread is still above zero, it means that Altcoins are getting hit harder than Bitcoin, and you should keep your position in Bitcoin.
3. If Bitcoin is ranging, and the spread is below zero, it means that Altcoins are rallying and Bitcoin is stagnant.
For access to this indicator and more, please visit quantguy.net

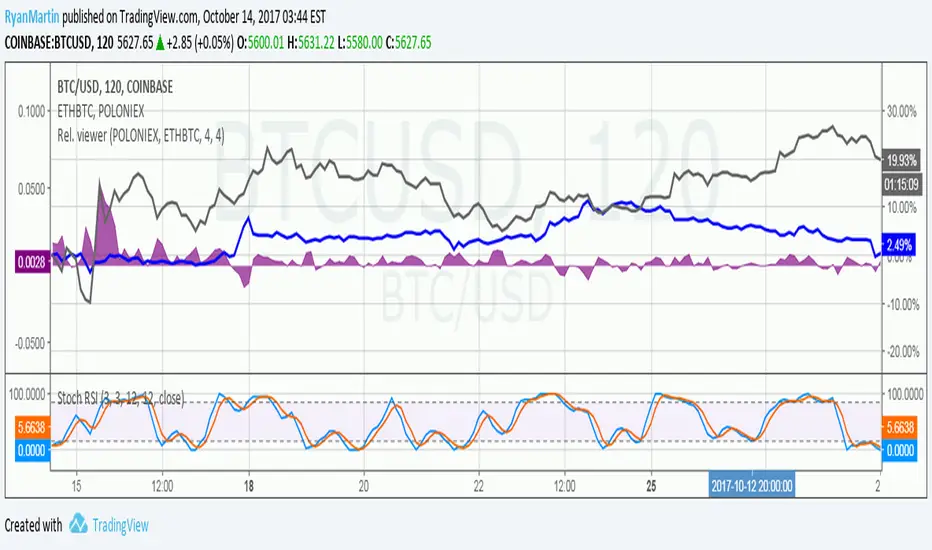
Price relation viewer - add percent change of two symbols (BETA)This script is very much beta!
This is a simple script to visualize how two symbols move in relation to each other. For example if the underlying symbol is a 2x Gold ETF (meaning the ticker moves at 2x the spot price of gold---if gold goes up 3% this ticker should go up 6%) and the comparison symbol is an 2x inverse gold ETF (at gold up 3% this should move down 6%). If these ETFs were 100% accurate at tracking the price of gold then this tool would report a value of zero at all times.
Day 1
Ticker - $10
Comparison - $10
Day 2
Ticker - $12
Comp - $11
This tool value - |20%| + -|10%| = 10%
It uses a short simple moving average to smooth things out a bit (see inputs). It is important to keep your axis scale in mind when using this! Two symbols that are always near zero mean they are offsetting each other very well but the value displayed might range from 0 to 0.005, but the graphed area can make it look extreme if autoscaled.
This is a tool with very specific uses : comparing how one digital currency moves in relation to bitcoin's price, comparing how gold moves in relation to silver, etc.
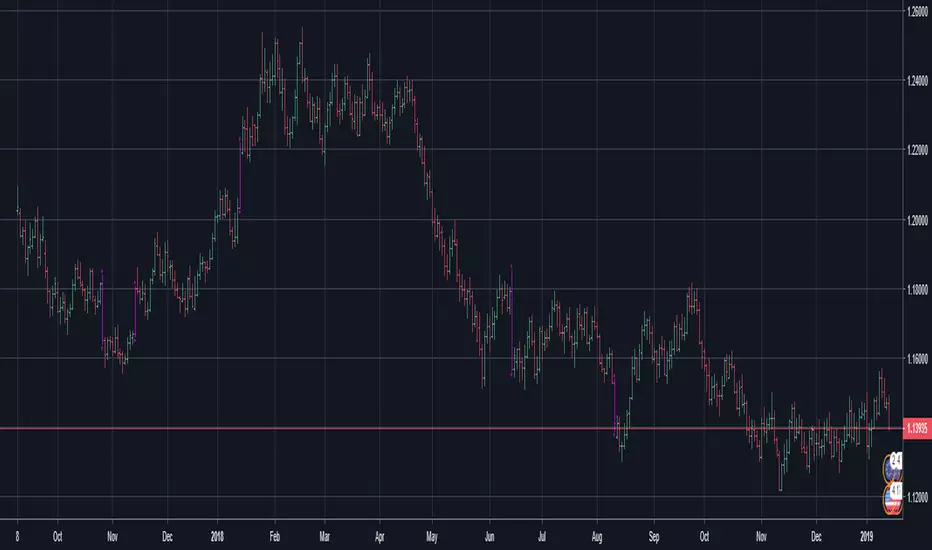
Hawkeye Trend+StopsHawkeye Trend+Stops -- the tool that breathes with market condition
With Trend+Stops you get a true sense of the market trend rather than opinions from the financial media.
This powerful indicator tells you when a trend is commencing, in congestion and where the correct exit is. You’ll have the confidence to stay in a trend, a feat that proves difficult for most novice traders.
Trend+Stops is based on the Hawkeye Volume algorithm of pattern recognition and average true range. Using this tool will stop you from having "opinions" on market direction and allow you to take control of your trading.
Trend+Stops overcomes two of the biggest hurdles to successful trading:
Where the trend is at the given moment (and its momentum)
Where your stop exit should be
The Hawkeye Trend+Stops Indicator
One of the most difficult tasks in trading is to know when the market you are trading is in a trend, and when it is not. It is the correct selection of trades in trending markets that makes the difference between a profitable trade, and one that gets you stopped out with a loss.
The problem is that markets spend more time moving sideways than they do in a trend. Consequently many traders find themselves in a trade they believe is the start of a trend, only to discover that the market moved sideways, with the position being closed out at a loss. This is the single most frustrating part of trading, and it accounts for more traders making overall losses on their account than any other factor -- Hawkeye Trend+Stops


Spread Close & SMA200 & Less EMA200Simple Oscillator showing Price relative to a 200-Day SMA and 200-Day EMA

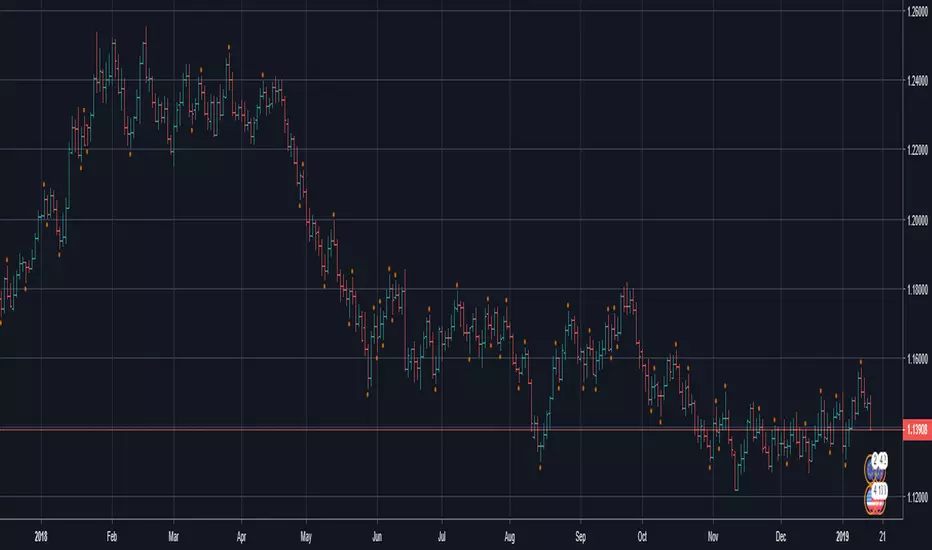
Bitcoin SpreadIt selects the min/max price for btc/usd from a set of exchanges and shows them on the chart. It is possible to add or remove exchanges by editing the source code
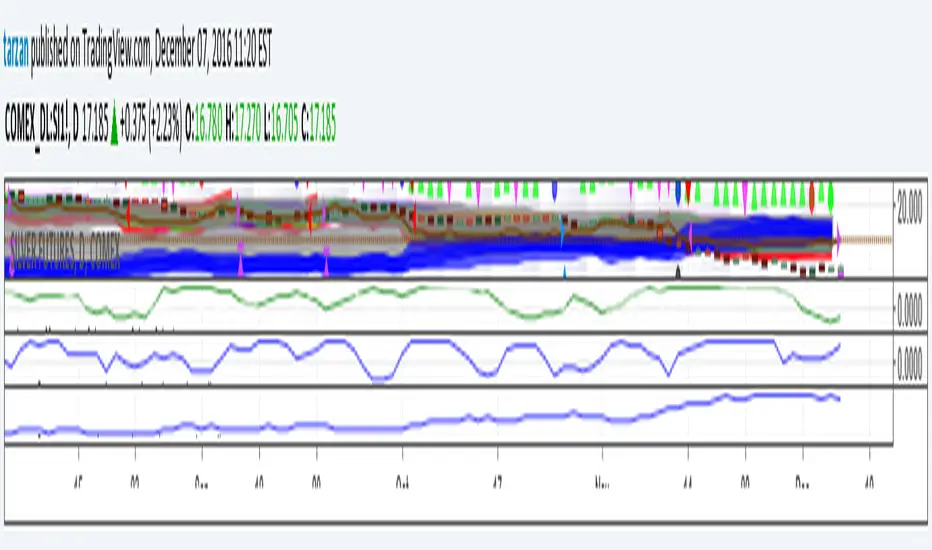
Tarzan's spread ratio indicator - DeLuxeThis indicator plots any two securities as a spread ratio using either +,-,/, or *.
It also allows you to use a simple moving average of length 1 to n for your spread ratio.
If you know what you want to do but don't know how to code it, we can work it out, you can float me some cheese on paypal and I'll do a nice job. This indicator is yours for free.
Tarzan = noprism@hushmail.com
Peace
USD (basket) / XAG SpreadHey all; I made this script for default usage on the 15 min chart for XAGUSD, try it out and tell me what you think.
It is similar to what the original user /u/MarcoValente published for his gold/silver spread script; however I have made some changes so this is usable for XAGUSD and utilizes my 'holy grail' method of basket weighting the USD (aka why the code is protected) for comparison against silver and I also made some visual enhancements like color changes, filled area of interest, and crossover markings.
One way this script can be thought of actually 'doing' is measuring the true strength of the USD against a basket vs silver. As the USD gains strength, the price per unit of silver should decrease; as the USD loses strength the price per unit of silver should increase.
The filled area is the difference between the spread and the slow MA; the marked crosses are the cross of the spread with the slow MA.
Feel free to PM me with questions etc. I find that this script is slow to load sometimes so if it doesn't immediately load try changing time frames a few times before returning to 15 min and if all else fails just wait it out haha

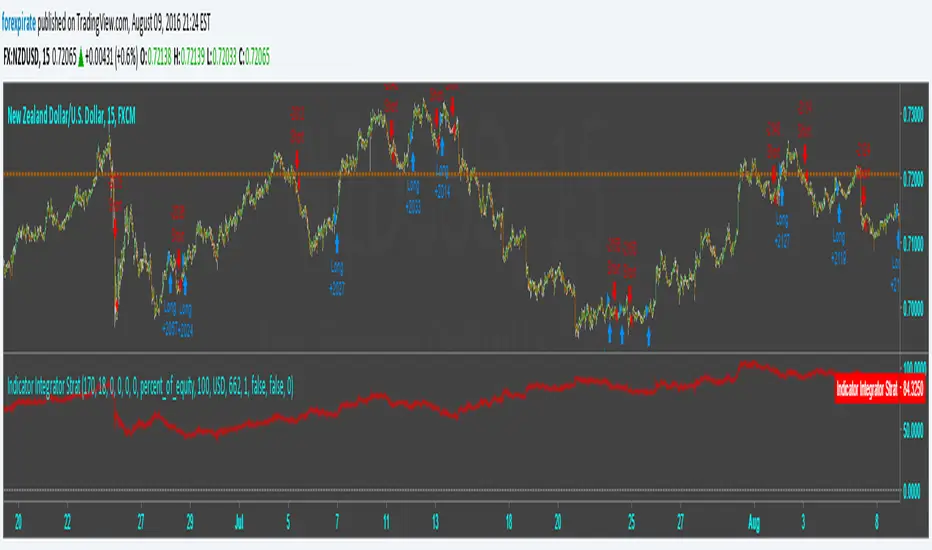
Indicator Integrator Strat <<<<<< Updated again, second2nd patch
Found an error in the orders. Script was making double orders at times. I fixed it. It is tuned as such:
NZDUSD
15 min chart
starting $USD to show 1000 contracts for minicontract with FXCM (start date 3-18 $633 ** see note)
Indicator plots Starting equity-trade gain and loses-number of trades time spread = net money
** with 1:50 leverage it requires $16 for one 1,000 contract.
$84 net vs $16 initial balance is 456% in 109 days.
* If you find errors please comment.