Simple RangeThe daily price range is a good proxy to judge an instrument’s volatility. I have combined multiple concepts in this indicator to display information regarding the daily price range & its volatility.
A trading period's range is simply the difference between its high and the low. This script shows the daily high-to-low range of the price as a column chart. It has 3 main components:
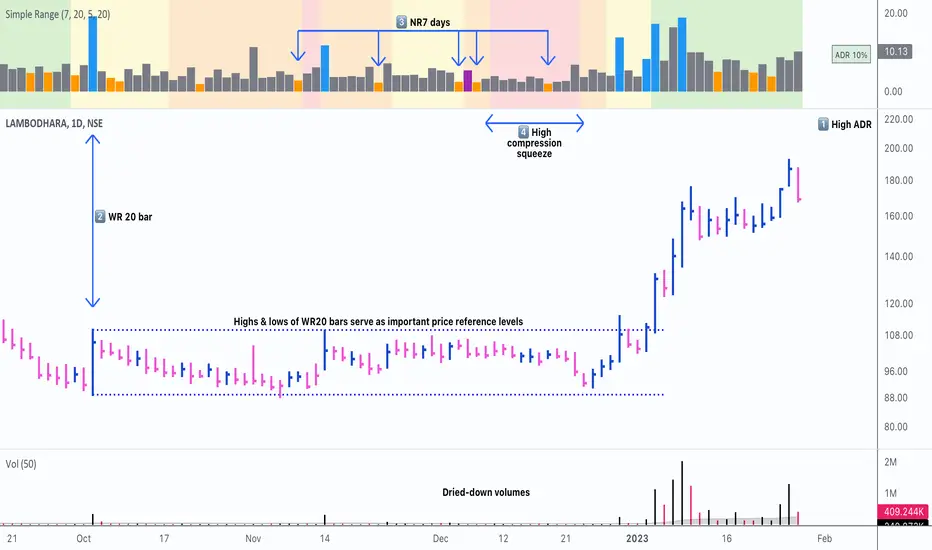
1. Narrow-range days (NR7) & Wide-range Days (WR20) - as plot columns
Original concept from Thomas Bulkowski
Modified from "NR4 & NR7 Indicator" script by theapextrader7
Modified from "WR - BC Identifier" script by wrpteam2020
Narrow range days mark price contractions that often precede price expansions. This script uses NR7 (narrow range 7) as a narrow-range day. This value can be changed by the user if, instead of an NR7, he or she wishes to use NR4 or NR21, or any other interval of his or her choice. NR7 is an indecisive trading day in which the range is narrower than any of the previous six days (a total of 7 days). This is a popular concept given by Thomas Bulkowski. A breakout is said to occur when price closes above the top or below the bottom of the NR7. Upside breakout of an NR 7 candle with high volumes indicates bullishness.
Similarly, highs & lows of wide-range bars (on big volumes) are also significant reference levels for price. Wide-range candle are identified by size of the body candle (open - close). The script compares the size of previous 20 candles to identify WR20 candles. This value can also be changed by the user.
The script shows NR7 & WR20 as orange & blue bars, respectively.
The user can also turn on the option to identify a big high-to-low range candle greater than a pre-defined threshold (default is 5%). These show up as green or red bars.
2. TTM Squeeze - as background
Original concept from John Carter's book "Mastering the Trade"
Based on "Squeeze Momentum Indicator" script by LazyBear
John Carter’s TTM Squeeze indicator looks at the relationship between Bollinger Bands and Keltner's Channels to help identify period of volatility contractions. Bollinger Bands being completely enclosed within the Keltner Channels is indicative of a very low volatility. This is a state of volatility contraction known as squeeze. Using different ATR lengths (1.0, 1.5 and 2.0) for Keltner Channels, we can differentiate between levels of squeeze (High, Mid & Low compression, respectively). Greater the compression, higher the potential for explosive moves.
In the script, the High, Mid & Low compression squeezes are depicted via the background color being red, orange, or yellow, respectively.
3. Average Daily Range - as table
Original idea by alpine_trader
Modified from "ADR% - Average Daily Range % by MikeC" script by TheScrutiniser
Average Day Range (ADR) tells how much the price moves between the high and low on a given day. This is the day Range, which is then averaged to create ADR. The script uses an average of the last 20 days to calculate the ADR. Unlike ATR (Average True Range), this excludes Gaps.
The script displays the ADR as a % value in a table.
If you want to find stocks that move a lot on an average on most days, then look for stocks that have ADR% of 5% or more.
If you prefer lower volatility stocks, focus on stocks with lower ADR% values, such as 2% or less.
How it comes together
For a bullish "momentum burst", or a velocity trade:
Select stocks with Average Day Range % (ADR) greater than 5
Identify significant reference price levels via highs & lows of WR20 bars (on big volumes)
Wait for a decent mid-to-high compression squeeze
Look for clusters of NR7 candles in the consolidation
Any breakout from this consolidation should be accompanied by more than average (preferably pocket pivot) volumes
Squeeze
BullBarbies MoRoll v1.0If you like the TTM Squeeze histogram, this may be your favorite new indicator.
5 customizable timeframe MACD-based oscillators are programmed to give you a heads-up when momentum is rolling over and changing to a new direction by using lower timeframes as a "heads-up" of a potential change. Designed to be used on the 5 minute chart, but can be adapted for higher timeframes as well. Not recommended for charts under 5 minutes. Settings default to those recommended for a 5 in chart: 5, 4, 3, 2, & 1 min oscillators. If using on a higher timeframe, consider starting with the current timeframe and stepping each down from there. Lower timeframe oscillators will begin to roll first. Most multi-timeframe indicators keep watch for conditions on higher timeframes, this one is designed to give you a leg-up in seeing what's happening underneath the price action and squeezes by taking a peak at lower timeframes. Designed to be faster to help you make intra-day day trading decisions.
When all 5 indicators are in color agreement (all red or all green), this indicates strong directional momentum. To catch a shift in momentum, watch for colors to begin shifting red to green or green to red. When you can catch these shifts at support and resistance, it can make for a higher probability trade than trading just support and resistance. The more oscillators in agreement, the more confidence you can have that you are on the right side of the trade.
Pay attention to relative distance from the zero line as well. A trend day will have oscillators spending most of their time to one side or the other of the zero line. Oscillators change colors at the zero line for visual aid. Extremely high or low readings can indicate oversold or overbought conditions.
When the lines are a tangled mess of red and green, this indicates choppy conditions when many daytraders like to avoid.
Works well paired with the TTM squeeze for a more detailed look at your current timeframe.
This indicator has several features:
* 5 Timeframe oscillators that display as lines
* A zero line to show relative distance from the midpoint
* 4 color settings: rising above/below zero; falling above/below zero
I built this indicator because I love using the TTM Squeeze histogram on multiple timeframes to aid in predicting the loss and gain of momentum, but do not want to dedicate the monitor space to 5 charts just for the squeeze histogram. Plotting the histogram as lines allows the display of multiple timeframes. It has become standard on my intraday trading charts.

1st Gray Cross Signals ━ Histogram SQZMOM [whvntr][LazyBear]This is the Histogram Version of one of my other indicators named: SQZ Momentum + 1st Gray Cross Signals (with arrows) Which is a modification of "Squeeze Momentum Indicator" by user: "LazyBear". In that indicator of his he described, and suggested, the use of his gray cross signals to find points of interest for trading based on the direction of momentum when the first gray cross appears... I have programmed these points, and highlighted them, for ease of use. The 1st gray cross strategy, he said , is from John F. Carter's book, Chapter 11, "Mastering the Trade".
Here we have the Histogram version, with background highlights only, and nothing on the chart, in true SQZ Momentum style.
Disclaimer: using this indicator, or any indicator anywhere, involves risk when trading and isn't a guarantee of 100% accurate results.

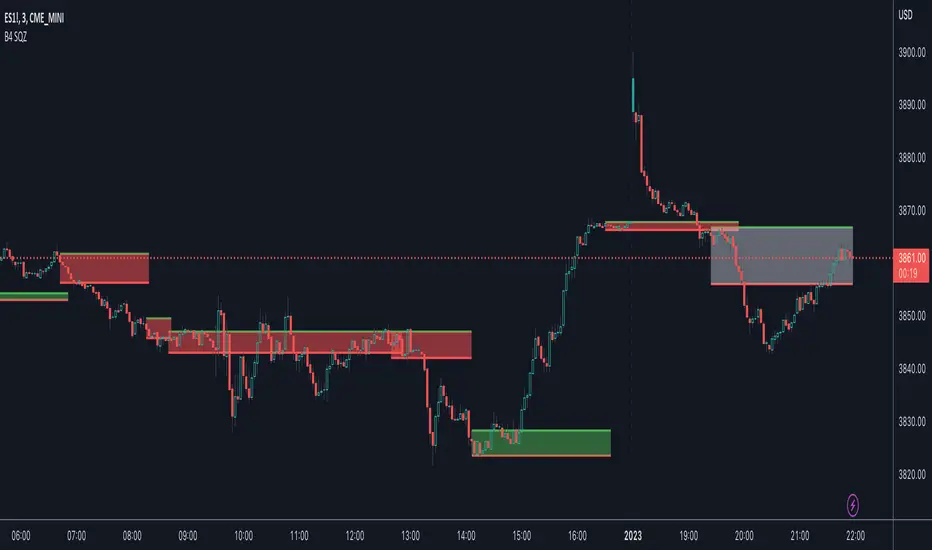
B4Signals Indicator Premium Addon SqueezeB4 Squeeze is a chop zone indicator that finds potential breakouts in Realtime. It filters price action to Identify and draw a squeeze threshold (chop zone) live on your upper chart. It identifies both Squeeze Zones and Breakouts/Breakdowns.
How it works?
- The script finds highest/lowest bars during the SQZ according to the ”B4Signals Indicator“.
- By using the direction and highest/lowest bar info it calculates SQZ Zones in realtime .
- The Indicator helps you stay out of the chop during the SQZ and allows you to exploit explosive moves when it breaks out.
- When price exits the SQZ threshold, price will usually explode up or down changing the color of the box to indicate breakout direction.
- Then SQZ Zone extends automatically if there is no breakout.
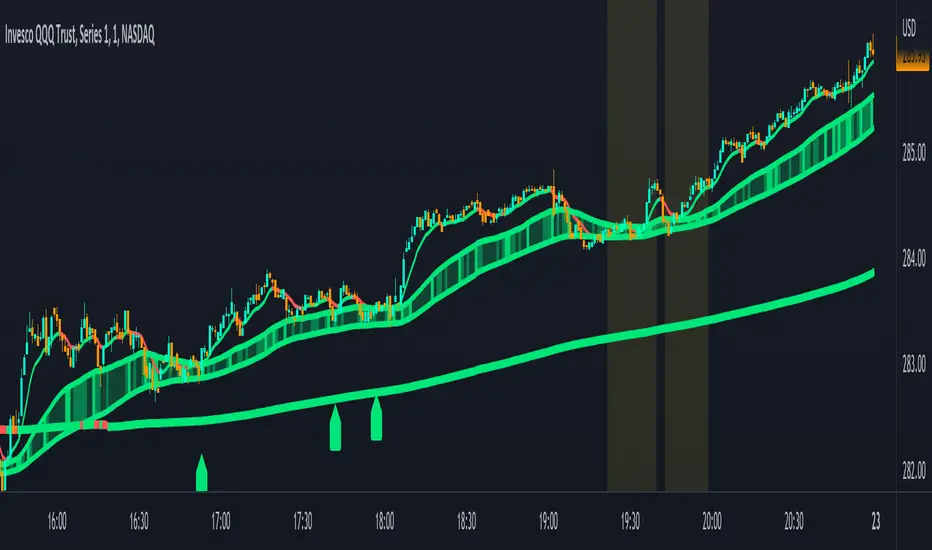
Combined Moving Averages + Squeeze & Volume Spike SignalsThis is a set of 4 combined moving averages. Each moving average is a combination of an EMA, SMA, HMA, RMA, WMA and VWMA with the same length as set in your input settings. All 6 of them are added together and then divided by 6 for an average of all of them. This is based on the theory that most traders use their own preference of moving averages, so combining them all should give us a better idea of where price should actually react since we are using the average of what most traders are using on their charts. It also smooths the moving averages out as well so you get a much easier to read moving average than any of them on their own which should help you hold positions longer and time your entries better.
The default lengths used for this indicator are as follows: 10, 50, 100 and 500. These lengths can be updated in the settings. The 10 and 500 will change colors when the individual moving average is less than or greater than its previous value. Price above or below the moving average does not affect the colors. The 50 and 100 are colored based on whether the 50 is greater/less than the 100.
The two middle length moving averages by default are the 50 and 100. This has been turned into a cloud because it is the area where price typically bounces, since tons of traders use the 50 and 100 moving averages. This should be your long/short zone when price is trending.
Each moving average can be set to use a different source such as close, open, high, low, ohlc4, etc. You can also adjust the length of each moving average. Default settings work well, but feel free to customize them to your liking. You can also change the colors of the lines in the settings.
Beware that changing the lengths of MA #2 and MA #3 will change the signals, squeezes and the cloud.
VOLUME SPIKES
The cloud will change to a brighter color when a volume spike is detected. When a major volume spike is detected, it will turn very bright colored green/red according to the direction of the cloud. This notifies you of volume spikes so you have a better idea of how strong the trend is. If the cloud is a dark green/red then that means that volume is less than or equal to the recent median volume.
SIGNALS
There are also signals that will be given when the current candle is in the cloud, the candle is going in the same direction as the cloud, the MA #2 and MA #3 is going in the same direction and a volume spike is detected. These help you identify good entries when markets are trending. Be cautious of these signals when the trend is sideways and not clearly moving in one direction. The signals can be turned on or off in the settings.
SQUEEZE
Many times when moving averages squeeze together, a big move happens shortly after. Because of this I added a yellow background color when a squeeze is detected. It looks at the median value difference of the MA #2 and MA #3 and if the current value difference is less than the median multiplied by the multiplier in the settings then it will change the background color to notify you. The default value of the multiplier is .6, meaning the squeeze signal will only show if the current value difference of the cloud is less than .6 of the median difference. The multiplier can be adjusted in the settings to suit your preferences. Lower values will only show tighter squeezes.
MARKETS
This indicator can be used on all markets including stocks, crypto, futures and forex.
TIMEFRAMES
This indicator can be used on all timeframes.
PAIRINGS
We recommend pairing this combined moving average with Trend Friend Swing Trade And Scalp Signals for extra confluence. Look for price to bounce in the cloud with good volume and a confirming signal from Trend Friend for highly probable moves.
ATR - Average True Range + Dynamic Trend w/ Signals | by Octopu$↕ ATR - Average True Range + Dynamic Trend w/ Signals | by Octopu$
What is ATR?
ATR stands for Average True Range
A Technical Analysis Indicator that measures market volatility by decomposing the range of a Security Price in a specific period.
The ATR can be used as a High Low Spectrum,
As well as a variation of a Moving Average, considering the ranges on a timeframe, generally this being 14 days.
Shorter periods can be used (will generate more signals) or longer periods for steadier trends (for fewer signals)
A ticker on a high volatility has a high ATR.
A ticker on a low volatility has a low ATR.
It is an useful resource for a trading system:
Can be used to enter or exit trades and/or also measure the daily spectrum of a stock.
Does not necessarily points price direction, but takes into account gaps and strong legs.
Can also be used as trading positions confirmation,
Rather be it for stop losses or take profits,
As well as setting trailing stops or limit orders.
This tool offers a great Risk to Reward Ratio, considering the fact you will be aware of the possible moves that an asset can perform.
This indicator should not be used as a standalone tool.
(The combination of factors relies on your own knowledge about Confluence Factors along with your Due Diligence)
This indicator is not an advice to buy or sell securities.
www.tradingview.com
SPY
ANY Ticker. ANY Timeframe.
(Used SPY 5m as Example only)
Features:
• ATR ( Average True Range )
• Range UP and DOWN
• Movement from Price Line
• Dynamic ATR
• Cross/Test Signals
• Live and Last Close
Options:
• Specific Factors Setup
• Length Customization
• Toggle On/Off
• Color PIcker
• Styling Options
Notes:
v1.0
Indicator release.
Changes and updates can come in the future for additional functionalities or per requests. Follow and Stay Tuned!
Did you like it? Please Support and Shoot me a message! I'd appreciate if you dropped by to say thanks! Thank you.
- Octopu$
🐙

Squeeze Index [LuxAlgo]The Squeeze Index aims to measure the action of price being squeezed, and is expressed as a percentage, with higher values suggesting prices are subject to a higher degree of compression.
Settings
Convergence Factor: Convergence factor of exponential envelopes.
Length: Period of the indicator.
Src: Source input of the indicator.
Usage
Prices being squeezed refer to the action of price being compressed within a tightening area. Prices in a tight area logically indicate a period of stationarity, price breaking out of this area will generally indicate the trader whether to buy or sell depending on the breakout direction.
The convergence factor and length settings both play an important role in the returned indicator values. A convergence factor greater than the period value will detect more squeezed prices area, while a period greater than the convergence will return fewer detected squeezed areas.
We recommend using a convergence factor equal to the period setting or a convergence factor twice as high.
The above chart makes use of a convergence factor of 100 and a period of 10.
Due to the calculation method, it is possible to see retracements being interpreted as price squeezing. This effect can be emphasized with higher convergence factor values.
Details
In order to measure the effect of price being squeezed in a tighter area we refer to damping, where the oscillations amplitude of a system decrease over time. If the envelopes of a damped system can be estimated, then getting the difference between the upper and lower extremity of these envelopes would return a decreasing series of values.
This approach is used here. First the difference between the exponential envelopes extremities is obtained, the logarithm of this difference if obtained due to the extremities converging exponentially toward their input.
We then use the correlation oscillator to get a scaled measurement.
Multi-timeframe Squeeze Mom + ADX and DIsMulti-timeframe Squeeze and ADX
This indicator is designed to be able to get used in combination with others that can lead to a potential help for trading.
The indicator uses colors such us light green, dark green, light red and dark red. Light green and light red to indicate the second half and strongest movement of an upwards and downwards movement, respectively. The same for the first half of an upwards or downwards movement, dark red for the possible start of the upwards movement and dark green ad possible start of the downwards movement.
The indicator is multi-timeframe because the trader can configure within the menu a background timeframe, which plots a squeeze momentum for a different timeframe than the one selected for the main graph. It plots the background timeframe with an area style, while the main squeeze is plotted with a column style. This helps the traders to analyze whether entering a position countering a higher timeframe upwards or downwards squeeze momentum.
It also shows the divergences that occur between the price and the squeeze momentum that can add strength to a potential movement upwards or downwards.
The ADX, DI+ and DI- lines are also added to determine the potential strength of the movement in the monitor (squeeze momentum). If the DI+ is over the DI-, then the strength is likely higher upwards and the opposite for the downwards strength.
Fundamentals
Squeeze momentum: It shows the periods when volatility increases or decreases, in other words, when the market goes from the trend into flat movement and vice versa.
ADX (Average Directional Index): The ADX helps the indicator to estimate the strength of the movement, always considering the DI+ and DI- to not go against the trend strength.
Positive (DI+) and Negative DI (DI-): Both DI+ and DI- measure up and down price movement, in some cases crossovers of these lines can be used as trade signals.
Divergences: Divergence occur when the price of an asset is moving in the opposite direction of a technical indicator, such as an oscillator (squeeze momentum). Divergence warns that the current price trend may be weakening, and in some cases may lead to the price changing direction.
Panel
This panel allows the trader to have a summary of the values of the direction and strength of the movement. It has the following characteristics:
It is placed on the right middle side of the chart indicator by the default.
Its colors changes according to the indicator’s values.
The summary box shows the projection for the main squeeze plot and also for the background squeeze plot. If only one is needed, it can be changed on the menu of the indicator.
Summary
From all previously mentioned, it can be stated that the indicator allows users to:
Detect the direction of trends
Detect price and squeeze divergences
Get a table summarizing important values of the indicator to determine the strength of a trend.

Squeeze Momentum Strategy [LazyBear] Buy Sell TP SL Alerts-Modified version of Squeeze Momentum Indicator by @LazyBear.
-Converted to version 5,
-Taken inspiration from @KivancOzbilgic for its buy sell calculations,
-Used @Bunghole strategy template with Take Profit, Stop Loss and Enable/Disable Toggles
-Added Custom Date Backtesting Module
------------------------------------------------------------------------------------------------------------------------
All credit goes to above
Problem with original version:
The original Squeeze Momentum Strategy did not have buy sell signals and there was alot of confusion as to when to enter and exit.
There was no proper strategy that would allow backtesting on which further analysis could be carried out.
There are 3 aspects this strategy:
1 ) Strategy Logic (easily toggleable from the dropdown menu from strategy settings)
- LazyBear (I have made this simple by using Kivanc technique of Momentums Moving Average Crossover, BUY when MA cross above signal line, SELL when crossdown signal line)
- Zero Crossover Line (BUY signal when crossover zero line, and SELL crossdown zero line)
2) Long Short TP and SL
- In strategies there is usually only 1 SL and 1 TP, and it is assumed that if a 2% SL giving a good profit %, then it would be best for both long and short. However this is not the case for many. Many markets/pairs, go down with much more speed then they go up with. Hence once we have a profitable backtesting setting, then we should start optimizing Long and Short SL's seperately. Once that is done, we should start optimizing for Long and Short TP's separately, starting with Longs first in both cases.
3) Enable and Disable Toggles of Long and Short Trades
- Many markets dont allow short trades, or are not suitable for short trades. In this case it would be much more feasible to disable "Short" Trading and see results of Long Only as a built in graphic view of backtestor provides a more easy to understand data feed as compared to the performance summary in which you have to review long and short profitability separately.
4) Custom Data Backtesting
- One of most crucial aspects while optimizing for backtesting is to check a strategies performance on uptrends, downtrend and sideways markets seperately as to understand the weak points of strategy.
- Once you enable custom date backtesting, you will see lines on the chart which can be dragged left right based on where you want to start and end the backtesting from and to.
Note:
- Not a financial advise
- Open to feedback, questions, improvements, errors etc.
- More info on how the squeeze momentum works visit LazyBear indicator link:
Happy Trading!
Cheers
M Tahreem Alam @mtahreemalam

Variety-Filtered, Squeeze Moving Averages [Loxx]Variety-Filtered, Squeeze Moving Averages is a chop zone indicator that identifies when price is below a specific volatility threshold calculated as the difference between a fast and slow moving average and filtered using ATR- or Pips-based threshold. This indicator can be use as both an entry and exit indicator. It identifies both chop zones and breakouts/breakdowns
How to use
When the candles turn white and the threshold bands appear on the chart, this is indicative of low volatility
When price exits the threshold bands, price will usually explode up or down giving a long or short signal. This acts as a sort of squeeze momentum.
Included:
Bar coloring
Signals
Alerts, 4 types of alerts: Squeeze started, Squeeze ended, long, and short
Loxx's Expanded Source Types
35+ Loxx's Moving Averages

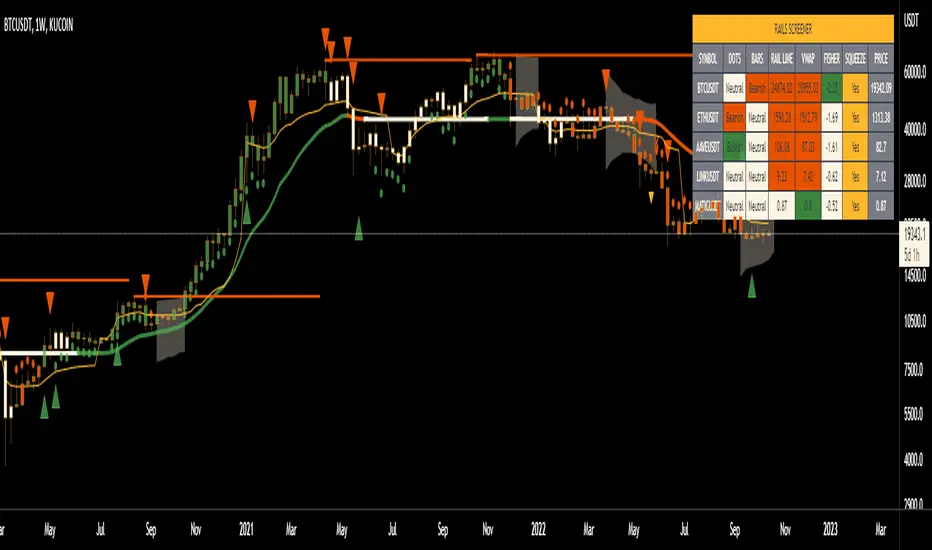
Rails [s3]Centered around a Variable Moving Average. The Variable Moving Average (VMA) is a study that uses an Exponential Moving Average being able to automatically adjust its smoothing factor according to the market volatility. In addition to the VMA, the indicator displays breakouts in volume and when the Bollinger Bands are in a squeeze.
Dots = Microtrend
Triangles = Breakouts in Volume
X = Crossover of Moving Averages
Shaded "Cloud" = Bollinger Bands Squeeze
Alerts can be set for Bearish and Bullish strength (Volume Breakouts), Crossovers, and when Squeezes have started and ended.
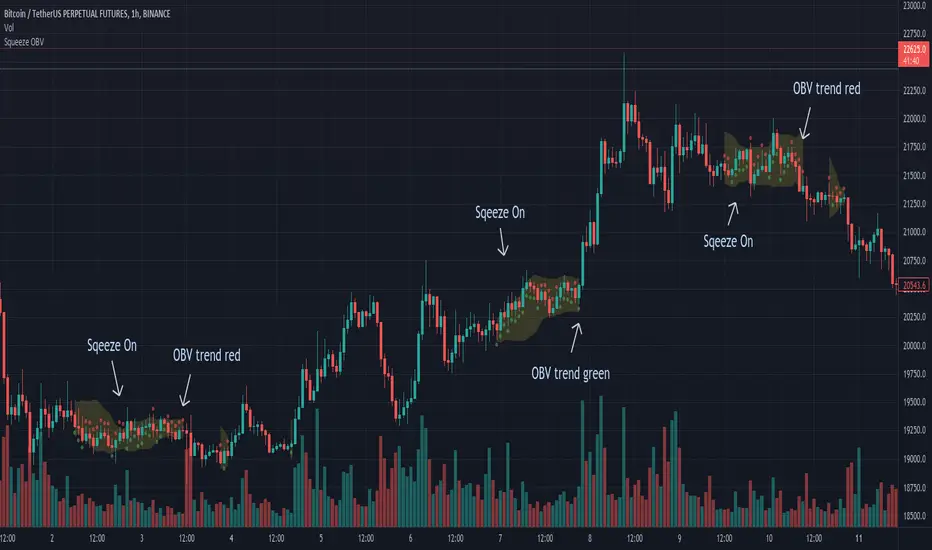
Squeeze OBVThe concept comes from "TTM Squeeze", this indicator visualizes the squeeze on the price movement.
Yellow band overlay on the candles shows that entered a squeeze on with low volatility, market preparing itself for an large move (up or down).
Dots of OBV change every bar, green means potential up, red is the opposite.
Prepare a breakout order with the direction of OBV.
If potential up, the strategy is a breakout order above the squeezed Bollinger Band and the stop loss is below the Bollinger Band.
It's a pity that it cannot write breakout order strategy in Tradingview.
My experience that use CVD instead of OBV will have better performance, but it needs the historical evolution of the order book.
----
概念來自於 "TTM Squeeze",將擠壓的過程視覺化在價格走勢上。
k線上的黃色帶覆蓋表明進入了低波動性的擠壓,市場為大幅波動(向上或向下)做準備。
OBV 的點每根bar都會變化,綠色表示可能向上,紅色則相反。
搭配 OBV 可以判斷走勢,使用突破單策略能夠有效獲利,
假設可能向上,突破單在擠壓布林帶上方,止損在布林帶下方。
可惜 Tradingview 無法寫突破單策略回測。
經驗上搭配 CVD 更有效,需要交易所訂單簿的歷史紀錄,故 Tradingview 也無法製作 CVD。
Bollinger Bands SqueezeBollinger Bands set to only display when a squeeze is taking place. Squeeze will be highlighted.

SKS_SQZPRO//@originalauthor Makit0
//
//script based in:
// original John Carter's ideas (SQUEEZE & SQUEEZE PRO) www.simplertrading.com
// LazyBear's script (Squeeze Momentum Indicator)
//
// USE IT IN CONJUNCTION WITH THE SQUEEZE PRO ARROWS INDICATOR
//
// This system is based in the volatility reversion to the mean: volatility contraction leads to volatility expansion and the other way on
// The dot signal is a warning of volatility compression, more often than not this leads to a expansion of volatility and a move in the action price usually bigger than the expected move
// Be aware of the trend direction, use the momentum histogram to see the slope direction
//
// There are 3 levels of compression:
// Level 1: ORANGE, the lesser compresion level
// Level 2: RED, the normal level marked by the original squeeze indicator
// Level 3: YELLOW, the max compression level
// The more the compression the bigger the after move
//
// The GREEN dots signal the volatility expansion out of the squeeze ranges
MODIFIED HEAVILY!! MOM_LINE, MOMBars

(JS) Checklist SignalsWhat if I told you that you could use over 10 indicators at once without having a single one of them on you chart? Enter the Checklist Signals. This is probably the most complex yet simple indicator I've ever done.
What you get is 6 rows (if you want them all) of labels that hover at the top of your screen with a ton of extremely useful information. I will go down the list of options in the indicator settings and explain how it all works.
So the label placement is based on ATR. You choose your X Axis and Y Axis starting point then adjust the lookback period. Default lookback is 600 bars. What that means is, the indicator finds the highest high in the last 600 bars, then begins to place the labels above that zone based on the ATR of the chart. Different timeframes require very different combinations so it's all customizable. Sometimes if labels overlap you need to adjust the X Axis starting point, or the spread on either axis.
The next set of options allows you to decide what you'd prefer to be set on or off. Let's start with ATR and VWAP. I have added bands for both of these. When price is below the mean (which is the 21 ema by default), then the labels show you the next 5 standard deviations of ATR going down. When under one of these levels the label turns red. The opposite is true when above the mean and in those instances the labels will be green. It is the same with the VWAP, though instead of using the mean we use the daily VWAP as the starting point. If you choose to have levels switched on then you can see the actual values of each standard deviation level. Down lower in the options you can change the resolution and source used for VWAP.
The next option is "Trending". This creates a moving average using the length of the Trending Lookback Period (default is 5) and then tells you using arrows in the label which direction the trend of the indicator is going.
The next area let's you specify the information you receive in the Squeeze labels. By default all options are one - and this tells you if there's a Squeeze, what type of Squeeze there is, and how many bars the Squeeze has been building up or since it fired. These labels are color coded to correspond with the Squeeze type as well.
Then we get to another one of my indicators, the Ballista. One of the main signals is the "Inverted Squeeze" where the short term momentum inverts against the long term momentum. Here I have the distance between the two oscillators in the first label, and then the second label tells you if there's an Inverted Squeeze signal, if there's potential entry, confirmed entry, or how many bars its been since the last entry signal.
The next feature is off by default, but it will add arrows to your chart based on a simple lower highs and higher lows signals. Turning arrows on will place them right on your chart above or below each bar.
The rest of it is customizable settings of all the other indicators that are shown. Now looking at the labels themselves, starting in the top left corner:
First Row-
ADX + DMI: These labels show the ADX, DI+, & DI- values in each label. Whenever the DI+ or DI- is above the other then their respective label will light up. Also, when the ADX is above 20 (confirming the trend) it lights up in the same color as well.
Squeeze: I described how this worked above, the labels tell you if there's a Squeeze, how long there's been one, and how long since it fired, all while also changing to color of the associated Squeeze type.
Second Row -
Stacked EMAs: The top label looks at the EMA values using the numbers of the Fibonacci sequence. It looks at the EMA 8, 21, 34, 55, 89, & 233 and tells you if they're all stacked in the same direction (Stacked Bear meaning they're all crossed down in order, Stacked Bull meaning they're all crossed up in order). If the EMAs are all stacked but 1 or 2 it will say Stacked -1 or Stacked -2. When they're all over the place it will say they aren't stacked at all.
BB%: This tells you the value of the Bollinger Band %. If this is negative then you know that price is currently below the lower Bollinger Band, and if it is above 100% it is above the upper Bollinger Band.
RSI: This tells you the value of the RSI and the label changes colors based on the value.
Stoch: This tells you the Stochastic value and changes colors based on the value, same as the RSI.
Third Row -
The Mean: This tells you the numerical value of whatever you have the mean set as (21 ema by default). The label changes colors based on price being above or below the mean.
One ATR: This was something I added for those looking to plan their trades out. This tells you the value of one ATR so you can have a better idea of how to plan your trades based on this distance.
VIX: This tells you the current value of the VIX, and color changes based on being green or red on the day.
Ballista: I explained this above, it tells you the distance between the two oscillators and changes colors based on the trend being above or below 0. When there's an Inverted Squeeze this label is gray.
Inverted Squeeze: This label tells you if there's an inverted squeeze as well as if it is showing an entry or how many bars since the last entry signal. This label turns fuchsia on a bear signal and lime on a bull signal.
Fourth Row -
ATR Bands: As I explained above, this plots each standard deviation using ATR and changes colors based on price's relationship to each one.
Fifth Row -
VWAP: The three labels here show the daily, weekly, and monthly VWAP values, and color changes based on price's relationship to each one.
Sixth Row -
VWAP Bands: These are the standard deviation levels of the VWAP resolution of your choosing (as explained above), and just as the others, colors change based on price's relationship to each one.
I thought this was a really cool indicator that could be used for people like me who like knowing the right information, but HATE having their charts clustered with a ton of stuff. Hope you all like it, enjoy!

Squeeze Momentum 3# Squeeze Momentum 3
First of All, I would like to give my gratitude to for the initital script's idea.
This is my own version of SQZMOM. I had revised all equations and parameters according to Investopedia.
Still, no matter how much we stick to the indicator, the indicator can not see the future.
Trading results vary from time to time. In my opinion, SQZMOM is great for speculating under 4H timeframe.
Remarks;
- implement horizontal shift
- revised all equations. Unfortunately, there is no magic params.
- Be careful with your money management
- Good Luck

Stacked EMAsStacked Daily & Weekly EMAs + Labels
Pretty much self-explanatory indicator that shows the current momentum based on the key exponential moving averages.
Three stages of the EMAs:
1. Stacked Positively (Bullish) - EMAs are stacked on top of each other which represents a healthy bullish uptrend (green Label).
2. Stacked Negatively (Bearish) - EMAs are stacked below each other meaning the trend is bearish (red label).
3. Stacked Neutral (Neutral) - EMAs are crossing each other without any clear direction = chop (yellow label).
Hope it helps.

LNL Squeeze ArrowsIf you struggle with the entries, low % win rate or trading the squeeze setup overall, this indicator is for you!
If you look closely at your losing trades, chances are the losers have one thing in common = inverse momentum. I created this tool after I found out that Stacked EMAs and picture perfect trend is not the only thing you need for a squeeze setup. Squeeze arrows pinpoint the exact moment where the squeeze momentum change happens (momentum change is absolutely crucial for the squeeze setup). These arrows will help you stay out of "everything was aligned but still failed" type of setups.
Squeeze Arrows:
1. Momentum Arrows (cyan blue/red) - Showing the best possible moment for an entry during the squeeze (after you see one, you can expect the squeeze to fire soon).
2. Slingshot Arrows (yellow) - Even though you can trade off of them, these arrows work mostly as a confirmation & caution tool. If an inverse slingshot arrow is plotted during a squeeze that means caution = you should wait because momentum is not on your side thus there there is a quite high probability that the squeeze can fire the other direction.
Squeeze Dots Trigger:
Represents the number of red dots (squeeze) after which the arrows should plot. Default = 5 (only after 5 red dots, arrows will appear), some traders like to set it on 3 or even 1.
Tips & Tricks:
1.Breakout or Bailout Mentality
- The big advantage of the arrows is the fact that they either work straight away or they don't. This is where you can apply the breakout or bailout mentality and really focus exclusively on the breakout part of the whole squeeze move. You can minimize the risk by putting mental stops just a few points below the last low of the candle where the arrows appeared. That way you can be stopped out even during the squeeze = won't hurt as much as when the squeeze fire the opposite direction. Reward may be the same but the risk is lower.
2. Yellow Flags
- Use the slingshot arrows as a caution tool. Even if all your squeeze criteria are met. Yellow inverse arrow = caution (wait for the true momentum change). Once the slingshot arrow appears in the conext of the trend, you are good to go.
3. Last Arrow Rule
- Sometimes you will see a lot of arrows during the longer squeezes. This is where the last arrow rule come in handy. The last arrow you see on chart can be canceled anytime by a new one. The last arrow is the valid one!
Hope you can squeeze from these squeeze arrows as much as there is to squeeze so you can finally trade the squeeze with ease.
Hope it helps.

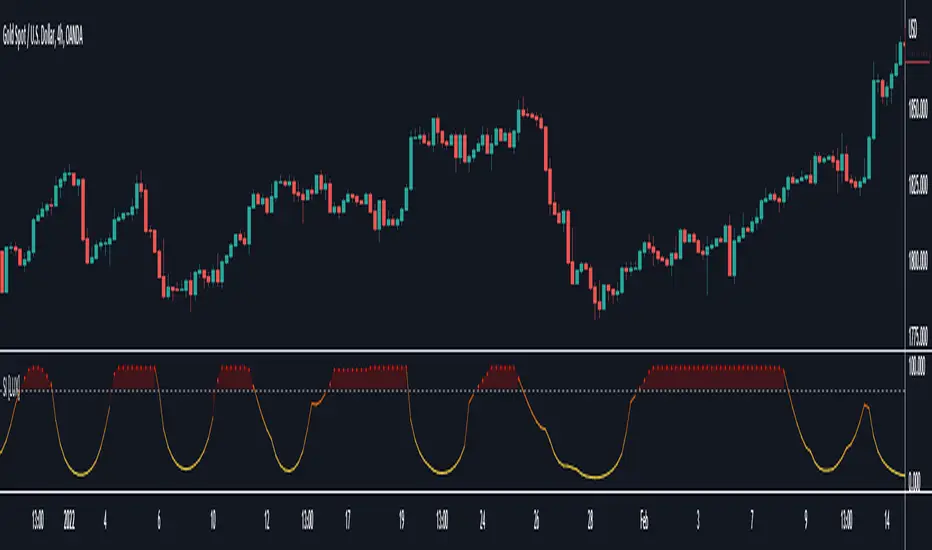
LNL Fractal EnergyMarkets knows only two movements. Expansion and Consolidation. The price is either moving or it is consolidating. Fractal Energy will show you which move is about to happen. The funny thing is.. Fractal Energy will NOT tell you the direction of the potential move nor the time when the move will happen. It only shows whether the energy is accumulating or exhausting and which one of these moves are about to happen.
Fractal Energy Zones:
1. Gray = Neutral Energy, price will spend most of the time between the 0.60 and 0.30 ranges, if the FE is hanging around midline chop can be expected.
2. Pink = Energy Building (low compression), pink can produce solid moves but can turn in to a red or dark red which are way more powerful.
3. Red = Energy Building (yet to be released), once the FE colors red there is a high probability for a bigger than expected move.
4. Dark Red = Energy Building (high compression), dark red is rare and can be seen usually around earnings reports (explosive move can be expected).
5. Yellow = Energy Released = Exhaustion, everything ends at some point, yellow color represents the exhaustion of the move (the car ran out of gas).
6. Orange = Extreme Exhaustion, high probability for a sideways action or a reversal.
Tips & Tricks:
1. Importance of the Midline:
- Midline can be used as a target for the compressions. Once the FE reach the midpoint, the move is usually considered to be over.
2. Huge Gaps on earnings DO NOT COUNT:
- If the price heavily gaps up or gaps down, FE usually drops too steep with the gap thus signals after such moves can be ignored.
3. Fractal Energy Length & Time Frames:
- For the daily & weekly time frame length of 13 works nicely. But for the lower TF length 13 starts to lag behind the price a little. I would suggest using Length 15 for 30min to 4 hour and Length 17 - 20 for below 30min time frames.
4. Exhaustions:
- Exhaustions can be played too. Once the FE drops below 0.30 the price usually stays within the weekly expected move (great for iron condors), or non directional option strategies.. yellow/orange = price either reverse or stays at same levels for a few candles..
5. Combination of direction based studies with the magnitude based studies:
- Use the FE as a confirmation of your analysis from other (direction-based) trend or momentum indicators. Once you analyze your direction you can use Fractal Energy (magnitute-based) indicator to analyse whether there is a chance for a big move or not.
Hope it helps.

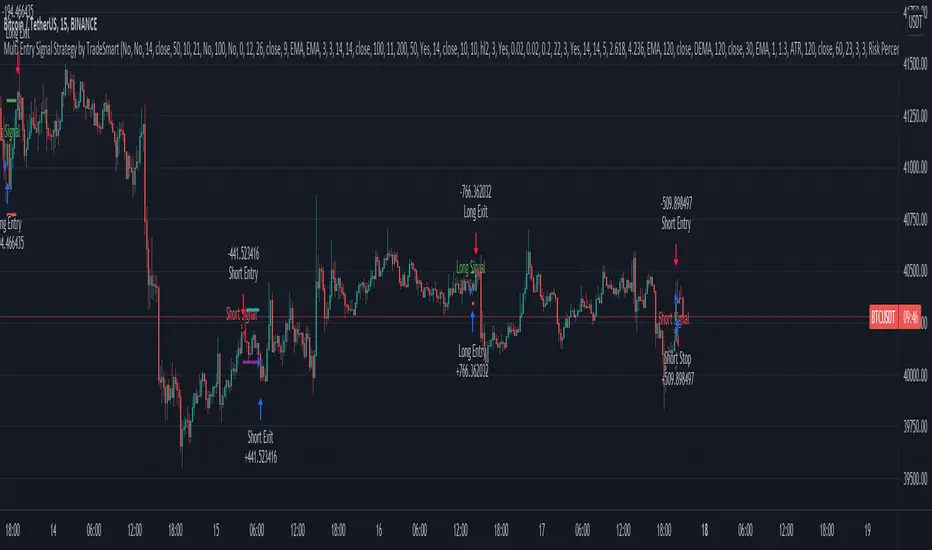
Multi Entry Signal Strategy by TradeSmartThis strategy is intended to test different entry signals. You can use 13 different entry signals in the strategy.
Available signals with all their settings:
Heikin Ashi
RSI + EMA
Wavetrend
MACD
Stochastic RSI
Squeeze Momentum
Kairi Relative Index
SSL
Supertrend
Parabolic SAR
Chandelier Exit
Directional Movement Index
Quantitative Qualitative Estimation
For exact rules of entries please relate to the tooltips of each entry signal. All the signals can be used together or separately in the strategy.
Additional settings that can be used:
Trend Filter (limit long or short entries based on a moving average of your choice)
Exit Strategy settings (ATR is used to determine stop loss and take profit levels)
Trailing Loss Setups (you can use 3 different types of trailing losses)
Setups (you can set Long and Short entries as well as the order size based on either Capital % or Risk %)
Date Range (you can limit trades to specific date ranges)
Trading Time (you can limit on which days to trade)
Squeeze M + ADX + TTM (Trading Latino & John Carter) by [Rolgui]About this indicator:
This indicator aims to combine two good performing strategies, which can be used separately or together, mainly for investment positions, although it can also be used for intraday trading.
Strategy 1) Squeeze Oscillator and Average Directional Index:
This strategy is taught by Jaime Aibsai, which determines market entries based on reading the direction of the price movement (Directionality of the Oscillator) along with the strength of the Oscillator (Slope of the ADX).
Both tools are configured according to Jaime Abisai's strategy, by default (note that point 23 of the ADX is represented by point 0 on the panel, to make reading easier, its interpretation is not affected). Anyway you can adjust the input data according to your interest.
*You can see this setting in the first panel.
Strategy 2) Squeeze Momentum and Trade The Market Waves:
This strategy can be consulted either in John F. Carter's books or on his website.
This market reading is based on Price Volatility (Bollinger Bands and Keltner Channels interaction) and its Trend (Exponential Moving Averages), showing entries at times when price volatility is low and taking filtering active trend using T.T.M. Waves.
To configure the indicator in the same way that Carter does, it would be enough to turn off the ADX, turn on the Squeeze Momentum signals along with the T.T.M. Waves, and importantly, change the Linear Momentum value to 12 (this configuration can be found in his book).
*You can see this setting in the second panel.
Why this indicator?
I've added and removed the above flags as I needed to query them (which became tedious for me). The main objective of having merged them into one is to make their reading more agile and comfortable and thus improve the decision-making capacity of the trader who wishes to use them.
Credits and Acknowledgments:
I would like to give credits to other authors, for the sections of code that I have used to make this technical indicator. Thanks to @LazyBear, @matetaronna, @jombie and @joren for contributing to the community and keeping their code open. It is priceless!
Feel free to combine and practice your trading with both strategies, personally, they improved my profitability and this is why I recommend researching more about them. I've been using it for crypto investing, let me know if it's worth for you on stock market!
If you have any questions or suggestions you can leave it in the comments!
Greetings!

StapleIndicatorsLibrary "StapleIndicators"
This Library provides some common indicators commonly referenced from other studies in Pine Script
squeeze(bbSrc, bbPeriod, bbDev, kcSrc, kcPeriod, kcATR, signalPeriod) Volatility Squeeze
Parameters:
bbSrc : (Optional) Bollinger Bands Source. By default close
bbPeriod : (Optional) Bollinger Bands Period. By default 20
bbDev : (Optional) Bollinger Bands Standard Deviation. By default 2.0
kcSrc : (Optional) Keltner Channel Source. By default close
kcPeriod : (Optional) Keltner Channel Period. By default 20
kcATR : (Optional) Keltner Channel ATR Multiplier. By default 1.5
signalPeriod : (Optional) Keltner Channel ATR Multiplier. By default 1.5
Returns:
adx(diPeriod, adxPeriod, signalPeriod, adxTier1, adxTier2, adxTier3) ADX: Average Directional Index
Parameters:
diPeriod : (Optional) Directional Indicator Period. By default 14
adxPeriod : (Optional) ADX Smoothing. By default 14
signalPeriod : (Optional) Signal Period. By default 13
adxTier1 : (Optional) ADX Tier #1 Level. By default 20
adxTier2 : (Optional) ADX Tier #2 Level. By default 15
adxTier3 : (Optional) ADX Tier #3 Level. By default 10
Returns:
smaPreset(srcMa) Delivers a set of frequently used Simple Moving Averages
Parameters:
srcMa : (Optional) MA Source. By default 'close'
Returns:
emaPreset(srcMa) Delivers a set of frequently used Exponential Moving Averages
Parameters:
srcMa : (Optional) MA Source. By default 'close'
Returns:
maSelect(ma, srcMa) Filters and outputs the selected MA
Parameters:
ma : (Optional) MA text. By default 'Ema-21'
srcMa : (Optional) MA Source. By default 'close'
Returns: maSelected
periodAdapt(modeAdaptative, src, maxLen, minLen) Adaptative Period
Parameters:
modeAdaptative : (Optional) Adaptative Mode. By default 'Average'
src : (Optional) Source. By default 'close'
maxLen : (Optional) Max Period. By default '60'
minLen : (Optional) Min Period. By default '4'
Returns: periodAdaptative
azlema(modeAdaptative, srcMa) Azlema: Adaptative Zero-Lag Ema
Parameters:
modeAdaptative : (Optional) Adaptative Mode. By default 'Average'
srcMa : (Optional) MA Source. By default 'close'
Returns: azlema
ssma(lsmaVar, srcMa, periodMa) SSMA: Smooth Simple MA
Parameters:
lsmaVar : Linear Regression Curve.
srcMa : (Optional) MA Source. By default 'close'
periodMa : (Optional) MA Period. By default '13'
Returns: ssma
jvf(srcMa, periodMa) Jurik Volatility Factor
Parameters:
srcMa : (Optional) MA Source. By default 'close'
periodMa : (Optional) MA Period. By default '7'
Returns:
jBands(srcMa, periodMa) Jurik Bands
Parameters:
srcMa : (Optional) MA Source. By default 'close'
periodMa : (Optional) MA Period. By default '7'
Returns:
jma(srcMa, periodMa, phase) Jurik MA (JMA)
Parameters:
srcMa : (Optional) MA Source. By default 'close'
periodMa : (Optional) MA Period. By default '7'
phase : (Optional) Phase. By default '50'
Returns: jma
maCustom(ma, srcMa, periodMa, lrOffset, almaOffset, almaSigma, jmaPhase, azlemaMode) Creates a custom Moving Average
Parameters:
ma : (Optional) MA text. By default 'Ema'
srcMa : (Optional) MA Source. By default 'close'
periodMa : (Optional) MA Period. By default '13'
lrOffset : (Optional) Linear Regression Offset. By default '0'
almaOffset : (Optional) Alma Offset. By default '0.85'
almaSigma : (Optional) Alma Sigma. By default '6'
jmaPhase : (Optional) JMA Phase. By default '50'
azlemaMode : (Optional) Azlema Adaptative Mode. By default 'Average'
Returns: maTF

AR Peti Kemas Candle Cross EMA8 EMA13 EMA21 EMA55 EMA90 EMA200This is implementation of Peti Kemas. Slighly modified for the selection of EMA period, but user can change the period.
The strategy is if the current candle close is below EMA90 and EMA200, the buy signal is generated when the close crosses up EMA13.
When the close above EMA90 and ENA200, then the buy signal is generated when the close crosses up EMA8
