Keltner | Bollinger | SqueezePercent B (%B), it's derivation Percent K (%K) and squeeze indicator combined in one.
blue line = bollinger %
orange line = keltner %
red background = squeeze*
squeeze = bollinger bands are inside (encapsulated by) keltner channel
Squeeze

(JS) Squeeze Pro 2This is my version of the updated classic indicator created by John Carter. I plan on adding a Squeeze Overlay script in the future that will pair with this one as well for additional signals.
So to break down the Squeeze, what it is, how it works, etc - you have to look at the components that make it up.
1. Bollinger Bands
2. Keltner Channels
3. Momentum
The momentum in this indicator is smoothed out using linear regression (shout out to Lazy Bear, it's a much simpler way to do it, imo).
The momentum is what is displayed on the indicator as a histogram, its purpose is obvious (to show momentum).
Now what is a Squeeze? A squeeze occurs when Bollinger Bands tighten up enough to slip inside of Keltner Channels.
This is interpreted as price is compressing and building up energy before releasing it and making a big move.
Traditionally, John Carter's version uses 20 period SMAs as the basis lines on both the BB and the KC.
In my version, I've given the freedom to change this and try out different types of moving averages.
His original squeeze indicator had one Squeeze setting, though this new one has three .
The white dot Squeeze , call it a "low squeeze", an "early squeeze", whatever you'd like - this is the easiest Squeeze to form based on its settings.
The red dot Squeeze is the original from the first Squeeze indicator.
And finally, the yellow dot squeeze , call it a "high squeeze", "power squeeze", once again whatever you want - is the most difficult to form and suggests price is under extreme levels of compression.
From what I've witnessed John Carter say in the past, the squeeze is meant to be used for continuation.
Now to explain the parameters:
Squeeze Input - This is just the source for the Squeeze to use, default value is closing price.
Length - This is the length of time used to calculate the Bollinger Bands and Keltner Channels.
Bollinger Bands Calculation Type - Selects the type of moving average used to create the Bollinger Bands.
Keltner Channel Calculation Type - Selects the type of moving average used to create the Keltner Channel.
Color Format - I have created 5 different color schemes, this allows you to choose one.
Draw Divergence - Self explanatory here, this will auto-draw divergence on the indicator.
Gray Background for Dark Mode - This is something I put on all my indicators to make them more visually appealing.
Moving on to the alerts, I have made some basic alerts to notify certain indicator conditions (I had to revise it back from the prior version, as V4 of PineScript limits outputs).
6th Dot Alerts - This will inform you when a certain Squeeze makes it 6 dots in. Why 6 dots? That is what John Carter said to be his preference.
12th Dot Alerts - Think of this as a "prolonged Squeeze" alert. I feel like if they do run this long you likely need to go up in resolution, but some traders prefer certain time increments so this is for them.
End of Squeeze Alerts - Self explanatory again - once a Squeeze has concluded this will provide you with a notification.
Start of Squeeze Alerts - Opposite of the alert above, notifications come when a Squeeze begins.
Zero Line Alerts - This will inform you of when the momentum makes a bullish or bearish move across the zero line.
I hope that I've done well enough explaining the indicator and how it works, for any further information on it I suggest you check out Simpler Trading and get linked up with John Carter over there.
He does lots of videos, webinars, and of course you can always get the official indicator and his signals there too.
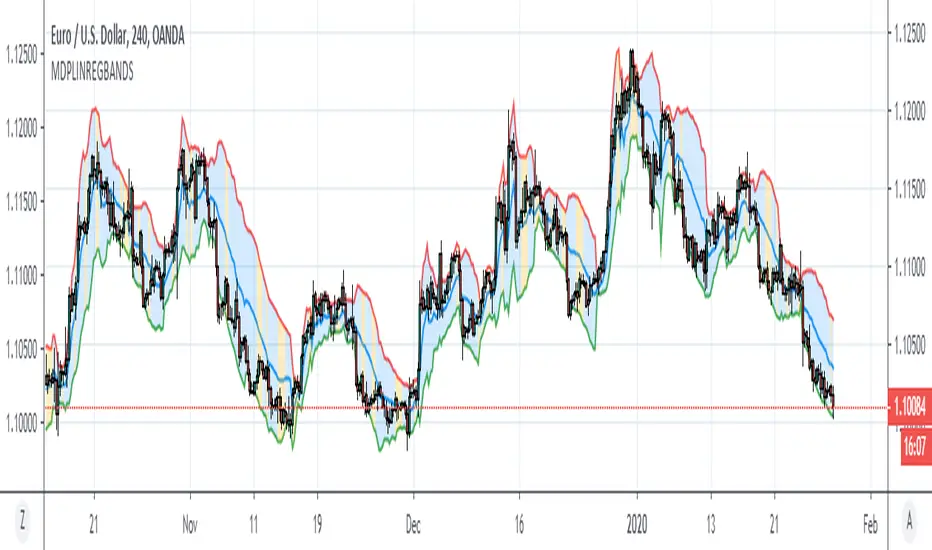
Minkowski Distance Period Linear Regression BandsHello, this script was created by using Linear Regression Bands Function with variable Function Minkowski Distance Adaptive Period.
Function Linear Regression Bands :
Minkowski Distance Function Original Script by RicardoSantos :
Functions saved from overloads . And suitable for mutable variable periods.
Regards.
Study for Squeeze Momentum Indicator [LazyBear]This study is based on LazyBear Squeeze Momentum Indicator and my strategy developed using it.
I added some custom feature and filters.
Main improvements are:
1- study is updated to version 4 of pine script;
2- I added alerts for entry rules and exit rules.
3- Alert syntax can be customized for webhooks: I added one example only for long entry.
You can customize a lot of features to get a profitable strategy.
Here is a link to original study.
Please use comment section for any feedback.

M-SQUEEZEScript for Swing Trading. It use the following indicators:
- SQUEEZE MOMENTUM INDICATOR (LAZYBEAR)
- RSI VOLUME WEIGHTED (LAZYBEAR)
- PARABOLIC SAR
Settings for OANDA:SPX500USD at 2H

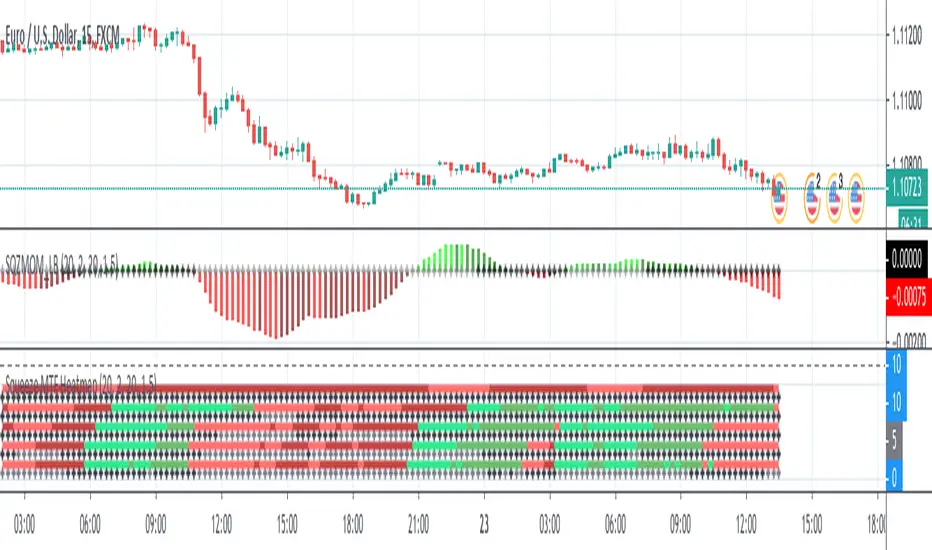
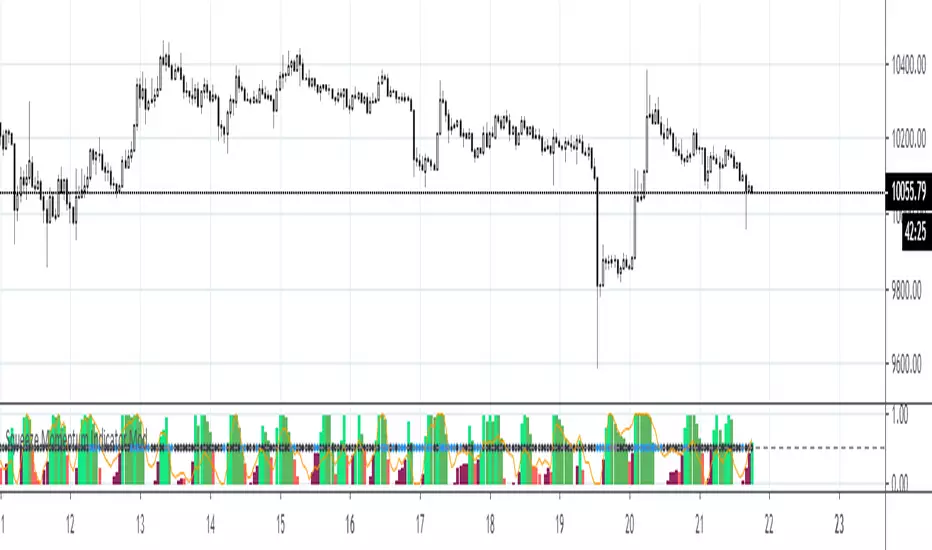
Squeeze MTF HeatmapHere is a multi-timeframe heat map using one of the most apreciated indicators in Tradingview: Squeeze Momentum Indicator by LazyBear.
Study shall be added to 15min chart.
It indicates squeeze and momentum at: 15 min, 30 min, 60 min, 240 min and 1 Day.
Thanks to © azimuthdynamics for inspiration and portion of code
Thanks to Lazy Bear for coding Squeeze Momentum Indicator
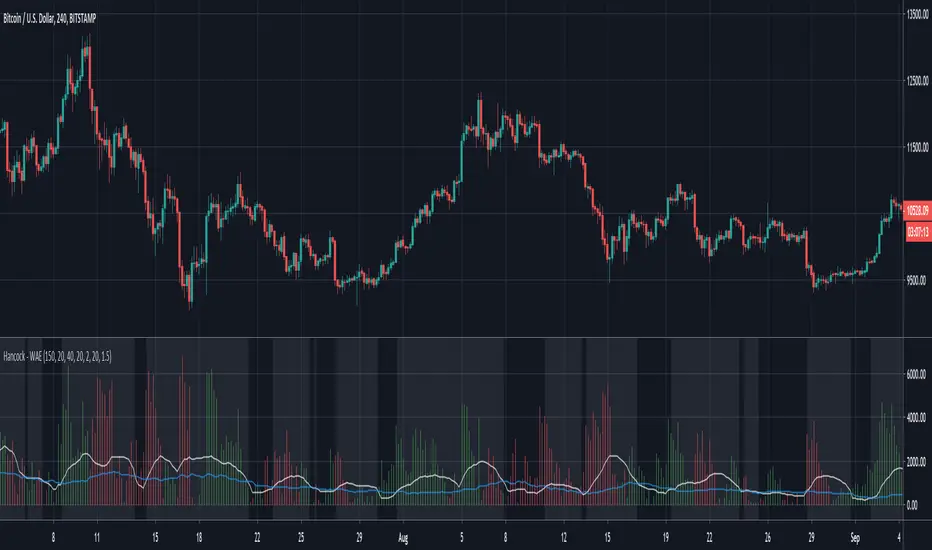
Hancock - WAEThis is a version of the LazyBear Waddah Attar Explosion indicator that incorporates the LazyBear Squeeze Momentum Indicator. Full credit goes to LazyBear for this and i've added links to his indicators used for a further explanation.
This histogram is a plot of the difference between the current and previous MACD multiplier by the sensitivity value. Green indicates an up trend and red indicates a down trend.
The white line is the lower BB subtracted from the upper BB and signals should be taken when the histogram is greater than this line.
The blue line is taken from the Squeeze Indicator and is the Keltner Channel. If the white line is less than the blue line it can be considered a squeeze and the background color of the indicator is coloured to indicate when not in a squeeze.
Happy trading folks!
Hancock
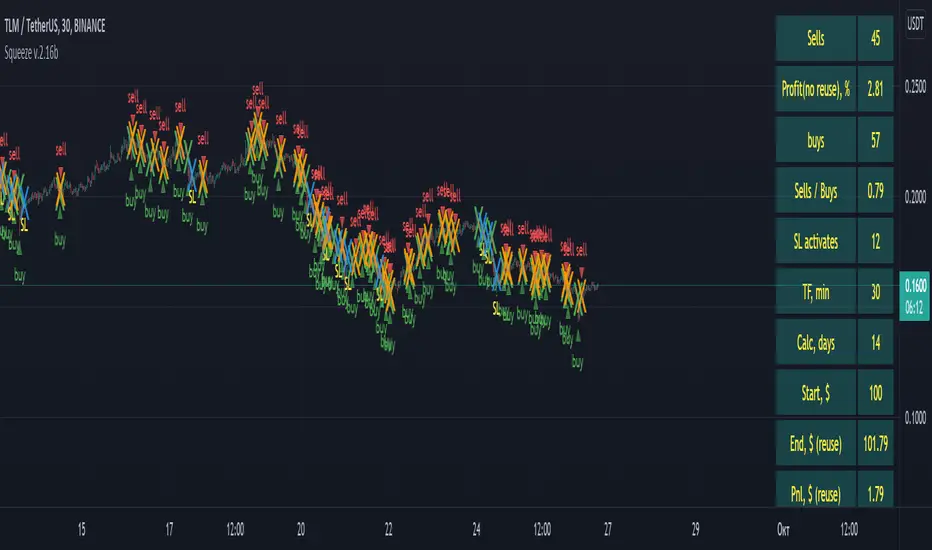
Squeeze control. Version 1.4 Check the squeezed bot settings on the chart. In this version added calculation of the number of sold and unsold transactions (if purchased by the indicator), profit, including when reusing funds. It should be understood that the display of the purchase and sale will not provide a 100% probability of order execution if the pointer is at a local high or low price. Checking the sale in this version of the script (subject to the previously created conditions for the purchase) is carried out for 5 chart candles.
Проверь настройки сквиз бота на графике. Добавлен подсчет количества проданных и непроданных сделок (если по индикатору куплено), профит, в том числе при переиспользовании средств. Следует понимать, что отображение покупки и продажи не обеспечит 100% вероятность выполнения ордера, если указатель находится на локальном high или low цены. Проверка продажи в данной версии скрипта (при условии созданных ранее условий для покупки) производится для 5 свеч графика.
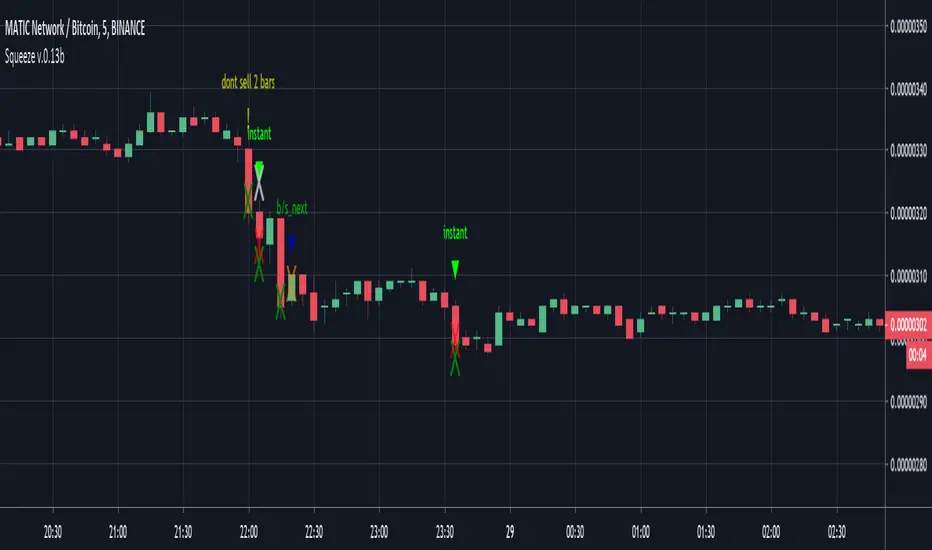
Squeeze control. Version standart 0.13b Check the squeezed bot settings on the chart. The check can be carried out with different binding to the previous candle. It should be understood that the display of the purchase and sale will not provide a 100% probability of order execution if the pointer is at a local high or low price. Checking the sale in this version of the script (subject to the previously created conditions for the purchase) is performed for the current and next candles.
Проверь настройки сквиз бота на графике. Проверка может проводится при разной привязке к предыдущей свече. Следует понимать, что отображение покупки и продажи не обеспечит 100% вероятность выполнения ордера, если указатель находится на локальном high или low цены. Проверка продажи в данной версии скрипта (при условии созданных ранее условий для покупки) производится для текущей и следующей свечи.
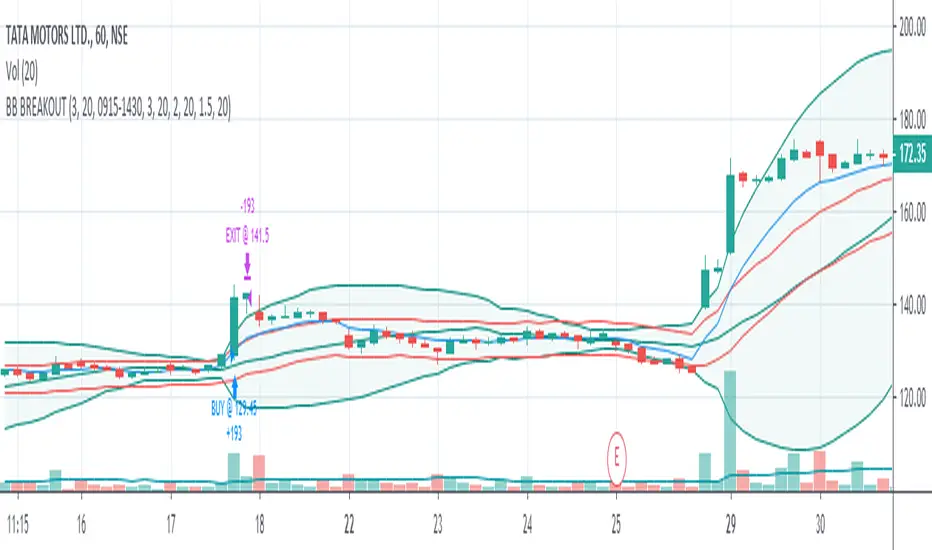
R100 Volatility Combo Bands v1 (*v*)The Volatility Combo Bands are made from 4 separate volatility bands- two Bollinger Bands (10 and 20 period) and two Price Headley Acceleration Bands (10 and 20 period). The Volatility Combo Bands plot the innermost upper and lower points from these bands and then plots a mid-line. By default, only the standard 20 period Bollinger Bands and Combo Bands with mid-line are displayed, but can be configured however you want.
Try it out- see squeezes earlier, ride the bands earlier in trending markets, trade pullbacks to the Combo Bands and mid-line, trade the range of the band or use them to help identify potential support and resistance levels. Hopefully they can add another dimension to identifying volatility contraction patterns or whatever you currently use these things for!
I hope you get some value out of it. Only conditions of use are that if you improve it, let me know and if you publish something that uses it, don't hide the code! Enjoy!
Code for the Price Headley Acceleration Bands pinched and modified from LazyBear - thankyou.

Dependent Variable Odd Generator Risk Detector
In fact, I wrote this script for detect Bollinger and Linear Regression Bands squeeze.
It's a side script.
Logic works like this:
Only the stagnant market probability is drawn from the Bollinger bandwidth by Dependent Variable Odd Generator and MFI index is calculated taking into account the volume.
This value ranges from 0 to 100.
To be sure, this value is averaged over a small period.
If you break the average and exceed 50, the bollinger band is too narrow and the risk is too high.
This means more commissions, more transactions, and vain work.
Or, when in position, the warning is not ignored due to unnecessary signals.
This code is open source under the MIT license. If you have any improvements or corrections to suggest, please send me a pull request via the github repository github.com
Stay tuned , best regards.

MS MONEY CCI SQUEEZEAbout
I have used this indicator to find many lucrative opportunities. This indicator takes the moving average of CCI in custom, volatility-specific conditions. CCI measures "overbought" in the red-shaded region and "Oversold" in the green-shaded region. The shaded regions do not constitute a buy/sell signal alone, the MS CCI Squeeze is best used when market conditions agree and is best used when the user has fundamental reasoning for "reversal-like" situations to align. The MS CCI Squeeze will soon have a synergistic partner called "MS RSI Squeeze" indicator that will look similar to help better measure volatility and strength trend.
About the Commodity Channel Index (CCI)
The commodity channel index (CCI) is an oscillator originally introduced by Donald Lambert in 1980. Since its introduction, the indicator has grown in popularity and is now a very common tool for traders in identifying cyclical trends not only in commodities, but also equities (stocks) and currency trading.
How to set an Alert
If the user wants to set an alert , click on one of the support/ resistance lines (black-dashed) near the zero mark. Clicking on the horizontal line above or below the zero line will populate a yellow arrow which will allow you to set alerts when wanted.
Please Read For Better Efficiency
When using this indicator, keep an eye out for harmonic patterns, both bullish and bearish head and shoulders patterns for "HIDDEN" breakout opportunities.
Please like, follow and share and I will continue building better indicators.

Squeeze [LazyBear] w Murat ColorsOriginal by @LazyBear
Differents:
scolor => white & black
plot histogram => linewidth=5
plot style => circles, linewidth => 4, transp => 0

Function : Linear Regression Bands
Used with Pearson Correlation. It can be used to make sense of the trends. Very successful results can be obtained with a MACD style indicator and volume indicator that gives Buy and Sell orders.Open for adaptive and mutable variable periods of moving averages. Best regards!

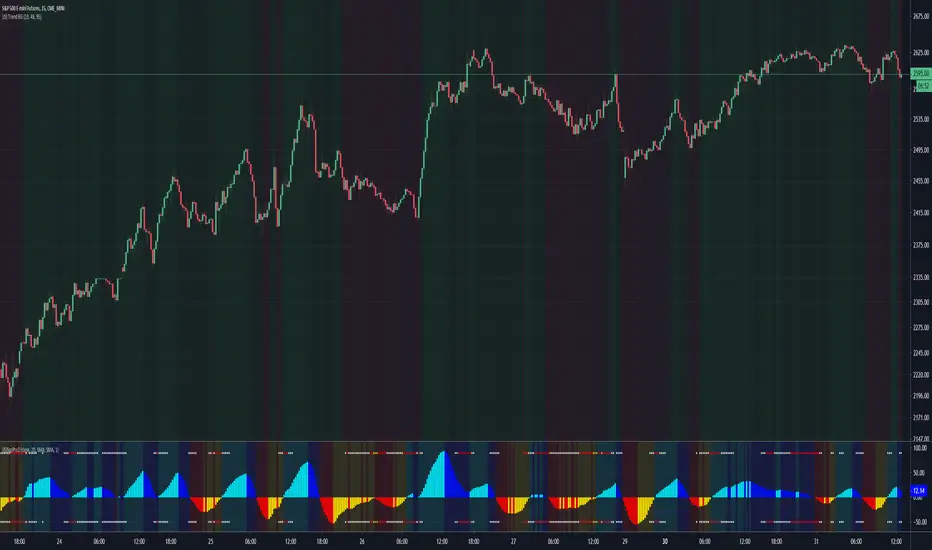
Nik_Chop_OverlayNASDAQ:AAPL
A tool/ indicator to predict volatility mean reversion zone for both scalper and Trend Traders
Green Zone: Market to possibly remain Sideways / Choppy / Squeeze predicted
Blue Label up : sideways move started (Market to possibly stay in range for next appx. 4 to 8 bars, relative to past 7 to 15 bars)
Red Arrow : Volatility most like to increase (In any direction)
Scalpers : Entry and Exit in Green zone
Trend Traders : Avoid Green zones or be patient in green zone

Squeeze Momentum Indicator ModThis is a scaled version of LazyBear's Squeeze Momentum Indicator. Also added are fibo-based periods for BB and KC.
Auto Squeeze Breakout BarsThe Auto Squeeze Breakout Bars find bars that are breaking out of a low volatility environment into a high volatility environment.
The Squeeze shading is signaled when the volatility of the asset is very low. Then the Squeeze Breakout Bars are signaled when the asset is breaking out of this low volatility structure.
Warning bars will be signaled when it is approaching a breakout, but the conditions are not fully met at that very time.
The Auto Squeeze Breakout Bar indicator also has a built in stop loss mechanic that can be set to your preferred limit.
Stop losses are highly recommended when using the breakout bars because of possible head fakes. They are rare, but can occur depending on the asset you are trading.
For Access or Questions: Private message us. Thank you.

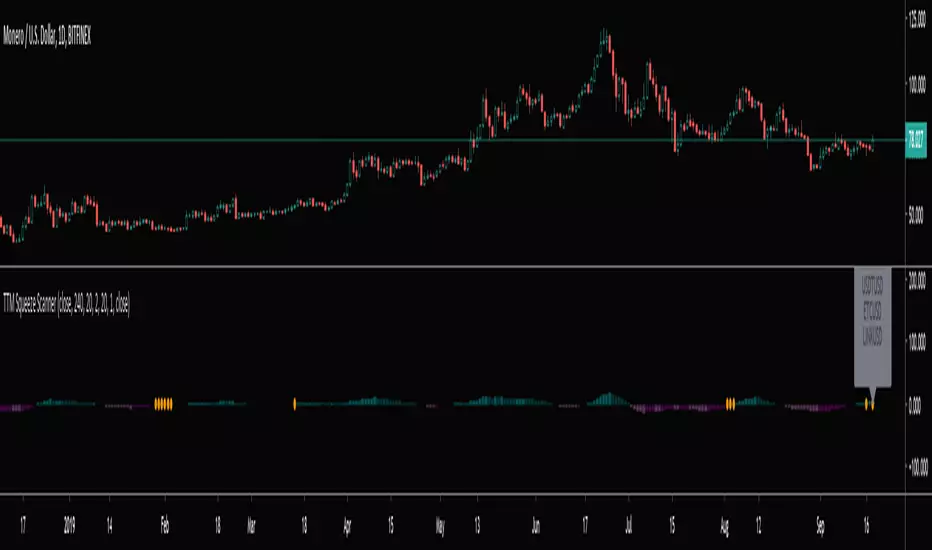
TTM Squeeze Scanner This script scans for TTM Squeezes for the crypto symbols included in the body of the script. The timeframe for the squeeze scan is controlled within the input not the chart.
This script is a merge of @Nico.Muselle's TTM Squeeze script and @QuantNomad's custom screener script. Thanks to both of them!
MACD SqueezeJust saw this on a particular website and created my version of it.
A practical modification of MACD and Squeeze Momentum. The MACD histogram is colored in green or red depending on whether the squeeze momentum is active or not.
Additionally, the MACD line is colored green if the RSI is oversold and red if it's in the overbought levels.

AEONDRIFT-KThis is a special edition of the AEONDRIFT Band that is implemented in my Strategies , which have substantially boosted their profitability.
Squeeze Zone = Increase chance for a big move to happen. I used this to decrease (buy/sell) trading thresholds in my strategy scripts to increase the chances of making a trade.
No Trading Zone = Increase chances for bad trades due to difficulty for indicators to . As the name implies, I used this to disable trading completely during this period.
Alerts are enabled for these states.
~ * ~ * ~ * ~ * ~ * ~ * ~ * ~ * ~ * ~ * ~ * ~ * ~ * ~ * ~ * ~ * ~ * ~ * ~ * ~ * ~
Note:
In no way is this intended as a financial/investment/trading advice. You are responsible for your own investment decisions and trades.
Please exercise your own judgement for your own trades base on your own risk-aversion level and goals as an investor or a trader. The use of OTHER indicators and analysis in conjunction (tailored to your own style of investing/trading) will help improve confidence of your analysis, for you to determine your own trade decisions.
~ * ~ * ~ * ~ * ~ * ~ * ~ * ~ * ~ * ~ * ~ * ~ * ~ * ~ * ~ * ~ * ~ * ~ * ~ * ~ * ~
Please check out my other indicators sets and series, e.g.
LIVIDITIUM (dynamic levels),
AEONDRIFT (multi-levels standard deviation bands),
FUSIONGAPS (MA based oscillators),
MAJESTIC (Momentum/Acceleration/Jerk Oscillators),
PRISM (pSAR based oscillator, with RSI/StochRSI as well as Momentum/Acceleration/Jerk indicators),
PDF (parabolic SAR /w HighLow Trends Indicator/Bar-color-marking + Dynamic Fib Retrace and Extension Level)
and more to come.
Constructive feedback and suggestions are welcome.
~ JuniAiko
(=^~^=)v~
AEONDRIFT
Strategy Scripts:
Cyber Momentum Strategy
Cyber Ensemble Strategy
See Also: Relative Candle Volatility & Directionality Index (RCVI and RCDI)

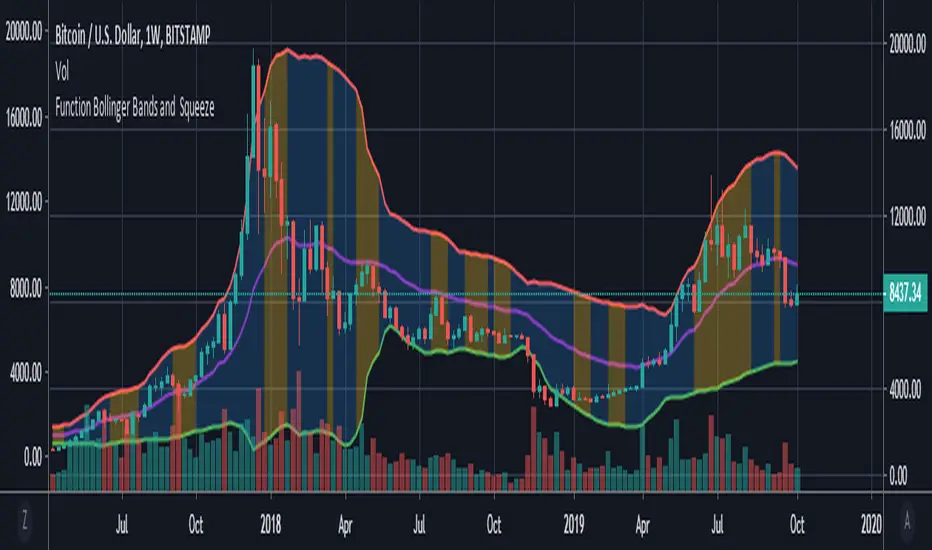
Function : Bollinger Bands and BBW Squeeze DetectorThis script shows Bollinger Bands function and want to detect Bollinger Band Width Squeeze with a successful, different perspective .
Bollinger Bands : You can specify the Bollinger Bands periods as mutable variables .
Bollinger Band Width Squeeze : First the Bollinger bands width was calculated.The width was then divided into levels using the money flow index.
Thus, the bollinger takes into account the available volume averages when calculating the band width mfi (Money Flow Index).
After this modelling, we can limit and color the lower limit and upper limits just as Relative Strength Index.
We can even put warnings on oversold areas if desired. Let's not forget that we are working with width rather than price.
By design, squeeze areas are defined directly above the Bollinger Bands with coloration. I think it is very practical and looks stylish.
I tried and found it quite successful and wanted to share it with users.
I came up with many ideas when I wrote this system, and I will share them very soon . I hope it will be useful to users and give new ideas.
Best regards.