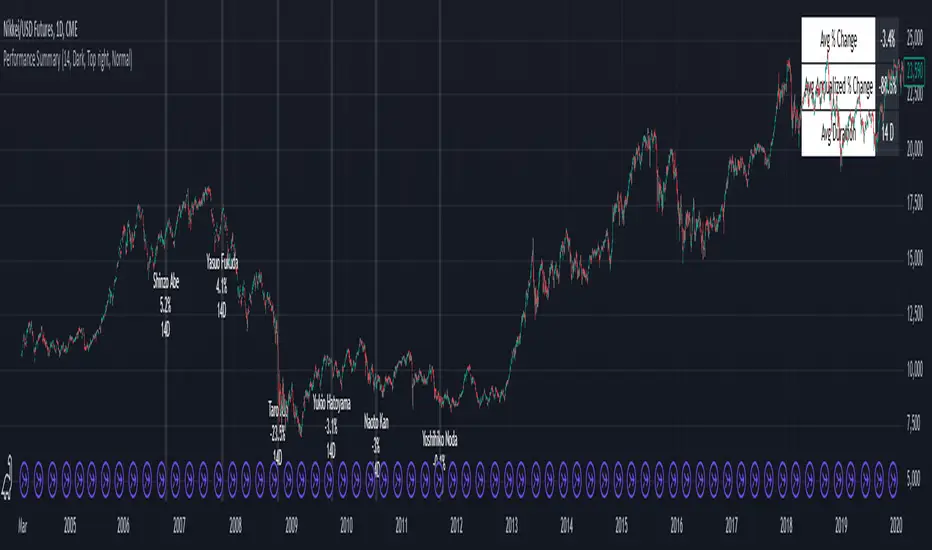
Performance Summary and Shading (Offset Version)Modified "Recession and Crisis Shading" Indicator by @haribotagada (Original Link: )
The updated indicator accepts a days offset (positive or negative) to calculate performance between the offset date and the input date.
Potential uses include identifying performance one week after company earnings or an FOMC meeting.
This feature simplifies input by enabling standardized offset dates, while still allowing flexibility to adjust ranges by overriding inputs as needed.
Summary of added features and indicator notes:
Inputs both positive and negative offset.
By default, the script calculates performance from the close of the input date to the close of the date at (input date + offset) for positive offsets, and from the close of (input date - offset) to the close of the input date for negative offsets. For example, with an input date of November 1, 2024, an offset of 7 calculates performance from the close on November 1 to the close on November 8, while an offset of -7 calculates from the close on October 25 to the close on November 1.
Allows user to perform the calculation using the open price on the input date instead of close price
The input format has been modified to allow overrides for the default duration, while retaining the original capabilities of the indicator.
The calculation shows both the average change and the average annualized change. For bar-wise calculations, annualization assumes 252 trading days per year. For date-wise calculations, it assumes 365 days for annualization.
Carries over all previous inputs to retain functionality of the previous script. Changes a few small settings:
Calculates start to end date performance by default instead of peak to trough performance.
Updates visuals of label text to make it easier to read and less transparent.
Changed stat box color scheme to make the text easier to read
Updated default input data to new format of input with offsets
Changed default duration statistic to number of days instead of number of bars with an option to select number of bars.
Potential Features to Add:
Import dataset from CSV files or by plugging into TradingView calendar
Example Input Datasets:
Recessions:
2020-02-01,COVID-19,59
2007-12-01,Subprime mortgages,547
2001-03-01,Dot-com,243
1990-07-01,Oil shock,243
1981-07-01,US unemployment,788
1980-01-01,Volker,182
1973-11-01,OPEC,485
Japan Revolving Door Elections
2006-09-26, Shinzo Abe
2007-09-26, Yasuo Fukuda
2008-09-24, Taro Aso
2009-09-16, Yukio Hatoyama
2010-07-08, Naoto Kan
2011-09-02, Yoshihiko Noda
Hope you find the modified indicator useful and let me know if you would like any features to be added!
Statistics
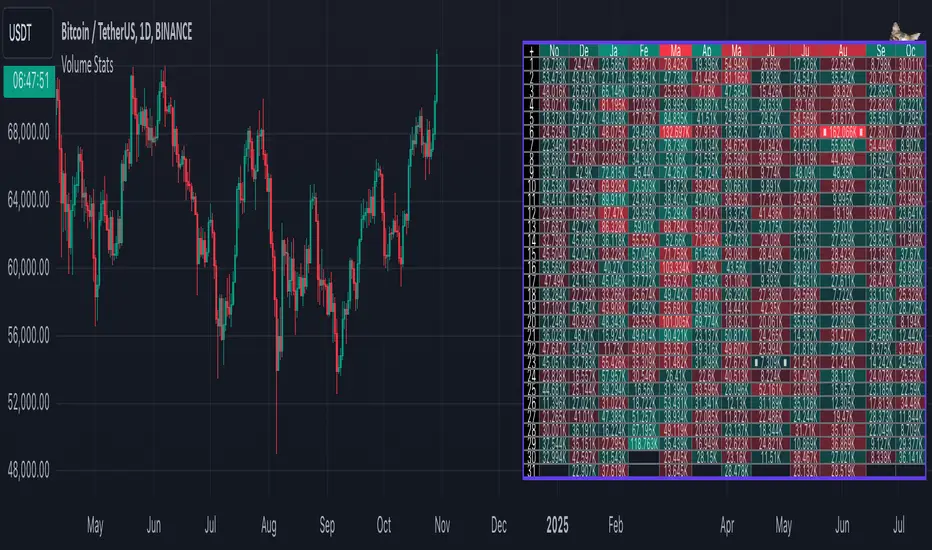
Volume StatsDescription:
Volume Stats displays volume data and statistics for every day of the year, and is designed to work on "1D" timeframe. The data is displayed in a table with columns being months of the year, and rows being days of each month. By default, latest data is displayed, but you have an option to switch to data of the previous year as well.
The statistics displayed for each day is:
- volume
- % of total yearly volume
- % of total monthly volume
The statistics displayed for each column (month) is:
- monthly volume
- % of total yearly volume
- sentiment (was there more bullish or bearish volume?)
- min volume (on which day of the month was the min volume)
- max volume (on which day of the month was the max volume)
The cells change their colors depending on whether the volume is bullish or bearish, and what % of total volume the current cell has (either yearly or monthly). The header cells also change their color (based either on sentiment or what % of yearly volume the current month has).
This is the first (and free) version of the indicator, and I'm planning to create a "PRO" version of this indicator in future.
Parameters:
- Timezone
- Cell data -> which data to display in the cells (no data, volume or percentage)
- Highlight min and max volume -> if checked, cells with min and max volume (either monthly or yearly) will be highlighted with a dot or letter (depending on the "Cell data" input)
- Cell stats mode -> which data to use for color and % calculation (All data = yearly, Column = monthly)
- Display data from previous year -> if checked, the data from previous year will be used
- Header color is calculated from -> either sentiment or % of the yearly volume
- Reverse theme -> the table colors are automatically changed based on the "Dark mode" of Tradingview, this checkbox reverses the logic (so that darker colors will be used when "Dark mode" is off, and lighter colors when it's on)
- Hide logo -> hides the cat logo (PLEASE DO NOT HIDE THE CAT)
Conclusion:
Let me know what you think of the indicator. As I said, I'm planning to make a PRO version with more features, for which I already have some ideas, but if you have any suggestions, please let me know.
Trade Manager 2Hi Traders,
this manager will make it easier for you to enter lots into your trading platform. Just go to the indicator settings, set your trading account amount, RRR, % risk and then give ok. If you then know where you want to put the stop loss then reopen, enter the value and hit ok again. The chart will show you exactly the stop loss and take profit as you wanted. The stop loss will always stay where you enter it and the take profit will move with the lot size as the price goes further or closer to the stop loss.
This should help when entering the number of lots, TP, SL into the platform.

Up/Down Volume with Normal DistributionThis indicator analyzes the relationship between price movements and trading volume by distinguishing between "up" and "down" volume. Up volume refers to trading volume occurring during price increases, while down volume refers to trading volume during price decreases. The indicator calculates the mean and standard deviation for both up and down volume over a specified length. This statistical approach enables traders to visualize volume deviations from the average, highlighting potential market anomalies that could signal trading opportunities.
Relationship Between Price and Volume
Volume is a critical metric in technical analysis, often considered a leading indicator of price movements. According to studies in financial economics, significant price changes accompanied by high volume tend to indicate strong market conviction (Wyart et al., 2008). Conversely, price changes on low volume may suggest a lack of interest or conviction, making those moves less reliable.
The relationship between price and volume can be summarized as follows:
Confirmation of Trends: High volume accompanying a price increase often confirms an upward trend. Similarly, high volume during price declines indicates bearish sentiment.
Reversals and Exhaustion: Decreases in volume during price increases may suggest a potential reversal or exhaustion of buying pressure, while increased volume during declines can indicate capitulation.
Breakouts: Price movements that break through significant resistance or support levels accompanied by high volume are typically more significant and suggest stronger follow-through in the new direction.
Developing a Trading Strategy
Traders can leverage the insights gained from this relationship to formulate a trading strategy based on volume analysis:
Entry Signals: Traders can enter long positions when the up volume significantly exceeds the mean by a predefined number of standard deviations. This situation indicates strong buying interest. Conversely, short positions can be initiated when down volume exceeds the mean by a specified standard deviation.
Exit Signals: Exiting positions can be based on changes in volume patterns. If the volume starts to decrease significantly after a price increase, this may signal a potential reversal or the need to lock in profits.
Risk Management: Integrating volume analysis with other technical indicators, such as moving averages or RSI, can provide a more comprehensive risk management framework, enhancing the overall effectiveness of the strategy.
In conclusion, understanding the relationship between price and volume, alongside employing statistical measures like the mean and standard deviation, enables traders to create more robust trading strategies that capitalize on market movements.
References
Wyart, M., Bouchaud, J.-P., & Dacorogna, M. (2008). "Self-organized volatility in a complicated market." European Physical Journal B, 61(2), 195-203. doi:10.1140

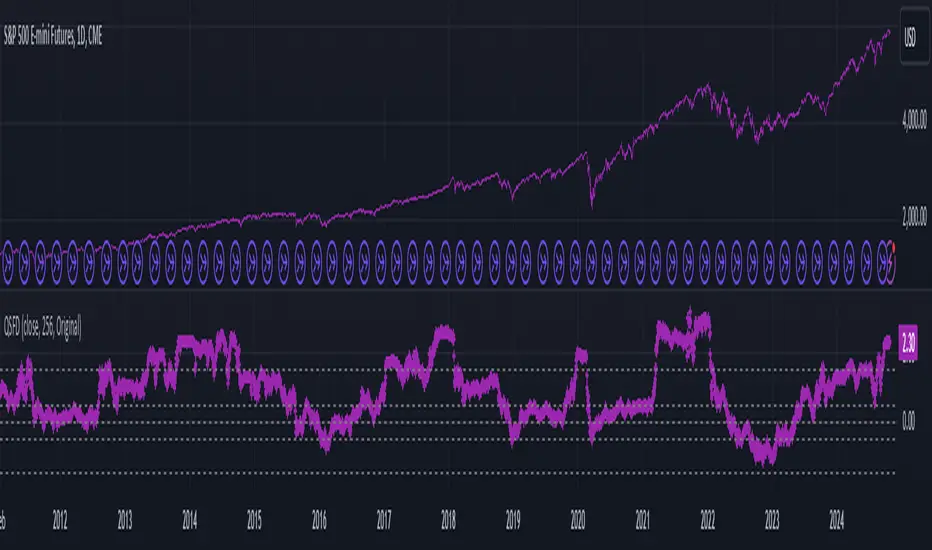
Quick scan for drift🙏🏻
ML based algorading is all about detecting any kind of non-randomness & exploiting it, kinda speculative stuff, not my way, but still...
Drift is one of the patterns that can be exploited, because pure random walks & noise aint got no drift.
This is an efficient method to quickly scan tons of timeseries on the go & detect the ones with drift by simply checking wherther drift < -0.5 or drift > 0.5. The code can be further optimized both in general and for specific needs, but I left it like dat for clarity so you can understand how it works in a minute not in an hour
^^ proving 0.5 and -0.5 are natural limits with no need to optimize anything, we simply put the metric on random noise and see it sits in between -0.5 and 0.5
You can simply take this one and never check anything again if you require numerous live scans on the go. The metric is purely geometrical, no connection to stats, TSA, DSA or whatever. I've tested numerous formulas involving other scaling techniques, drift estimates etc (even made a recursive algo that had a great potential to be written about in a paper, but not this time I gues lol), this one has the highest info gain aka info content.
The timeseries filtered by this lil metric can be further analyzed & modelled with more sophisticated tools.
Live Long and Prosper
P.S.: there's no such thing as polynomial trend/drift, it's alwasy linear, these curves you see are just really long cycles
P.S.: does cheer still work on TV? @admin
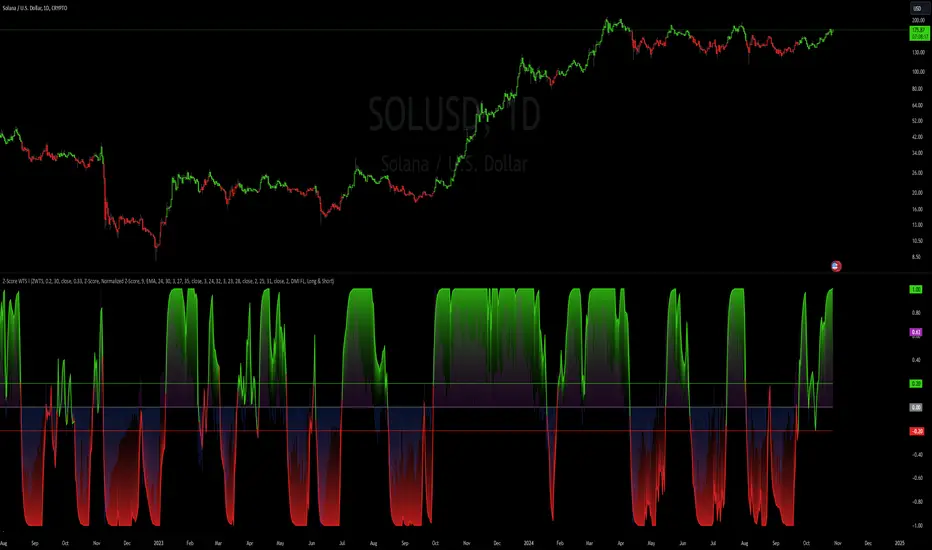
Z-Score Weighted Trend System I [InvestorUnknown]The Z-Score Weighted Trend System I is an advanced and experimental trading indicator designed to utilize a combination of slow and fast indicators for a comprehensive analysis of market trends. The system is designed to identify stable trends using slower indicators while capturing rapid market shifts through dynamically weighted fast indicators. The core of this indicator is the dynamic weighting mechanism that utilizes the Z-score of price , allowing the system to respond effectively to significant market movements.
Dynamic Z-Score-Based Weighting System
The Z-Score Weighted Trend System I utilizes the Z-score of price to assign weights dynamically to fast indicators. This mechanism is designed to capture rapid market shifts at potential turning points, providing timely entry and exit signals.
Traders can choose from two primary weighting mechanisms:
Threshold-Based Weighting: The fast indicators are given weight only when the absolute Z-score exceeds a user-defined threshold. Below this threshold, fast indicators have no impact on the final signal.
Continuous Weighting: By setting the threshold to zero, fast indicators always contribute to the final signal, regardless of Z-score levels. However, this increases the likelihood of false signals during ranging or low-volatility markets
// Calculate weight for Fast Indicators based on Z-Score (Slow Indicator weight is kept to 1 for simplicity)
f_zscore_weights(series float z, simple float weight_thre) =>
float fast_weight = na
float slow_weight = na
if weight_thre > 0
if math.abs(z) <= weight_thre
fast_weight := 0
slow_weight := 1
else
fast_weight := 0 + math.sqrt(math.abs(z))
slow_weight := 1
else
fast_weight := 0 + math.sqrt(math.abs(z))
slow_weight := 1
Choice of Z-Score Normalization
Traders have the flexibility to select different Z-score processing methods to better suit their trading preferences:
Raw Z-Score or Moving Average: Traders can opt for either the raw Z-score or a moving average of the Z-score to smooth out fluctuations.
Normalized Z-Score (ranging from -1 to 1) or Z-Score Percentile: The normalized Z-score is simply the raw Z-score divided by 3, while the Z-score percentile utilizes a normal distribution for transformation.
f_zscore_perc(series float zscore_src, simple int zscore_len, simple string zscore_a, simple string zscore_b, simple string ma_type, simple int ma_len) =>
z = (zscore_src - ta.sma(zscore_src, zscore_len)) / ta.stdev(zscore_src, zscore_len)
zscore = switch zscore_a
"Z-Score" => z
"Z-Score MA" => ma_type == "EMA" ? (ta.ema(z, ma_len)) : (ta.sma(z, ma_len))
output = switch zscore_b
"Normalized Z-Score" => (zscore / 3) > 1 ? 1 : (zscore / 3) < -1 ? -1 : (zscore / 3)
"Z-Score Percentile" => (f_percentileFromZScore(zscore) - 0.5) * 2
output
Slow and Fast Indicators
The indicator uses a combination of slow and fast indicators:
Slow Indicators (constant weight) for stable trend identification: DMI (Directional Movement Index), CCI (Commodity Channel Index), Aroon
Fast Indicators (dynamic weight) to identify rapid trend shifts: ZLEMA (Zero-Lag Exponential Moving Average), IIRF (Infinite Impulse Response Filter)
Each indicator is calculated using for-loop methods to provide a smoothed and averaged view of price data over varying lengths, ensuring stability for slow indicators and responsiveness for fast indicators.
Signal Calculation
The final trading signal is determined by a weighted combination of both slow and fast indicators. The slow indicators provide a stable view of the trend, while the fast indicators offer agile responses to rapid market movements. The signal calculation takes into account the dynamic weighting of fast indicators based on the Z-score:
// Calculate Signal (as weighted average)
float sig = math.round(((DMI*slow_w) + (CCI*slow_w) + (Aroon*slow_w) + (ZLEMA*fast_w) + (IIRF*fast_w)) / (3*slow_w + 2*fast_w), 2)
Backtest Mode and Performance Metrics
The indicator features a detailed backtesting mode, allowing traders to compare the effectiveness of their selected settings against a traditional Buy & Hold strategy. The backtesting provides:
Equity calculation based on signals generated by the indicator.
Performance metrics comparing Buy & Hold metrics with the system’s signals, including: Mean, positive, and negative return percentages, Standard deviations, Sharpe, Sortino, and Omega Ratios
// Calculate Performance Metrics
f_PerformanceMetrics(series float base, int Lookback, simple float startDate, bool Annualize = true) =>
// Initialize variables for positive and negative returns
pos_sum = 0.0
neg_sum = 0.0
pos_count = 0
neg_count = 0
returns_sum = 0.0
returns_squared_sum = 0.0
pos_returns_squared_sum = 0.0
neg_returns_squared_sum = 0.0
// Loop through the past 'Lookback' bars to calculate sums and counts
if (time >= startDate)
for i = 0 to Lookback - 1
r = (base - base ) / base
returns_sum += r
returns_squared_sum += r * r
if r > 0
pos_sum += r
pos_count += 1
pos_returns_squared_sum += r * r
if r < 0
neg_sum += r
neg_count += 1
neg_returns_squared_sum += r * r
float export_array = array.new_float(12)
// Calculate means
mean_all = math.round((returns_sum / Lookback), 4)
mean_pos = math.round((pos_count != 0 ? pos_sum / pos_count : na), 4)
mean_neg = math.round((neg_count != 0 ? neg_sum / neg_count : na), 4)
// Calculate standard deviations
stddev_all = math.round((math.sqrt((returns_squared_sum - (returns_sum * returns_sum) / Lookback) / Lookback)) * 100, 2)
stddev_pos = math.round((pos_count != 0 ? math.sqrt((pos_returns_squared_sum - (pos_sum * pos_sum) / pos_count) / pos_count) : na) * 100, 2)
stddev_neg = math.round((neg_count != 0 ? math.sqrt((neg_returns_squared_sum - (neg_sum * neg_sum) / neg_count) / neg_count) : na) * 100, 2)
// Calculate probabilities
prob_pos = math.round((pos_count / Lookback) * 100, 2)
prob_neg = math.round((neg_count / Lookback) * 100, 2)
prob_neu = math.round(((Lookback - pos_count - neg_count) / Lookback) * 100, 2)
// Calculate ratios
sharpe_ratio = math.round((mean_all / stddev_all * (Annualize ? math.sqrt(Lookback) : 1))* 100, 2)
sortino_ratio = math.round((mean_all / stddev_neg * (Annualize ? math.sqrt(Lookback) : 1))* 100, 2)
omega_ratio = math.round(pos_sum / math.abs(neg_sum), 2)
// Set values in the array
array.set(export_array, 0, mean_all), array.set(export_array, 1, mean_pos), array.set(export_array, 2, mean_neg),
array.set(export_array, 3, stddev_all), array.set(export_array, 4, stddev_pos), array.set(export_array, 5, stddev_neg),
array.set(export_array, 6, prob_pos), array.set(export_array, 7, prob_neu), array.set(export_array, 8, prob_neg),
array.set(export_array, 9, sharpe_ratio), array.set(export_array, 10, sortino_ratio), array.set(export_array, 11, omega_ratio)
// Export the array
export_array
//}
Calibration Mode
A Calibration Mode is included for traders to focus on individual indicators, helping them fine-tune their settings without the influence of other components. In Calibration Mode, the user can visualize each indicator separately, making it easier to adjust parameters.
Alerts
The indicator includes alerts for long and short signals when the indicator changes direction, allowing traders to set automated notifications for key market events.
// Alert Conditions
alertcondition(long_alert, "LONG (Z-Score Weighted Trend System)", "Z-Score Weighted Trend System flipped ⬆LONG⬆")
alertcondition(short_alert, "SHORT (Z-Score Weighted Trend System)", "Z-Score Weighted Trend System flipped ⬇Short⬇")
Important Note:
The default settings of this indicator are not optimized for any particular market condition. They are generic starting points for experimentation. Traders are encouraged to use the calibration tools and backtesting features to adjust the system to their specific trading needs.
The results generated from the backtest are purely historical and are not indicative of future results. Market conditions can change, and the performance of this system may differ under different circumstances. Traders and investors should exercise caution and conduct their own research before using this indicator for any trading decisions.
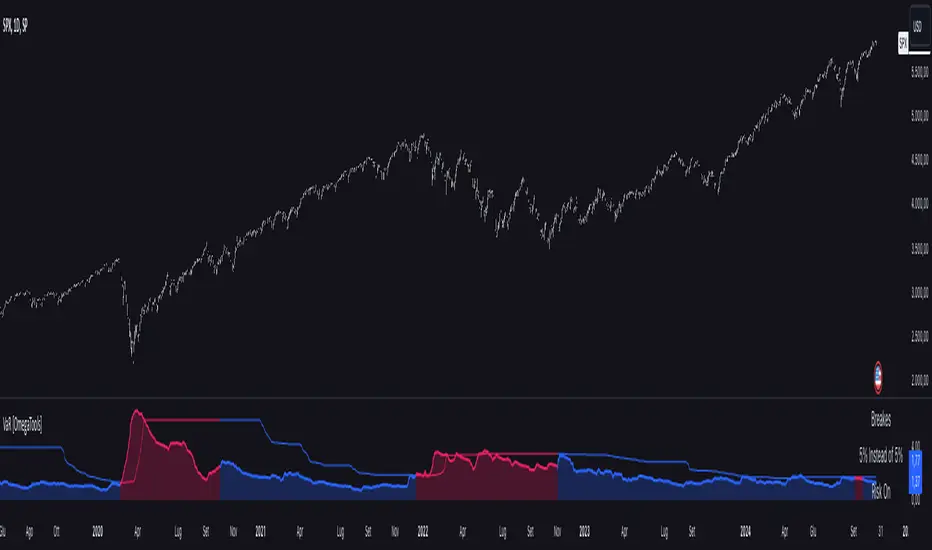
Value at Risk [OmegaTools]The "Value at Risk" (VaR) indicator is a powerful financial risk management tool that helps traders estimate the potential losses in a portfolio over a specified period of time, given a certain level of confidence. VaR is widely used by financial institutions, traders, and risk managers to assess the probability of portfolio losses in both normal and volatile market conditions. This TradingView script implements a comprehensive VaR calculation using several models, allowing users to visualize different risk scenarios and adjust their trading strategies accordingly.
Concept of Value at Risk
Value at Risk (VaR) is a statistical technique used to measure the likelihood of losses in a portfolio or financial asset due to market risks. In essence, it answers the question: "What is the maximum potential loss that could occur in a given portfolio over a specific time horizon, with a certain confidence level?" For instance, if a portfolio has a one-day 95% VaR of $10,000, it means that there is a 95% chance the portfolio will not lose more than $10,000 in a single day. Conversely, there is a 5% chance of losing more than $10,000. VaR is a key risk management tool for portfolio managers and traders because it quantifies potential losses in monetary terms, allowing for better-informed decision-making.
There are several ways to calculate VaR, and this indicator script incorporates three of the most commonly used models:
Historical VaR: This approach uses historical returns to estimate potential losses. It is based purely on past price data, assuming that the past distribution of returns is indicative of future risks.
Variance-Covariance VaR: This model assumes that asset returns follow a normal distribution and that the risk can be summarized using the mean and standard deviation of past returns. It is a parametric method that is widely used in financial risk management.
Exponentially Weighted Moving Average (EWMA) VaR: In this model, recent data points are given more weight than older data. This dynamic approach allows the VaR estimation to react more quickly to changes in market volatility, which is particularly useful during periods of market stress. This model uses the Exponential Weighted Moving Average Volatility Model.
How the Script Works
The script starts by offering users a set of customizable input settings. The first input allows the user to choose between two main calculation modes: "All" or "OCT" (Only Current Timeframe). In the "All" mode, the script calculates VaR using all available methodologies—Historical, Variance-Covariance, and EWMA—providing a comprehensive risk overview. The "OCT" mode narrows the calculation to the current timeframe, which can be particularly useful for intraday traders who need a more focused view of risk.
The next input is the lookback window, which defines the number of historical periods used to calculate VaR. Commonly used lookback periods include 21 days (approximately one month), 63 days (about three months), and 252 days (roughly one year), with the script supporting up to 504 days for more extended historical analysis. A longer lookback period provides a more comprehensive picture of risk but may be less responsive to recent market conditions.
The confidence level is another important setting in the script. This represents the probability that the loss will not exceed the VaR estimate. Standard confidence levels are 90%, 95%, and 99%. A higher confidence level results in a more conservative risk estimate, meaning that the calculated VaR will reflect a more extreme loss scenario.
In addition to these core settings, the script allows users to customize the visual appearance of the indicator. For example, traders can choose different colors for "Bullish" (Risk On), "Bearish" (Risk Off), and "Neutral" phases, as well as colors for highlighting "Breaks" in the data, where returns exceed the calculated VaR. These visual cues make it easy to identify periods of heightened risk at a glance.
The actual VaR calculation is broken down into several models, starting with the Historical VaR calculation. This is done by computing the logarithmic returns of the asset's closing prices and then using linear interpolation to determine the percentile corresponding to the desired confidence level. This percentile represents the potential loss in the asset over the lookback period.
Next, the script calculates Variance-Covariance VaR using the mean and standard deviation of the historical returns. The standard deviation is multiplied by a z-score corresponding to the chosen confidence level (e.g., 1.645 for 95% confidence), and the resulting value is subtracted from the mean return to arrive at the VaR estimate.
The EWMA VaR model uses the EWMA for the sigma parameter, the standard deviation, obtaining a specific dynamic in the volatility. It is particularly useful in volatile markets where recent price behavior is more indicative of future risk than older data.
For traders interested in intraday risk management, the script provides several methods to adjust VaR calculations for lower timeframes. By using intraday returns and scaling them according to the chosen timeframe, the script provides a dynamic view of risk throughout the trading day. This is especially important for short-term traders who need to manage their exposure during high-volatility periods within the same day. The script also incorporates an EWMA model for intraday data, which gives greater weight to the most recent intraday price movements.
In addition to calculating VaR, the script also attempts to detect periods where the asset's returns exceed the estimated VaR threshold, referred to as "Breaks." When the returns breach the VaR limit, the script highlights these instances on the chart, allowing traders to quickly identify periods of extreme risk. The script also calculates the average of these breaks and displays it for comparison, helping traders understand how frequently these high-risk periods occur.
The script further visualizes the risk scenario using a risk phase classification system. Depending on the level of risk, the script categorizes the market as either "Risk On," "Risk Off," or "Risk Neutral." In "Risk On" mode, the market is considered bullish, and the indicator displays a green background. In "Risk Off" mode, the market is bearish, and the background turns red. If the market is neither strongly bullish nor bearish, the background turns neutral, signaling a balanced risk environment.
Traders can customize whether they want to see this risk phase background, along with toggling the display of the various VaR models, the intraday methods, and the break signals. This flexibility allows traders to tailor the indicator to their specific needs, whether they are day traders looking for quick intraday insights or longer-term investors focused on historical risk analysis.
The "Risk On" and "Risk Off" phases calculated by this Value at Risk (VaR) script introduce a novel approach to market risk assessment, offering traders an advanced toolset to gauge market sentiment and potential risk levels dynamically. These risk phases are built on a combination of traditional VaR methodologies and proprietary logic to create a more responsive and intuitive way to manage exposure in both normal and volatile market conditions. This method of classifying market conditions into "Risk On," "Risk Off," or "Risk Neutral" is not something that has been traditionally associated with VaR, making it a groundbreaking addition to this indicator.
How the "Risk On" and "Risk Off" Phases Are Calculated
In typical VaR implementations, the focus is on calculating the potential losses at a given confidence level without providing an overall market outlook. This script, however, introduces a unique risk classification system that takes the output of various VaR models and translates it into actionable signals for traders, marking whether the market is in a Risk On, Risk Off, or Risk Neutral phase.
The Risk On and Risk Off phases are primarily determined by comparing the current returns of the asset to the average VaR calculated across several different methods, including Historical VaR, Variance-Covariance VaR, and EWMA VaR. Here's how the process works:
1. Threshold Setting and Effect Calculation: The script first computes the average VaR using the selected models. It then checks whether the current returns (expressed as a negative value to signify loss) exceed the average VaR value. If the current returns surpass the calculated VaR threshold, this indicates that the actual market risk is higher than expected, signaling a potential shift in market conditions.
2. Break Analysis: In addition to monitoring whether returns exceed the average VaR, the script counts the number of instances within the lookback period where this breach occurs. This is referred to as the "break effect." For each period in the lookback window, the script checks whether the returns surpass the calculated VaR threshold and increments a counter. The percentage of periods where this breach occurs is then calculated as the "effect" or break percentage.
3. Dual Effect Check (if "Double" Risk Scenario is selected): When the user chooses the "Double" risk scenario mode, the script performs two layers of analysis. First, it calculates the effect of returns exceeding the VaR threshold for the current timeframe. Then, it calculates the effect for the lower intraday timeframe as well. Both effects are compared to the user-defined confidence level (e.g., 95%). If both effects exceed the confidence level, the market is deemed to be in a high-risk situation, thus triggering a Risk Off phase. If both effects fall below the confidence level, the market is classified as Risk On.
4. Risk Phases Determination: The final risk phase is determined by analyzing these effects in relation to the confidence level:
- Risk On: If the calculated effect of breaks is lower than the confidence level (e.g., fewer than 5% of periods show returns exceeding the VaR threshold for a 95% confidence level), the market is considered to be in a relatively safe state, and the script signals a "Risk On" phase. This is indicative of bullish conditions where the potential for extreme loss is minimal.
- Risk Off: If the break effect exceeds the confidence level (e.g., more than 5% of periods show returns breaching the VaR threshold), the market is deemed to be in a high-risk state, and the script signals a "Risk Off" phase. This indicates bearish market conditions where the likelihood of significant losses is higher.
- Risk Neutral: If the break effect hovers near the confidence level or if there is no clear trend indicating a shift toward either extreme, the market is classified as "Risk Neutral." In this phase, neither bulls nor bears are dominant, and traders should remain cautious.
The phase color that the script uses helps visualize these risk phases. The background will turn green in Risk On conditions, red in Risk Off conditions, and gray in Risk Neutral phases, providing immediate visual feedback on market risk. In addition to this, when the "Double" risk scenario is selected, the background will only turn green or red if both the current and intraday timeframes confirm the respective risk phase. This double-checking process ensures that traders are only given a strong signal when both longer-term and short-term risks align, reducing the likelihood of false signals.
A New Way of Using Value at Risk
This innovative Risk On/Risk Off classification, based on the interaction between VaR thresholds and market returns, represents a significant departure from the traditional use of Value at Risk as a pure risk measurement tool. Typically, VaR is employed as a backward-looking measure of risk, providing a static estimate of potential losses over a given timeframe with no immediate actionable feedback on current market conditions. This script, however, dynamically interprets VaR results to create a forward-looking, real-time signal that informs traders whether they are operating in a favorable (Risk On) or unfavorable (Risk Off) environment.
By incorporating the "break effect" analysis and allowing users to view the VaR breaches as a percentage of past occurrences, the script adds a predictive element that can be used to time market entries and exits more effectively. This **dual-layer risk analysis**, particularly when using the "Double" scenario mode, adds further granularity by considering both current timeframe and intraday risks. Traders can therefore make more informed decisions not just based on historical risk data, but on how the market is behaving in real-time relative to those risk benchmarks.
This approach transforms the VaR indicator from a risk monitoring tool into a decision-making system that helps identify favorable trading opportunities while alerting users to potential market downturns. It provides a more holistic view of market conditions by combining both statistical risk measurement and intuitive phase-based market analysis. This level of integration between VaR methodologies and real-time signal generation has not been widely seen in the world of trading indicators, marking this script as a cutting-edge tool for risk management and market sentiment analysis.
I would like to express my sincere gratitude to @skewedzeta for his invaluable contribution to the final script. From generating fresh ideas to applying his expertise in reviewing the formula, his support has been instrumental in refining the outcome.
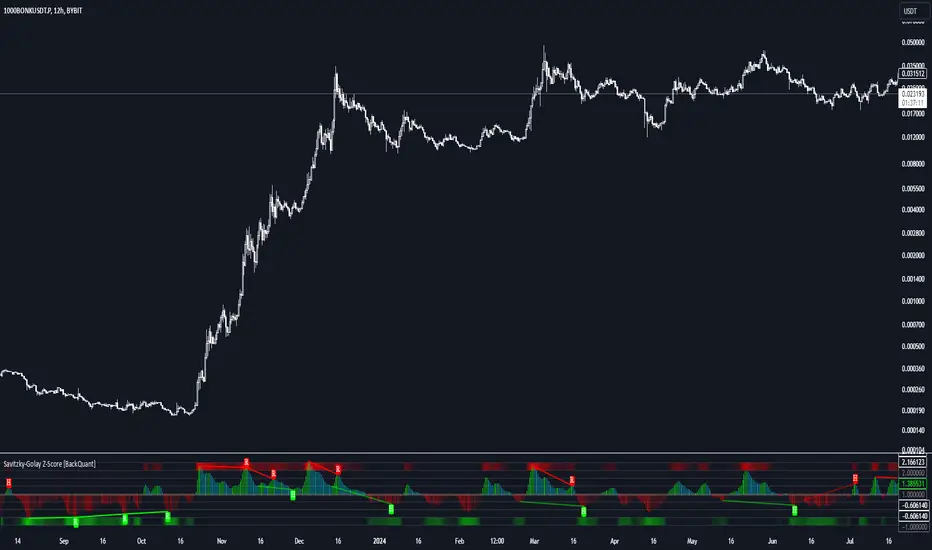
Savitzky-Golay Z-Score [BackQuant]Savitzky-Golay Z-Score
The Savitzky-Golay Z-Score is a powerful trading indicator that combines the precision of the Savitzky-Golay filter with the statistical strength of the Z-Score. This advanced indicator is designed to detect trend shifts, identify overbought or oversold conditions, and highlight potential divergences in the market, providing traders with a unique edge in detecting momentum changes and trend reversals.
Core Concept: Savitzky-Golay Filter
The Savitzky-Golay filter is a widely-used smoothing technique that preserves important signal features such as peak detection while filtering out noise. In this indicator, the filter is applied to price data (default set to HLC3) to smooth out volatility and produce a cleaner trend line. By specifying the window size and polynomial degree, traders can fine-tune the degree of smoothing to match their preferred trading style or market conditions.
Z-Score: Measuring Deviation
The Z-Score is a statistical measure that indicates how far the current price is from its mean in terms of standard deviations. In trading, the Z-Score can be used to identify extreme price moves that are likely to revert or continue trending. A positive Z-Score means the price is above the mean, while a negative Z-Score indicates the price is below the mean.
This script calculates the Z-Score based on the Savitzky-Golay filtered price, enabling traders to detect moments when the price is diverging from its typical range and may present an opportunity for a trade.
Long and Short Conditions
The Savitzky-Golay Z-Score generates clear long and short signals based on the Z-Score value:
Long Signals : When the Z-Score is positive, indicating the price is above its smoothed mean, a long signal is generated. The color of the bars turns green, signaling upward momentum.
Short Signals : When the Z-Score is negative, indicating the price is below its smoothed mean, a short signal is generated. The bars turn red, signaling downward momentum.
These signals allow traders to follow the prevailing trend with confidence, using statistical backing to avoid false signals from short-term volatility.
Standard Deviation Levels and Extreme Levels
This indicator includes several features to help visualize overbought and oversold conditions:
Standard Deviation Levels: The script plots horizontal lines at +1, +2, -1, and -2 standard deviations. These levels provide a reference for how far the current price is from the mean, allowing traders to quickly identify when the price is moving into extreme territory.
Extreme Levels: Additional extreme levels at +3 and +4 (and their negative counterparts) are plotted to highlight areas where the price is highly likely to revert. These extreme levels provide important insight into market conditions that are far outside the norm, signaling caution or potential reversal zones.
The indicator also adapts the color shading of these extreme zones based on the Z-Score’s strength. For example, the area between +3 and +4 is shaded with a stronger color when the Z-Score approaches these values, giving a visual representation of market pressure.
Divergences: Detecting Hidden and Regular Signals
A key feature of the Savitzky-Golay Z-Score is its ability to detect bullish and bearish divergences, both regular and hidden:
Regular Bullish Divergence: This occurs when the price makes a lower low while the Z-Score forms a higher low. It signals that bearish momentum is weakening, and a bullish reversal could be near.
Hidden Bullish Divergence: This divergence occurs when the price makes a higher low while the Z-Score forms a lower low. It signals that bullish momentum may continue after a temporary pullback.
Regular Bearish Divergence: This occurs when the price makes a higher high while the Z-Score forms a lower high, signaling that bullish momentum is weakening and a bearish reversal may be near.
Hidden Bearish Divergence: This divergence occurs when the price makes a lower high while the Z-Score forms a higher high, indicating that bearish momentum may continue after a temporary rally.
These divergences are plotted directly on the chart, making it easier for traders to spot when the price and momentum are out of sync and when a potential reversal may occur.
Customization and Visualization
The Savitzky-Golay Z-Score offers a range of customization options to fit different trading styles:
Window Size and Polynomial Degree: Adjust the window size and polynomial degree of the Savitzky-Golay filter to control how much smoothing is applied to the price data.
Z-Score Lookback Period: Set the lookback period for calculating the Z-Score, allowing traders to fine-tune the sensitivity to short-term or long-term price movements.
Display Options: Choose whether to display standard deviation levels, extreme levels, and divergence labels on the chart.
Bar Color: Color the price bars based on trend direction, with green for bullish trends and red for bearish trends, allowing traders to easily visualize the current momentum.
Divergences: Enable or disable divergence detection, and adjust the lookback periods for pivots used to detect regular and hidden divergences.
Alerts and Automation
To ensure you never miss an important signal, the indicator includes built-in alert conditions for the following events:
Positive Z-Score (Long Signal): Triggers an alert when the Z-Score crosses above zero, indicating a potential buying opportunity.
Negative Z-Score (Short Signal): Triggers an alert when the Z-Score crosses below zero, signaling a potential short opportunity.
Shifting Momentum: Alerts when the Z-Score is shifting up or down, providing early warning of changing market conditions.
These alerts can be configured to notify you via email, SMS, or app notification, allowing you to stay on top of the market without having to constantly monitor the chart.
Trading Applications
The Savitzky-Golay Z-Score is a versatile tool that can be applied across multiple trading strategies:
Trend Following: By smoothing the price and calculating the Z-Score, this indicator helps traders follow the prevailing trend while avoiding false signals from short-term volatility.
Mean Reversion: The Z-Score highlights moments when the price is far from its mean, helping traders identify overbought or oversold conditions and capitalize on potential reversals.
Divergence Trading: Regular and hidden divergences between the Z-Score and price provide early warning of trend reversals, allowing traders to enter trades at opportune moments.
Final Thoughts
The Savitzky-Golay Z-Score is an advanced statistical tool designed to provide a clearer view of market trends and momentum. By applying the Savitzky-Golay filter and Z-Score analysis, this indicator reduces noise and highlights key areas where the market may reverse or accelerate, giving traders a significant edge in understanding price behavior.
Whether you’re a trend follower or a reversal trader, this indicator offers the flexibility and insights you need to navigate complex markets with confidence.
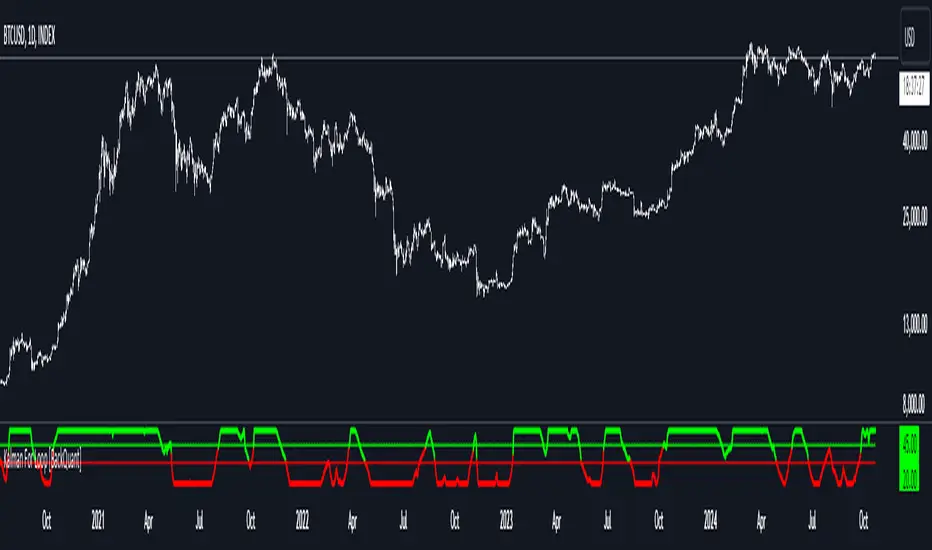
Kalman For Loop [BackQuant]Kalman For Loop
Introducing BackQuant's Kalman For Loop (Kalman FL) — a highly adaptive trading indicator that uses a Kalman filter to smooth price data and generate actionable long and short signals. This advanced indicator is designed to help traders identify trends, filter out market noise, and optimize their entry and exit points with precision. Let’s explore how this indicator works, its key features, and how it can enhance your trading strategies.
Core Concept: Kalman Filter
The Kalman Filter is a mathematical algorithm used to estimate the state of a system by filtering noisy data. It is widely used in areas such as control systems, signal processing, and time-series analysis. In the context of trading, a Kalman filter can be applied to price data to smooth out short-term fluctuations, providing a clearer view of the underlying trend.
Unlike moving averages, which use fixed weights to smooth data, the Kalman Filter adjusts its estimate dynamically based on the relationship between the process noise and the measurement noise. This makes the filter more adaptive to changing market conditions, providing more accurate trend detection without the lag associated with traditional smoothing techniques.
Please see the original Kalman Price Filter
In this script, the Kalman For Loop applies the Kalman filter to the price source (default set to the closing price) to generate a smoothed price series, which is then used to calculate signals.
Adaptive Smoothing with Process and Measurement Noise
Two key parameters govern the behavior of the Kalman filter:
Process Noise: This controls the extent to which the model allows for uncertainty in price changes. A lower process noise value will make the filter smoother but slower to react to price changes, while a higher value makes it more sensitive to recent price fluctuations.
Measurement Noise: This represents the uncertainty or "noise" in the observed price data. A higher measurement noise value gives the filter more leeway to ignore short-term fluctuations, focusing on the broader trend. Lowering the measurement noise makes the filter more responsive to minor changes in price.
These settings allow traders to fine-tune the Kalman filter’s sensitivity, adjusting it to match their preferred trading style or market conditions.
For-Loop Scoring Mechanism
The Kalman FL further enhances the effectiveness of the Kalman filter by using a for-loop scoring system. This mechanism evaluates the smoothed price over a range of periods (defined by the Calculation Start and Calculation End inputs), assigning a score based on whether the current filtered price is higher or lower than previous values.
Long Signals: A long signal is generated when the for-loop score surpasses the Long Threshold (default set at 20), indicating a strong upward trend. This helps traders identify potential buying opportunities.
Short Signals: A short signal is triggered when the score crosses below the Short Threshold (default set at -10), signaling a potential downtrend or selling opportunity.
These signals are plotted on the chart, giving traders a clear visual indication of when to enter long or short positions.
Customization and Visualization Options
The Kalman For Loop comes with a range of customization options to give traders full control over how the indicator operates and is displayed on the chart:
Kalman Price Source: Choose the price data used for the Kalman filter (default is the closing price), allowing you to apply the filter to other price points like open, high, or low.
Filter Order: Set the order of the Kalman filter (default is 5), controlling how far back the filter looks in its calculations.
Process and Measurement Noise: Fine-tune the sensitivity of the Kalman filter by adjusting these noise parameters.
Signal Line Width and Colors: Customize the appearance of the signal line and the colors used to indicate long and short conditions.
Threshold Lines: Toggle the display of the long and short threshold lines on the chart for better visual clarity.
The indicator also includes the option to color the candlesticks based on the current trend direction, allowing traders to quickly identify changes in market sentiment. In addition, a background color feature further highlights the overall trend by shading the background in green for long signals and red for short signals.
Trading Applications
The Kalman For Loop is a versatile tool that can be adapted to a variety of trading strategies and markets. Some of the primary use cases include:
Trend Following: The adaptive nature of the Kalman filter helps traders identify the start of new trends with greater precision. The for-loop scoring system quantifies the strength of the trend, making it easier to stay in trades for longer when the trend remains strong.
Mean Reversion: For traders looking to capitalize on short-term reversals, the Kalman filter's ability to smooth price data makes it easier to spot when price has deviated too far from its expected path, potentially signaling a reversal.
Noise Reduction: The Kalman filter excels at filtering out short-term price noise, allowing traders to focus on the broader market movements without being distracted by minor fluctuations.
Risk Management: By providing clear long and short signals based on filtered price data, the Kalman FL helps traders manage risk by entering positions only when the trend is well-defined, reducing the chances of false signals.
Alerts and Automation
To further assist traders, the Kalman For Loop includes built-in alert conditions that notify you when a long or short signal is generated. These alerts can be configured to trigger notifications, helping you stay on top of market movements without constantly monitoring the chart.
Final Thoughts
The Kalman For Loop is a powerful and adaptive trading indicator that combines the precision of the Kalman filter with a for-loop scoring mechanism to generate reliable long and short signals. Whether you’re a trend follower or a reversal trader, this indicator offers the flexibility and accuracy needed to navigate complex markets with confidence.
As always, it’s important to backtest the indicator and adjust the settings to fit your trading style and market conditions. No indicator is perfect, and the Kalman FL should be used alongside other tools and sound risk management practices for the best results.
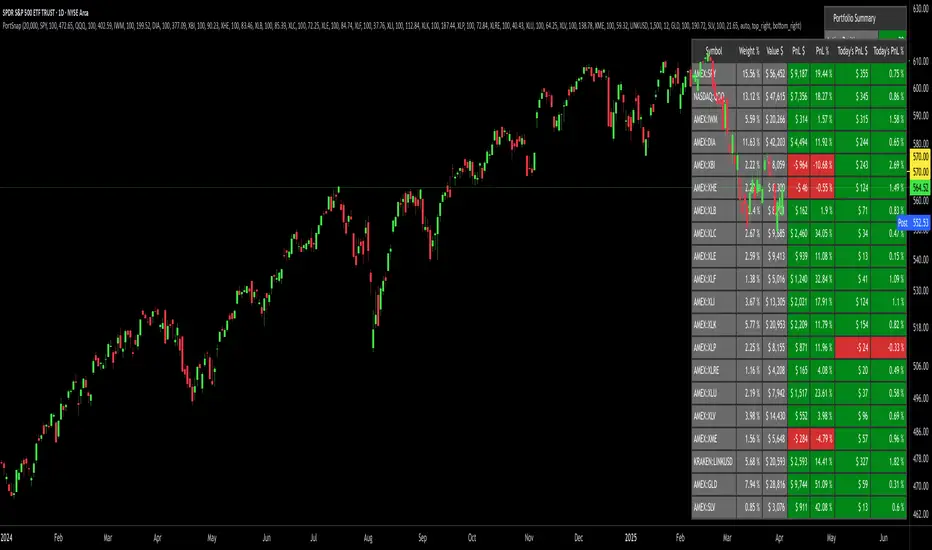
Portfolio SnapShot v0.3Here is a Tradingview Pinescript that I call "Portfolio Snapshot". It is based on two other separate scripts that I combined, modified and simplified - shoutout to RedKTrader (Portfolio Tracker - Table Version) and FriendOfTheTrend (Portfolio Tracker For Stocks & Crypto) for their inspiration and code. I was using both of these scripts, and decided to combine the two and increase the number of stocks to 20. I was looking for an easy way to track my entire portfolio (scattered across 5 accounts) PnL on a total and stock basis. PnL - that's it, very simple by design. The features are:
1) Track PnL across multiple accounts, from inception and current day.
2) PnL is reported in two tables, at the portfolio level and individual stock level
3) Both tables can be turned on/off and placed anywhere on the chart.
4) Input up to 20 assets (stocks, crypto, ETFs)
The user has to manually calculate total shares and average basis for stocks in multiple accounts, and then inputs this in the user input dialog. I update mine as each trade is made, or you can just update once a week or so.
I've pre-loaded it with the major indices and sector ETFs, plus URA, GLD, SLV. 100 shares of each, and prices are based on the close Jan 2 2024. So if you don't want to track your portfolio, you can use it to track other things you find interesting, such as annual performance of each sector.
Memecoin TrackerMemecoin Z-Score Tracker with Buy/Sell Table - Technical Explanation
How it Works:
This indicator calculates the Z-scores of various memecoins based on their price movements, using historical funding rates across multiple exchanges. A Z-score measures the deviation of the current price from its moving average, expressed in standard deviations. This provides insight into whether a coin is overbought (positive Z-score) or oversold (negative Z-score) relative to its recent history.
Key Components:
- Z-Score Calculation
- The lookback period is dynamically adjusted based on the chart’s timeframe to ensure consistency across different time intervals:
- For lower timeframes (e.g., minutes), the base lookback period is scaled to match approximately 240 minutes.
- For daily and higher timeframes, the base lookback period is fixed (e.g., 14 bars).
Memecoin Selection:
The indicator tracks several popular memecoins, including DOGE, SHIB, PEPE, FLOKI, and others.
Funding rates are fetched from exchanges like Binance, Bybit, and MEXC using the request.security() function, ensuring accurate real-time price data.
Thresholds for Buy/Sell Signals:
Users can set custom Z-score thresholds for buy (oversold) and sell (overbought) signals:
Default upper threshold: 2.5 (indicates overbought condition).
Default lower threshold: -2.5 (indicates oversold condition).
When a memecoin’s Z-score crosses above or below these thresholds, it signals potential buy or sell conditions.
Buy/Sell Table:
A table with two columns (BUY and SELL) is dynamically populated with memecoins that are currently oversold (buy signal) or overbought (sell signal).
Each column can hold up to 20 entries, providing a clear overview of current market opportunities.
Visual Feedback:
The Z-scores of each memecoin are plotted as a line on the chart, with color-coded feedback:
Red for overbought (Z-score > upper threshold),
Green for oversold (Z-score < lower threshold),
Other colors indicate neutral conditions.
Horizontal lines representing the upper and lower thresholds are plotted for reference.
How to Use It:
Adjust Thresholds:
You can modify the upper and lower Z-score thresholds in the settings to customize sensitivity. Lower thresholds will increase the likelihood of triggering buy/sell signals for smaller price deviations, while higher thresholds will focus on more extreme conditions.
View Real-Time Signals:
The table shows which memecoins are currently oversold (buy column) or overbought (sell column), updating dynamically as price data changes. Traders can monitor this table to identify trading opportunities quickly.
Use with Different Timeframes:
The Z-score lookback period adjusts automatically based on the chart's timeframe, making this indicator suitable for intraday and long-term traders.
Use shorter timeframes (e.g., 1-minute, 5-minute charts) for faster signals, while longer timeframes (e.g., daily, weekly) may yield more stable, trend-based signals.
Who It Is For:
Short-Term Traders: Those looking to capitalize on short-term price imbalances (e.g., day traders, scalpers) can use this indicator to identify quick buy/sell opportunities as memecoins oscillate around their moving averages.
Swing Traders: Swing traders can use the Z-score tracker to identify overbought or oversold conditions across multiple memecoins and ride the reversals back toward equilibrium.
Crypto Enthusiasts and Memecoin Investors: Anyone involved in the volatile memecoin market can use this tool to better time entries and exits based on market extremes.
This indicator is for traders seeking quantitative analysis of price extremes in memecoins. By tracking the Z-scores across multiple coins and dynamically updating buy/sell opportunities in a table, it provides a systematic approach to identifying trade setups.

Ehlers Loops [BigBeluga]The Ehlers Loops indicator is based on the concepts developed by John F. Ehlers, which provide a visual representation of the relationship between price and volume dynamics. This tool helps traders predict future market movements by observing how price and volume data interact within four distinct quadrants of the loop, each representing different combinations of price and volume directions. The unique structure of this indicator provides insights into the strength and direction of market trends, offering a clearer perspective on price behavior relative to volume.
🔵 KEY FEATURES & USAGE
● Four Price-Volume Quadrants:
The Ehlers Loops chart consists of four quadrants:
+Price & +Volume (top-right) – Typically indicates a bullish continuation in the market.
-Price & +Volume (bottom-right) – Generally shows a bearish continuation.
+Price & -Volume (top-left) – Typically indicates an exhaustion of demand with a potential reversal.
-Price & -Volume (bottom-left) – Indicates exhaustion of supply and near trend reversal.
By watching how symbols move through these quadrants over time, traders can assess shifts in momentum and volume flow.
● Price and Volume Scaling in Standard Deviations:
Both price and volume data are individually filtered using HighPass and SuperSmoother filters, which transform them into band-limited signals with zero mean. This scaling allows traders to view data in terms of its deviation from the average, making it easier to spot abnormal movements or trends in both price and volume.
● Loops Trajectories with Tails:
The loops draw a trail of price and volume dynamics over time, allowing traders to observe historical price-volume interactions and predict future movements based on the curvature and direction of the rotation.
● Price & Volume Histograms:
On the right side of the chart, histograms for each symbol provide a summary of the most recent price and volume values. These histograms allow traders to easily compare the strength and direction of multiple assets and evaluate market conditions at a glance.
● Flexible Symbol Display & Customization:
Traders can select up to five different symbols to be displayed within the Ehlers Loops. The settings also allow customization of symbol size, colors, and visibility of the histograms. Additionally, traders can adjust the LPPeriod and HPPeriod to change the smoothness and lag of the loops, with a shorter LPPeriod offering more responsiveness and a longer HPPeriod emphasizing longer-term trends.
🔵 USAGE
🔵 SETTINGS
Low pass Period: default is 10 to
obtain minimum lag with just a little smoothing.
High pass Period: default is 125 (half of the year if Daily timeframe) to capture the longer term moves.
🔵 CONCLUSION
The Ehlers Loops indicator offers a visually rich and highly customizable way to observe price and volume dynamics across multiple assets. By using band-limited signals and scaling data into standard deviations, traders gain a powerful tool for identifying market trends and predicting future movements. Whether you're tracking short-term fluctuations or long-term trends, Ehlers Loops can help you stay ahead of the market by offering key insights into the relationship between price and volume.

Japan Stock Market Indices Performance TableYou can display the performance of the Nikkei 225 Futures and major indices of the Japanese stock market for the day in a table format on your chart.
The 5-Minute Change Rate shows the change from the opening price of the most recent 5-minute candlestick.
The Daily Change Rate displays the change from the opening price at 09:00 GMT+9 on the current trading day.
Since the Japanese stock market opens at 09:00 GMT+9 , the values for Nikkei 225 Futures, USD/JPY, and EUR/JPY are also calculated based on their opening prices at that time. This script was created because, while brokerage apps allow you to see the comparison to the previous day's close for each index, they do not display the rate of change from the current day's opening price.
Notes:
All values are reset each trading day at 09:00 GMT+9.
If you have not purchased real-time market data from the Tokyo Stock Exchange and Osaka Exchange, data may be delayed by 20 minutes and may not display correctly.
The Tokyo Stock Exchange sector indices are distributed in real-time at 15-second intervals from the TSE, so this script aligns with that timing.
当日の日経225先物と日本株式市場の主要指数のパフォーマンスを表形式でチャート上に表示することができます。
5分変化率は直近の5分足の始値からの変化率、当日変化率は当日09:00の始値からの変化率を表示しています。
日本株式市場が開くのが GMT+9 09:00 のため、それに合わせて日経225先物、ドル円、ユーロ円も GMT+9 09:00 時点の始値を元に各値を算出しています。
各指数の前日比は証券会社のアプリで見れるものの、当日始値からの変化率が見れないため作成しました。
補足
各営業日の朝(GMT+9 09:00)に各値はリセットされます。
Tokyo Stock ExchangeとOsaka Exchangeのreal-time market dataを購入していない場合、データが20分遅れになるため正常に表示されない可能性があります。
東証業種別株価指数は東証から配信されるのが15秒間隔でのリアルタイムになるため、このスクリプトもそれに準ずる形となっています。

RSI Weighted Trend System I [InvestorUnknown]The RSI Weighted Trend System I is an experimental indicator designed to combine both slow-moving trend indicators for stable trend identification and fast-moving indicators to capture potential major turning points in the market. The novelty of this system lies in the dynamic weighting mechanism, where fast indicators receive weight based on the current Relative Strength Index (RSI) value, thus providing a flexible tool for traders seeking to adapt their strategies to varying market conditions.
Dynamic RSI-Based Weighting System
The core of the indicator is the dynamic weighting of fast indicators based on the value of the RSI. In essence, the higher the absolute value of the RSI (whether positive or negative), the higher the weight assigned to the fast indicators. This enables the system to capture rapid price movements around potential turning points.
Users can choose between a threshold-based or continuous weight system:
Threshold-Based Weighting: Fast indicators are activated only when the absolute RSI value exceeds a user-defined threshold. Below this threshold, fast indicators receive no weight.
Continuous Weighting: By setting the weight threshold to zero, the fast indicators always receive some weight, although this can result in more false signals in ranging markets.
// Calculate weight for Fast Indicators based on RSI (Slow Indicator weight is kept to 1 for simplicity)
f_RSI_Weight_System(series float rsi, simple float weight_thre) =>
float fast_weight = na
float slow_weight = na
if weight_thre > 0
if math.abs(rsi) <= weight_thre
fast_weight := 0
slow_weight := 1
else
fast_weight := 0 + math.sqrt(math.abs(rsi))
slow_weight := 1
else
fast_weight := 0 + math.sqrt(math.abs(rsi))
slow_weight := 1
Slow and Fast Indicators
Slow Indicators are designed to identify stable trends, remaining constant in weight. These include:
DMI (Directional Movement Index) For Loop
CCI (Commodity Channel Index) For Loop
Aroon For Loop
Fast Indicators are more responsive and designed to spot rapid trend shifts:
ZLEMA (Zero-Lag Exponential Moving Average) For Loop
IIRF (Infinite Impulse Response Filter) For Loop
Each of these indicators is calculated using a for-loop method to generate a moving average, which captures the trend of a given length range.
RSI Normalization
To facilitate the weighting system, the RSI is normalized from its usual 0-100 range to a -1 to 1 range. This allows for easy scaling when calculating weights and helps the system adjust to rapidly changing market conditions.
// Normalize RSI (1 to -1)
f_RSI(series float rsi_src, simple int rsi_len, simple string rsi_wb, simple string ma_type, simple int ma_len) =>
output = switch rsi_wb
"RAW RSI" => ta.rsi(rsi_src, rsi_len)
"RSI MA" => ma_type == "EMA" ? (ta.ema(ta.rsi(rsi_src, rsi_len), ma_len)) : (ta.sma(ta.rsi(rsi_src, rsi_len), ma_len))
Signal Calculation
The final trading signal is a weighted average of both the slow and fast indicators, depending on the calculated weights from the RSI. This ensures a balanced approach, where slow indicators maintain overall trend guidance, while fast indicators provide timely entries and exits.
// Calculate Signal (as weighted average)
sig = math.round(((DMI*slow_w) + (CCI*slow_w) + (Aroon*slow_w) + (ZLEMA*fast_w) + (IIRF*fast_w)) / (3*slow_w + 2*fast_w), 2)
Backtest Mode and Performance Metrics
This version of the RSI Weighted Trend System includes a comprehensive backtesting mode, allowing users to evaluate the performance of their selected settings against a Buy & Hold strategy. The backtesting includes:
Equity calculation based on the signals generated by the indicator.
Performance metrics table comparing Buy & Hold strategy metrics with the system’s signals, including: Mean, positive, and negative return percentages, Standard deviations (of all, positive and negative returns), Sharpe Ratio, Sortino Ratio, and Omega Ratio
f_PerformanceMetrics(series float base, int Lookback, simple float startDate, bool Annualize = true) =>
// Initialize variables for positive and negative returns
pos_sum = 0.0
neg_sum = 0.0
pos_count = 0
neg_count = 0
returns_sum = 0.0
returns_squared_sum = 0.0
pos_returns_squared_sum = 0.0
neg_returns_squared_sum = 0.0
// Loop through the past 'Lookback' bars to calculate sums and counts
if (time >= startDate)
for i = 0 to Lookback - 1
r = (base - base ) / base
returns_sum += r
returns_squared_sum += r * r
if r > 0
pos_sum += r
pos_count += 1
pos_returns_squared_sum += r * r
if r < 0
neg_sum += r
neg_count += 1
neg_returns_squared_sum += r * r
float export_array = array.new_float(12)
// Calculate means
mean_all = math.round((returns_sum / Lookback) * 100, 2)
mean_pos = math.round((pos_count != 0 ? pos_sum / pos_count : na) * 100, 2)
mean_neg = math.round((neg_count != 0 ? neg_sum / neg_count : na) * 100, 2)
// Calculate standard deviations
stddev_all = math.round((math.sqrt((returns_squared_sum - (returns_sum * returns_sum) / Lookback) / Lookback)) * 100, 2)
stddev_pos = math.round((pos_count != 0 ? math.sqrt((pos_returns_squared_sum - (pos_sum * pos_sum) / pos_count) / pos_count) : na) * 100, 2)
stddev_neg = math.round((neg_count != 0 ? math.sqrt((neg_returns_squared_sum - (neg_sum * neg_sum) / neg_count) / neg_count) : na) * 100, 2)
// Calculate probabilities
prob_pos = math.round((pos_count / Lookback) * 100, 2)
prob_neg = math.round((neg_count / Lookback) * 100, 2)
prob_neu = math.round(((Lookback - pos_count - neg_count) / Lookback) * 100, 2)
// Calculate ratios
sharpe_ratio = math.round(mean_all / stddev_all * (Annualize ? math.sqrt(Lookback) : 1), 2)
sortino_ratio = math.round(mean_all / stddev_neg * (Annualize ? math.sqrt(Lookback) : 1), 2)
omega_ratio = math.round(pos_sum / math.abs(neg_sum), 2)
// Set values in the array
array.set(export_array, 0, mean_all), array.set(export_array, 1, mean_pos), array.set(export_array, 2, mean_neg),
array.set(export_array, 3, stddev_all), array.set(export_array, 4, stddev_pos), array.set(export_array, 5, stddev_neg),
array.set(export_array, 6, prob_pos), array.set(export_array, 7, prob_neu), array.set(export_array, 8, prob_neg),
array.set(export_array, 9, sharpe_ratio), array.set(export_array, 10, sortino_ratio), array.set(export_array, 11, omega_ratio)
// Export the array
export_array
The metrics help traders assess the effectiveness of their strategy over time and can be used to optimize their settings.
Calibration Mode
A calibration mode is included to assist users in tuning the indicator to their specific needs. In this mode, traders can focus on a specific indicator (e.g., DMI, CCI, Aroon, ZLEMA, IIRF, or RSI) and fine-tune it without interference from other signals.
The calibration plot visualizes the chosen indicator's performance against a zero line, making it easy to see how changes in the indicator’s settings affect its trend detection.
Customization and Default Settings
Important Note: The default settings provided are not optimized for any particular market or asset. They serve as a starting point for experimentation. Traders are encouraged to calibrate the system to suit their own trading strategies and preferences.
The indicator allows deep customization, from selecting which indicators to use, adjusting the lengths of each indicator, smoothing parameters, and the RSI weight system.
Alerts
Traders can set alerts for both long and short signals when the indicator flips, allowing for automated monitoring of potential trading opportunities.

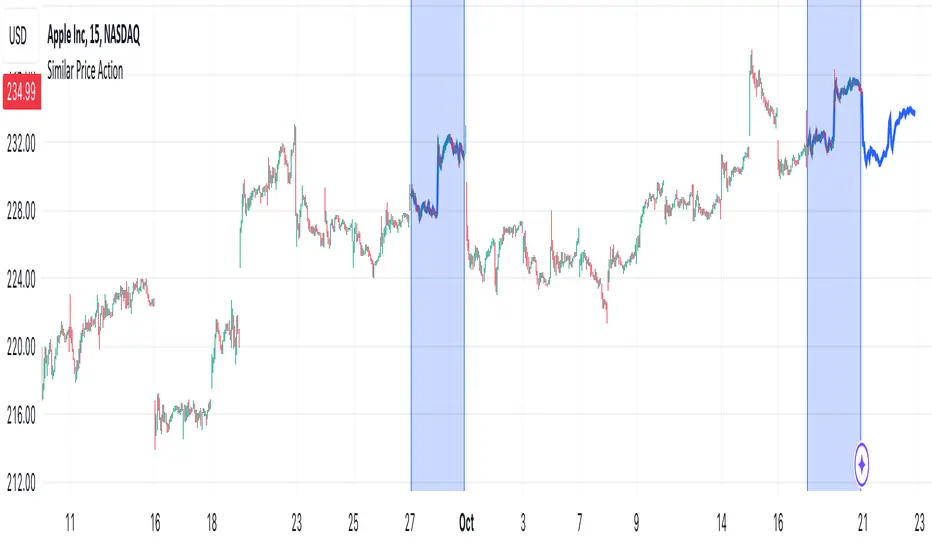
Similar Price ActionDescription:
The indicator tries to find an area of N candles in history that has the most similar price action to the latest N candles. The maximum search distance is limited to 5000 candles. It works by calculating a coefficient for each candle and comparing it with the coefficient of the latest candle, thus searching for two closest values. The indicator highlights the latest N candles, as well as the most similar area found in the past, and also tries to predict future price based on the latest price and price directly after the most similar area that was found in the past.
Inputs:
- Length -> the area we are searching for is comprised of this many candles
- Lookback -> maximum distance in which a similar area can be found
- Function -> the function used to compare latest and past prices
Notes:
- The indicator is intended to work on smaller timeframes where the overall price difference is not very high, but can be used on any
Industry Group Strength - IndiaPresenting the Industry Group Strength Indicator for India market, designed to help traders identify top-performing stocks within specific industry groups that are predefined.
⦿ Identifies Leading Stocks in Industry Groups
⦿ Analyses the following metrics
YTD Return : Measures stock performance from the start of the year.
RS Rating : Relative Strength rating for user-selected periods.
% Return : Percentage return over a user-selected lookback period.
Features
This indicator dynamically recognises the industry group of the current stock on the chart and ranks stocks within that group based on predefined data points. Traders can add this indicator to focus on top-performing stocks relative to their industry.
⦿ Color-coded for Easy Visualisation
You can choose from the following key metrics to rank stocks:
YTD Return
RS Rating
% Return
⦿ Table Format with Performance Metrics Compact mode
Vertical View
Horizontal View
All of the three metrics are shown in the compact mode and the current stock that is viewed is highlighted!
Vertical view
Horizontal view
Stock Ranking
Stocks are ranked based on their performance within industry groups, enabling traders to easily spot leaders and laggards in each sector. Color-coded gradients visually represent the stocks’ performance rankings, with higher percentile rankings indicating better performance.
Relative Strength (RS)
Relative Strength (RS) compares a stock’s performance against the benchmark index. The RS value is normalized from 1 to 99, making it easier to compare across different stocks. A rising RS value indicates that the stock is outperforming the market, helping traders quickly gauge relative performance within industry groups.
Limitations
At the time of developing this indicator, Pine requests are limited to 40 per script so the predefined symbols had to be filtered to 40 per Industry group
Stocks Filters
Filters that are used to filter the stocks in an Industry group to have maximum of 40 stocks
⦿ Auto, Chemical, Engineering, Finance, Pharma
Market Cap >= 1000 Crores and Market Cap <= 60000 Crores
Price >= 30 and Price <= 6000
50 Days Average ( Price * Volume ) >= 6 Crores
⦿ For rest of the Industry groups
Market Cap >= 1000 Crores and Market Cap <= 100000 Crores
Price >= 20 and Price <= 10000
50 Days Average ( Price * Volume ) >= 3 Crores
Credits
This indicator is forked from the Script for US market by @Amphibiantrading Thanks Brandon for the beginning of this indicator.
This indicator is built on TradingView’s new dynamic requests feature, thanks to @PineCoders for making this possible!
