(JS) Triple StochasticSo I ended up adding a ton of stuff to my prior Double Stochastic script which you can see here .
The concept of the Double was to smooth out the existing Stochastic by applying a Stochastic to the existing Stochastic (hence the Double). My concept for the Triple Stochastic is much different. It combines a regular stochastic, stochastic RSI, and the double stochastic to get a smoothed output based on all 3.
Also - since I love being able to see a Squeeze (see my Squeeze Pro indicators - Squeeze Pro 2 & Squeeze Pro Overlays ) I added the Squeeze to the Stochastic (the dots). If you're unfamiliar with how a Squeeze works, or what it is, check out my links for explanation. A quick explanation however is that the Squeeze is an indicator that was invented by John Carter that detects price compression before a big move out of a range. This is done by using Bollinger Bands and Keltner Channels, the BB shrink inside the KC. The color of the dots represent the depth of the BB in the KC, white (or black) being the lightest squeeze, red being the standard squeeze, and yellow being the strongest squeeze. Now on to the indicator:
The first thing you'll notice is the options available for the type of Stochastic you'd like to use:
Standard : This is a regular Stochastic
Stochastic RSI : This is the standard Stochastic RSI
Double : This is the Stochastic on top of a Stochastic from the prior version
Triple : This is simply an average of all 3 of the above combined together
(Top indicator shows the Triple Stochastic)
The options "K", "D", and "Smooth" are the settings from a regular Stochastic used to set up the type of Stochastic you choose to use.
Now let's say you're not sure how one type performs compared to another, or you like the quickest momentum change but also like to see the smoothest trend, or you want to use the same types of Stochastic and watch for them to cross like moving averages - for these reasons I added the ability to add a second Stochastic for comparison.
(2nd indicator shows a fast and slow Triple Stochastic together)
Quite obviously, the "K 2", "D 2", and "Smooth 2" are what is used in order to set the parameters for the second Stochastic.
Now another thing I added was the option to replace the regular Stochastic and instead look at the distance between the K and D. By turning off "Use K% and D%" you get to see this in action. To put it simply, a cross above zero would indicate a positive Stochastic crossover, and a cross below zero would represent the opposite. There's also an option titled "SMA Length using Difference" which, to smooth this out a bit, allows you to apply a moving average to the distance. By setting it at 1 you'd see the actual distance between K and D.
(3rd indicator shows the K and D distance used as a plot)
Another thing I wanted to do was add a different type of background that wasn't based on the indicator itself. I decided to use ADX & DMI which is a great way to determine the trend. When you select "ADX/DMI BG" the BG colors will change from being based on the indicator to being based on ADX and DMI.
(The 3rd indicator also shows the ADX/DMI BG being used).
And now finally the last feature I decided to add takes us back to the Squeeze. Essentially it is just the Stochastic shown through the lens of Squeeze momentum, as I ended up plugging the Stochastic output into the Squeeze momentum formula to create an oscillator. By selecting "Use Oscillator" you will see this in action as well.
(Bottom indicator shows the oscillator addition)
Stocastico RSI (STOCH RSI)

Stochastic With Neutral Zone and Time CycleThis oscillator includes 2 Stochastic oscillators ( Stoch 5 3 2, Stoch 14 7 3). Stoch 5 3 2 is used for market momentum, and Stock 14 7 3 is used for market overall time cycle (orange).
There is also a neutral zone highlighted in yellow from 45 to 55 to indicate whether the market has created a low or it is still in the cycle-high and vice versa.


SRR DifferenceThis takes an RSI Stochastic and a regular RSI and shows the difference between them. Do not use this indicator alone.

Multi-timeframe Dashboard for RSI And Stochastic RSI Dashboard to check multi-timeframe RSI and Stochastic RSI on 4h, 8h, 12h, D and W
Great side tool to assist on the best time to buy and sell and asset.
Shows a green arrow on a good buy moment, and a red when to sell, for all timeframes. In case there are confluence on more than one, you have the info that you need.
Uses a formula with a weight of 5 for RSI and 2 for Stochastic RSI, resulting on a factor used to set up a color for each of the timeframes.
Legend per each timeframe:
- Blue: Excellent buy, RSI and Stoch RSI are low
- Green: Great buy, RSI and Stoch RSI with a quite positive entry point
- White: Good buy
- Yellow: A possible sell, depending on combination of timeframes. Not recommended for a buy
- Orange: Good sell, depending on combination of timeframes
- Red: If on more than one timeframe, especially higher ones, it is a good time to sell
For reference (But do your own research):
- Blue on Weekly: Might represent several weeks of growth. Lower timeframes will cycle from blue to red, while daily and Weekly gradually change
- Blue on Daily: Might represent 7-15 days of growth, depending on general resistance and how strongly is the weekly
PS: Check the RSI, Stochastic RSI and other indicators directly as well

STOCHASTIC+Stochastic Oscillators are used to determine Overbought and Oversold Market conditions. This Stoch is set to a quicker Length then normal with an RSI that changes color depending on Momentum. When RSI is Overbought you well get a red shadow to indicate the market is setting up for a sell. When the RSI is Oversold you will get a green shadow to indicate the market is setting up for a buy

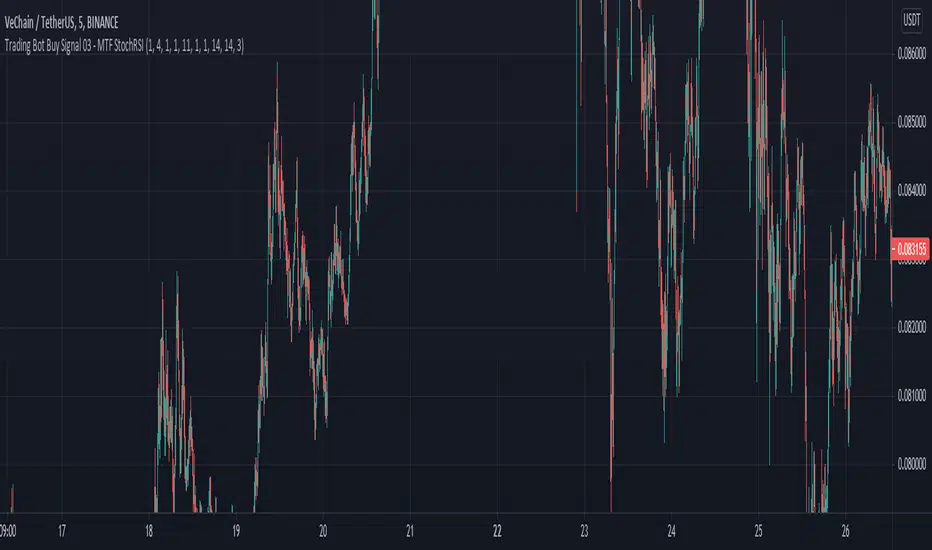
Trading Bot Buy Signal 03 - MTF StochRSIWelcome to our third Tradingview buy signal indicator.
We develop signals which have been specially developed for crypto trading bots. We publish new indicators at regular intervals.
This indicator is based on our "Trading Bot Buy Signal 03 Strategy - MTF StochRSI" strategy, so that you can apply and test this strategy to your charts/pairs.
The basic idea of this script is to use the stochastic RSI indicator in multiple Timeframes. When all selected timeframes show an oversold and in 5 Min Timeframe is an crossover, it triggers a solid buy signal. This strategy is relatively robust against false breakouts, even if these can of course never be avoided. These signals occur relatively rare, but you can set an alarm up on different pairs simultaneously. The strategy needs to be set up in 5 min chart cause of an additional crossover buy condition. It wasnt tested in Forex etc. but feel free to test it.
We recommend to base your sell strategy on trailing stop-loss and not indicator based. A traling stop-loss arming at 1% and trailing stop-loss percentage at 0.3% works well. Our goal was it to reduce the average coin holding time to a minimum. We recommend this procedure cause we believe in the power of long term uptrending crypto, compounding and dont want to sell at a loss in a false breakout. But you can handel it like you prefere.
This indicator using different timeframes so it is sending a repainting warning. Cause it calculates values in a different timeframe. But thats normal and it wont recalculate results.
Feel free to adjust the parameters to your preferences:
- Adjust the values of Stoch - K and Length of RSI and Main Stoch to change the sensitivity of the indicator
- Turn on different timeframes or leave default timeframes
- Adjust the oversold Limit of the StochRSI indicator to change results
We sell this indicator so it is invite only. But of cause you can test it before buying. Also you can freely test the strategy before. Simply check out our profil and look for "Trading Bot Buy Signal 03 Strategy - MTF StochRSI".
If there are questions, write them into the comments or contact us directly over the direct message. Happy Trading!
Stochastic MTF IICombines Stochastics, RSI and MACD Histogram to give a complete picture of the momentum.
The main two lines are stochastics from the higher time frame(current time frame* 4).
The red columns are stochastic of macd histogram.
The green histogram is the stochastic rsi of price.
The dots at 50 line is the correlation between price and macd+rsi combo.

Stochastic RSI+Applies signal values to significant changes in momentum and can be used in conjunction with other indicators and analysis to improve trade timing.
Both "Signal Up" and "Signal Down" can be used for alerts.
The magnitude of the signal is the difference between K and D.
(See the code for the logic and implementation.)
Signal Up occurs when momentum is within the band and moving upward.
Signal Down occurs when momentum is within the band and moving downward.
Interpretation Note:
The Stochastic RSI is known for false signals, so it should never be used as a pure buy or sell signal. It is useful as a warning or to help with trade timing.
A good example of this is: If you are bullish on a stock, and the signal is negative (signal down), then it may be wise to not buy until the recent change in momentum has dissipated.

RSI Divergence Indicator (colorcoded and smoothed)This indicator uses a custom RSI algorithm which displays a modified RSI and stochastic RSI as a simple to read and color coded oscillator.
When RSI turns green it signals a bullish divergence and considers the asset as overbought.
When it turns red it signals a bearish divergence and considers the asset oversold.
Overbought levels at 80 and oversold levels at 20.
Displaying the RSI this way removes the hassle to manually spot for divergences in the chart.
Only use this indicator in confluence with other indicators to confirm an upcoming trend.
This indicator features alarms when the indicator turns green or red.


Triangular Stoch RSI BandsThe indicator calculates Triangularity over Stoch RSI Overbought and Oversold Conditions
So Ever wondered how a overbought and oversold condition looks if the values are triangualrised
The indicator plots auto band levels on top of price
Enjoy!

TopTenAlgo 6. Trading IndexEN: Trend & Trading Index Oscillator is an indicator developed using Stochastic which makes your day trading easier. Is it to measure price swings with a more sensitive and close to zero error margin, and is the price movement and the direction of the trend compatible? is the ideal guide to look at. The oscillator consists of a 5 step system. Depressions below -0.85 are measured to determine the intake region (Lowlander 2) at the bottom of the step. At the top of the step, enthusiastic movements above 0.90 are detected to determine the sales region(Highlander 2). The buffer zone is the BALANCE "0" zone and its highlander "0. 40 zone close to enthusiasm, and the Lowlander "-0.50" zone close to depression.
This algorithm is prepared with @Top10Algo ... Study modify...
TR: Trend & Trading Index Osiatörü Stochastic kullanırak geliştirilen ve gün içi al satlarınızı kolaylaştıran bir göstergedir. Fiyat salınımlarını daha hassas ve sıfıra yakın bir hatalama payıyla ölçmek ve fiyat hareketi ile trendin yönü uyumlu mu? bakmak için en ideal yol göstericidir. Osilatör 5 basamaklı bir sistemden oluşmaktadır. Basamağın en altında alım bögesini belirlemek için -0.85 değerinin altındaki depresyonlar(Lowlander 2) ölçülür. Basamağın en üstünde ise satış bölgesini belirlemek için 0.90 değerinin üstündeki coşkulu hareketler (Highlander 2) tespit edilir. Ara bölge ise BALANCE “0” bögesi ve onun coşkuya yakın Highlander 1 “0.40" bölgesi ile depresyona yakın Lowlander 1 “-0.50" bölgesi yer alır.
Bu algoritma @Top10Algo ile beraber hazırlanmıştır... Çalışma Prensipleri modifiye edildi...

StochRSI x RSI x CCI x EMAsWanted to put this out there. Kind of a rough explanation but basically I wanted to build an indicator that takes out emotions and is easy to read. The indicator is basically RSI, stochRSI, CCI, and EMAs into an easy to read package. The traffic lights at the end will tell you if stochRSI/RSI and price action above according to EMA ribbon are in agreement. RSI with a period of 2 also always seemed very useful to me but it was just extremely distracting to look at it. I tried to make many rules in this indicator to find as much confluence between RSI, stochRSI, CCI, and EMAs to help you make better decisions. What is shown on the indicator is not necessarily a buy/sell signal. It should be seen as a way to view strength of price and possible momentum changes.
I find that one of the biggest distractions of indicators is taking your eyes off what is really happening at the chart above. This indicator uses popular and well used tools and helps you to get an easier visual of what is happening.
Purple lines at top and bottom: Short RSI ob/os
Red/orange and blue/green lines at top and bottom: When stochRSI kd and CCI also crosses +/- 100 or 200
Blue background: when stochRSI k > d and short RSI crosses above 30
Red background: when stochRSI k < d and short RSI crosses below 70
Green crosses: StochRSI is above 80 and making higher highs
Red X crosses: StochRSI is below 20 and making lower lows
Red/green fill of stochRSI and purple/blue dots on RSI: When short RSI and stochRSI are both ob/os
Red/green fill of RSI: Green when Long rsi > 50, red when Long rsi < 50
60/40 lines: Possible support/resistance for RSI
Traffic lights
1st light: Long RSI > EMA and stoch RSI k>d or vice versa
2nd light: Price above EMA 1 and 2 or vice versa
3rd light: when lights 1 and 2 are in agreement
Hope you enjoy!

Multi-Timeframe Stoch RSIGood evening folks!
Today I want to share with you a simple variant of the Stochastic-RSI built-in indicator.
Nothing too complex: by enabling the relative checkbox and setting the desired (k, d or the RSI ) source and timeframes, you can see higher timeframes data plotted on your screen.
Everything you need to do is enabling the indicator on the lowest timeframe (in this case 15 minutes), then you will see in YELLOW the information retrieved from the next higher timeframe (in this case 30 minutes) and in RED the information retrieved from the highest timeframe (in this case 45 minutes).
IT'S IMPORTANT THAT YOU DISPLAY THE INDICATOR ON THE LOWEST TIMEFRAME!
You can play with the overbought and oversold heights in order to have the best configuration you want (in oversold conditions is suggested to buy while in overbought conditions is suggested to sell)
The higher timeframes data are retrieved avoiding repainting since the method used for taking them is the 10th method described in this PineCoders Article , so, if you want to enable alerts, you SHOULD ignore the disclaimer message related to it without any problem.
Good Trading!

Catana Stochastic 4 in 1Catana Stochastic 4 in 1
Description
Catana Stochastic 4 in 1 is an excellent indicator to identify when the price trend of an asset, be it bullish or bearish, begins to run out. If an operator can identify that moment, he will be in optimal conditions to issue the corresponding market orders and to be able to take full advantage of the next price movement.
This indicator is represented by lines ranging between 80 and 20. These lines are called K and D.
Strategy
Overbought. When the blue and red lines are overbought, that is, at 80% of the indicator, it is a sell signal. The confirmation to enter into operation is given when the blue line crosses the red line.
Oversold. When the blue and red lines are oversold, that is, at 20% of the indicator, it is a buy signal. The confirmation to enter into operation is given when the blue line crosses the red line.

SRSI/CCI :: ALLinPower v10.0
Everything you see in this indicator has beed designed with purpose to ease your trading with visual technical analysis of the market. It pulls data from 7 different TimeFrames and it can not be more simpler visual representation of its calculations when applied on chart.
When applied on chart, you will see two sets of WAVES. First set is made out of SRSI calculation and the second is made out of CCI calculation. Both of them follows the same rules.
Background GREEN/RED wave is made out of Multiple Timeframes and it represents a TREND. GREEN for LONG, RED for SHORT trend.
Over the background wave there is a wave made of current TimeFrame data and its main purpose is to see when the POWER of certain direction will diminish. The less time little wave stays in current trend the more likely is that it will change the trend based on lack of power the market is getting in certain direction.
HOW TO USE IT?
Rule 1.
TIMEFRAMES
Choose the best TimeFrame for the job. I use: 1min, 2min, 3min, 5min, 8min, 13min, 21min, 34min or 56min (golden ratio). You can also pick a different TF but only to up to 1h TF chart as it does not work well with TF over 1h. Smaller TF is used for SCALPING of DAY TRADING higher TF is used for SWING TRADING. You get the picture?
Rule 2
TO ENTER BUY/LONG POSITION: When big trend wave is below the middle line and coloured in RED and little wave just entered the area and exits it very soon after. Basically when RED straight line gets smaller and smaller (the POWER of SHORT diminishes) it is a sign for LONG.
TO ENTER SELL/SHORT POSITION: When big trend wave is over the middle line and coloured in GREEN and little wave just entered the area and exits it very soon after. Basically when GREEN straight line gets smaller and smaller (the POWER of LONG diminishes) it is a sign for SHORT.
To ease yourself the spotting of this instances just follow the GREEN/RED dots and use ALERTS (choose BUY POWER for LONG signals or choose SELL POWER for SHORT signals) to make yourself free from staring at a computer/mobile all the time and just wait for a signal.
Rule 3
CAUTION
Do not rush to enter a position and try to predict what indicator will do next. It does not end well.
Be aware you are not exiting a position in panic that would be too soon or even worse, you get married to bad trade and you are not exiting even though you should exit by many signals you get.
Use risk management strategy to protect your capital.
Follow the rules and make your trading easier and better.

Diego Riobo Cabot's Force Indicator Diego Riobo Cabot
© riobocabotd
Analysing the Market as Physical Forces
Credits First:
Tradingview Pine Comunity, it's just amazing, honestly.
Godmode Indicator's creators. I was inspired by them to create an indicator that takes a lot of variables into account. I also took the idea of the Momentum and LSMA from there
Function te get volume from lower tf was taken from a post in stack overflow. So, credits to you, anonymous hero.
Let's get to it:
so... What is this thing, exactly?
I wanted to measure the market's upward and downard force, in order to calculate the resulting force. Just as a curiosity.
At the end, I got a pretty decent indicator in my hands and I'd like to share it with you guys.
The main goal was to apply basic rules of physics: Velocity, Acceleration, Mass and Force (We could go further if we wanted, such as Impulse, Quantity of Movement, Impact and so on)
Everything appart from mass is a vector, meaning it has a direcction and a magnitude. Each of them were decompossed in upwards and downwards direction
Nevertheless I pictured this Analysis as a "fight" between two teams the Bulls and the Bears (Buyers and Sellers). So I measured two masses: Bulls (+) and Bears(-)
Glossary (internal Clockwork)
° Velocity: Is the ratio between a travelled distance and the time that took to travel it.
+ Upwards Velocity (v_up): Meausures if current source is higher than the previous and stores this value. Has positive values
+ Downwards Velocity (v_dn): Meausures if current source is lower than the previous and stores this value. Has negative values
+ Both vectors are averaged using the rma function (same average type used in the RSI)
+ The length of this average is called length_v: "Lookback - Velocity"
+ Resultant Velocity (v_av): The sum of the averaged v_up and v_dn, since they have equally opposite directions, there's no need for a vectorial sum.
+ Velocity Index (v_in): It's an index between +100% and -100%. Meausures where v_av stands in relation to high (v_up) and low (v_dn). Not used for calculations, but I'll leave it there for further research
° Acceleration: Meausures the rate of change of velocity during time. Since we already have the velocity calculated, it's pretty straight forward
+ Upwards Vel increase (v_up_up): Stores positive variations of upwards' velocity.
+ Upwards Vel decrease (v_up_dn): Stores negative variations of upwards' velocity.
+ Downwards Vel increase (v_dn_up): Stores positive variations of downwards' velocity.
+ Downwards Vel decrease (v_dn_dn): Stores negative variations of downwards' velocity.
+ Upwards Accel. (a_up): v_up_up + v_dn_up
+ Downwards Accel. (a_dn): v_up_dn + v_dn_dn
+ Resultant Accel. (a_av): a_up + a:dn Not used, is there for further research
° Mass: Measures the volume of operations. How much asset is bougth (Bull) or sold (bears).
+ Mass is measured from a lower timeframe. It checks if the candles are Bullish or Bearish (Could be done with closing prices, or typical price)
+ The Lower Timeframe is determined in minutes throught the input variable "Lower Timeframe"
+ Bull mass (vol_up): Total bullish volume in the lower timeframe, for the current candle period
+ Bear mass (vol_dn): Total bearish volume in the lower timeframe, for the current candle period
+ Neutral mass (vol_nt): Total neutral volume in the lower timeframe. (Buy price = Open price) Not used for calculations. Could be used for resistance points?
+ Resultant mass (vol_av): |vol_up - vol_dn|
+ Total mass (vol_tt): Sum of all masses (Just the total volume)
° Force: It's nothing else than mass * acceleration
+ Upwards Force (f_up): vol_up * a_up Bulls mass * Positive Acceleration
+ Downwards Force (f_dn): vol_dn * a_dn Bears mass * Negative Acceleration.
+ Resultant Force (f_av): f_up + f_dn Not used, is there for further research
° Force Index
+ Upwards Channel (fi_up)
+ Downwards Channel (fi_dn)
+ Both vectors are averaged using the rma function (same average type used in the RSI)
+ The length of this average is called length_v: "Lookback - Force"
+ Raw Index (fi_rw): It's an index between +100% and -100%. Meausures where f_av stands in relation to high (f_up) and low (f_dn).
+ Index (fi_in): It's the averaged raw index using the rma function and the "Force Index Smoothing" period
+ Signal (fi_sg): It's the averaged fi_in using the rma function and the "Force Signal Smoothing" period
+ Momentum (fi_mo): fi_in - f_sg. If the momentum is higher than the current force direction, current force should be outwon by previos market trend. It's Smoothed out using the "Force Momentum Lookback"
+ Trend (fi_tr): It's a linear regression of fi_in using a very long period (Force Trend Lookback)
Okay... sure, but how do I use it?
° It is very similar to how the GodMode 3.2 indicator works actually, so if you're familiar with it, you can start trying this indicator out. I've noticed it can provide a bit more timely signals
° It's also similar to Stochastics or RSI indices... but with three lines. an instantaneous one (Force - Blue), an averaged one (Signal - Orange) and a slow one (Trend - Green)
° Bullish/Bearish momentum: Trendline (green) above 0% means Bullish. Above 12% means a trend wants to form and if it reaches 40% means the strend is super strong (Bitcoin like, strong). The opposite goes for bearish trends (values under 0)
° Line crossings: Instant Force Line (Blue) crosses over the Signal Line (Orange), while the orange is going slightly down or flat under the -12%: Means a long signal. The opposite applies for the Short signals
° Line crossings: Same as above, but when the Signal crosses over the Trend Line (Green)
° Reversals: The background columns are supposed to immitate the "Inertia" of movement. If inertia's bars are higher (when positive) or lower (when negative) than the Force Line (Blue), then it means that the current force the market is making, is probably weaker (at that time) than the inertia the market carries with it.
Tips:
° If you wen't long, the orange line is going slightly down, but it's over +12%, it means the bullish trend is still going, although not as strong as before. You could keep your long position. The reverse applies for short.

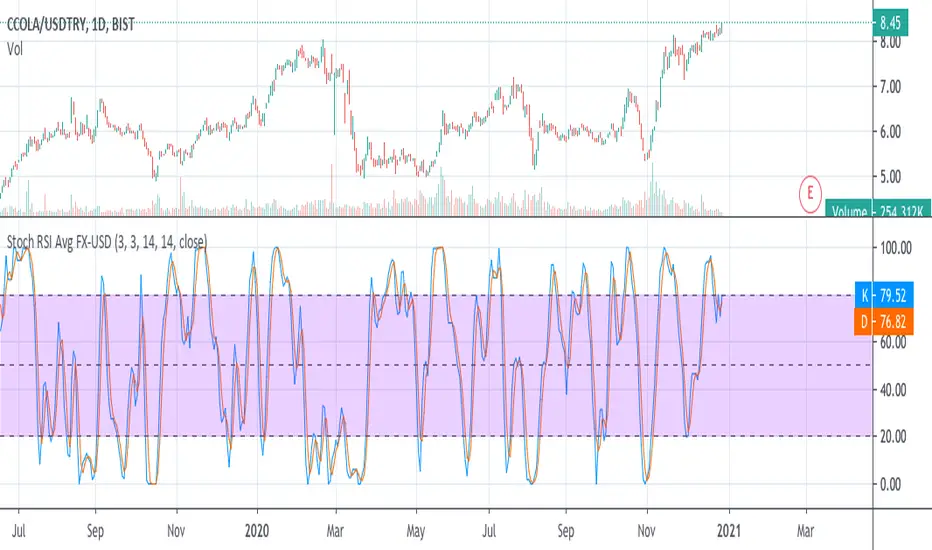
Stochastic RSI Average FX-USDThis script calculates average stochastic RSI of local currency and USD price of the stock.
(JS) Double StochasticThe idea for this indicator came from looking at the Stochastic RSI. The Stochastic RSI takes the RSI reading then applies the Stochastic formula to it - an indicator on top of an indicator. Using this logic, I decided to try using a Stochastic on the existing Stochastic in order to smooth it out - hence the "Double Stochastic". I have also added the option to add RSI on to the indicator as well (with smoothing if you'd like).
Resolution:
I added this so you can look at the reading on any time frame.
K & D:
This is the standard K% and D% used with the Stochastic indicator - the numbers modify the length of their calculations.
Smooth:
This is the smoothing calculation, also from the normal Stochastic indicator.
Use Second Stochastic:
This adds a second Stochastic on to the chart for analysis.
K & D 2:
This is the parameters used to calculate the second K% and D% lines.
Smooth 2:
This is the smoothing interval for the second K% and D% lines.
Use K% and D%:
The default for this is to have it on. What it means is that you wish to see both the K% and D% lines (watching for a cross). If you turn this off, the plot switches to a K% & D% difference line. It is just one line that plots the distance between the two.
SMA Length Using Difference:
If this is on, then you can smooth the difference plot with an SMA, obviously if you just want the raw difference to plot, then set this to 1.
Use RSI:
Since both RSI and Stochastic use a 0-100 scale, I added the ability to plot the RSI along with the Stochastic. This will not plot if you are using the Difference plot, being that plot isn't on a 0-100 scale.
Smooth RSI:
I also added the ability to smooth the RSI if you'd like, you can turn this off for the standard RSI reading.
RSI Length:
This is the period of bars used to calculate the RSI.
RSI Smoothing Length:
This is the smoothing interval if you'd like to apply a moving average on the regular RSI reading.
RSI Smoothing Use EMA:
This makes the RSI smoothing use an EMA, when off an SMA is used instead.
RSI Source:
And finally, this is the source used to calculate the RSI value.
I hope that you all may find this useful, I have been using it myself with a lot of success. Any questions, please leave them in the comments, thanks!

Fear N GreedOverview
The goal of this script was to apply the concept of Herd Mentality. While one voice may seem unique, when you combine all the voices together they average out and show an overall emotion of the herd. We should be able to apply this concept to indicators, giving us the Fear and Greed of the markets.
How to Use
Buy when there is fear and sell when there is greed. Pay attention to changes in direction of the indicator. If the data is fearful and the data is starting to change direction, it signals that it's probably a good time to buy because greed is slowly starting to enter the market. You can use this indicator in any time frame, just check the past data to determine how useful it will be for that specific period.
Options
Smoothing : This will smooth the data. Try to stay around 5-15. High values will cause the indicator to lag
Line Width : Visually changes the width of the data line
Top Band +- : Moves the top band up or down
Bot Band +- : Moves the bottom band up or down
Mid Band Width : Adjusts the width of the middle region
Fear Alert Level >= : Sets when the alert will start to trigger
Greed Alert Level >= : Sets when the alert will start to trigger
Indicators
There are multiple indicators used in this script. I used the Stochastic RSI to measure strength in the market. This combines well with the MACD indicator by giving you really good entry and exit points. There is an indicator combining money flow and rate of return to give a basic emotion of the data. I also included breadth and momentum and several others to help gauge the direction of the market. I then normalize all of the indicators between 0-100 so that I can get an overall average, smooth the noise, and ultimately plot the data.
Bands
While making this script I noticed flowing regions of the data that would act as support and resistance so I did my best to calculate where they might fall. I essentially take the high and low data points from various lengths averaging them and then apply a smoothing filter to the band. I then noticed that between the bands there was a significant region that acted as a middle resistance and support. I decided the best way to make this region was to take the average high + average low of the data and divide it by 2 to get the center region. The reason I did this instead of just using the mid point of the bands was because when the data stays in a similar region it creates resistance, so it's more accurate to base the mid point on a shorter time frame rather than the overall bands of higher timeframes.
Alerts
Alerts are set up based on the change in data direction. If you set Fear as the alert for Fear Alert >= it will wait for a change in direction if the data is greater than or equal to the selected Fear level.
When setting alerts, make sure to use Once Per Bar Close as the option. There are 3 alert types: Fear Alert, Greed Alert, and Fear and Greed Alert. Fear and Greed Alert will combine the alerts into one message so that it's usable for free accounts. Fear Alert and Greed Alert will only message for those specific positions.

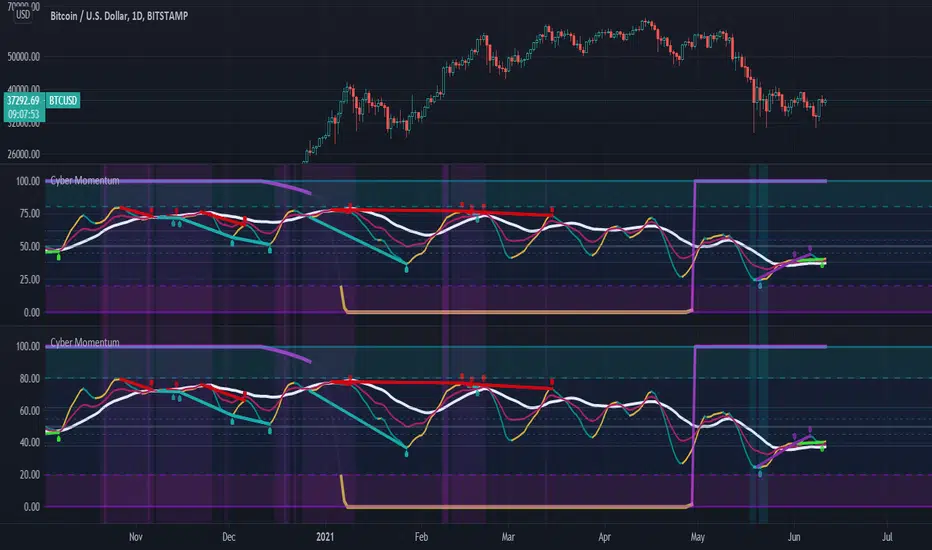
Cyber MomentumThis oscillator is the combination of different settings RSI , RSX , STOCHRSI , MSI ,... in a Stochastic function that can help traders to understand the weakness and strength of momentum in candle sticks in different time frames.
This oscillator organized by three Line , control zone and Divergence Line
1:) Fast Line
2:) Slow Line
3:) Heavy Line
4:) Neutral Zone between Fibo 38.2% & 61.8%
5:) Bullish Control Zone
6:) Bearish Control Zone
7:) Divergence Line
And there are two theories of finding tradable signals behind those parts .
The first and the most simplest theory is the situation that the Fast Line has the possibility to be supported by Slow or Heavy Lines and basically reverse its slope !!
But there are some rules and notes for this theory ... First of all the accuracy and rate of that is variable in three main categories of situation
1:) with or without price action reversal structure like reversal pattern (Head&Shoulder , Quasimodo , .... )
2:) with or without regular divergence
3:) in which control zone ?
So basically the most powerful setup occurs when price action is already in the reversal structure and the potential to have at least one drive of regular divergence exist and also the Fast Line is in the opposite control zone of the current time frame trend .... so obviously if one of those rules will not be satisfied so the signal will be the less value
The second theory is the signals that occur after the reversal, obviously a sign of trend continuation. there are two type of that you can use with this oscillator
The first one happens when price reverses its trend and this oscillator is moving to the neutral zone ... so if at least one drive of hidden divergence exist the neutral zone will have good possibility to reverse the slope of the oscillator obviously this would happen usually after hidden divergence confirmed .
and the second one is basically the first type but after the reversal Subsequently in the outside of the bullish/bearish control zone ... those kinds of signals are NOT the reversal potency signal at all !! they designed for trend continuation... be careful of them and try trade with your old friend trend ! .... also The existence of hidden divergences will be better for trade in this kind of signals .
The idea of this oscillator was inspired by @mrhashem Borjas Tarh Momentum.
Bjorgum RSIRSI output signals are displayed with color change to reflect the plotted value. This makes evaluating RSI conditions require but a glance.
RSI momentum buy signals are given on the cross of the 50 level, whereas sell signals are given on a fall below.
Default values a 5 period RSI which gives more timely entrances and exits for swing traders. This can be adjusted to the typical 14 period if the viewer desires slower signals.
Bullish and bearish area is shaded to accentuate the signal to the eye.
Excellent results can be found when coupling BJ RSI, with BJ TSI, and the reversal system using all 3 as a complete together simultaneously
Default color changes are plotted as a recorded value falls within the following levels:
RSI < 30 = green
RSI 30-50 = red
RSI 50-70 = blue
RSI 70-80 = yellow
RSI 80-90 = orange
RSI 90-100 = white hot
