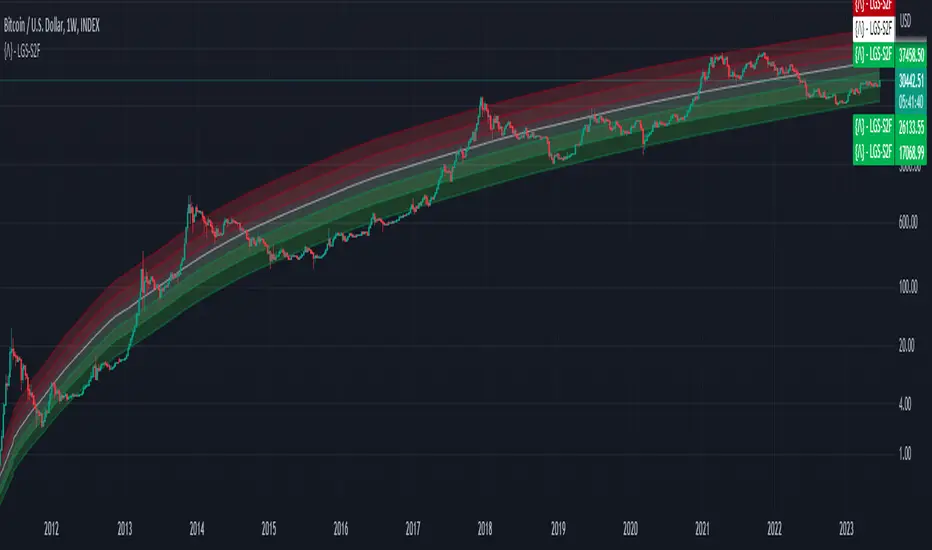
Bitcoin Limited Growth ModelThe Bitcoin Limeted Growth is a model proposed by QuantMario that offers an alternative approach to estimating Bitcoin's price based on the Stock-to-Flow (S2F) ratio. This model takes into account the limitations of the traditional S2F model and introduces refinements to enhance its analysis.
The S2F model is commonly used to analyze Bitcoin's price by considering the scarcity of the asset, measured by the stock (existing supply) relative to the flow (new supply). However, the LGS-S2F Bitcoin Price Formula recognizes the need for improvements and presents an updated perspective on Bitcoin's price dynamics.
Invalidation of the Normal S2F Model:
The normal S2F model has faced criticisms and challenges. One of the limitations is its assumption of a linear relationship between the S2F ratio and Bitcoin's price, overlooking potential nonlinearities and other market dynamics. Additionally, the normal S2F model does not account for external influences, such as market sentiment, regulatory developments, and technological advancements, which can significantly impact Bitcoin's price.
Addressing the Issues:
The LGS-S2F Bitcoin Price Formula introduces refinements to address the limitations of the traditional S2F model. These refinements aim to provide a more comprehensive analysis of Bitcoin's price dynamics:
Nonlinearity: The LGS-S2F model recognizes that the relationship between the S2F ratio and Bitcoin's price may not be linear. It incorporates a logistic growth function that considers the diminishing returns of scarcity and the saturation of market demand.
Data Analysis: The LGS-S2F model employs statistical analysis and data-driven techniques to validate its predictions. It leverages historical data and econometric modeling to support its analysis of Bitcoin's price.
Utility:
The LGS-S2F Bitcoin Price Formula offers insights for traders and investors in the cryptocurrency market. By incorporating a more refined approach to analyzing Bitcoin's price, this model provides an alternative perspective. It allows market participants to consider various factors beyond the S2F ratio alone, potentially aiding in their decision-making processes.
Key Features:
Adjustable Coefficients
Sigma calculation methods: Normal or Stdev
Credit:
The LGS-S2F Bitcoin Price Formula was developed by QuantMario, who has contributed to the field of cryptocurrency analysis through their research and modeling efforts.
Stocktoflow
Bitcoin Halving Rainbow + S2F Model PriceOverview
The rainbow price line:
This script creates a colorful view of Bitcoin's price action, where different colors indicate the time until the next halving date. The color scale in the top right highlights what each main color group represents in terms of days until the next halving. Using historical data, the simple indication of days until the next halving has somewhat accurately predicted potential bottoms and tops of market cycles. Comparing current colors to previous cycles provides a rough view of where BTC is in its current cycle and what to expect going forward until the next halving date.
In addition to the colored price action, I have incorporated the stock-to-flow model price for Bitcoin.
The stock-to-flow (S2F) model price:
The stock-to-flow ratio is a calculation that aims to estimate how many years are required to produce the current stock of an asset, based on the current production rate. When applied to Bitcoin, we simply divide the total amount of bitcoins in circulation by the amount of bitcoins mined in a certain timeframe. Once we have this value, we can calculate a model price based on the stock-to-flow ratio. This S2F model price uses a 463-day moving average. Preston Pysh came up with this number as he believed Bitcoin cycles happen in three phases: bull run, correction, and a reversion to the mean. He estimated there are about 200,000 blocks per cycle, three phases per cycle, and ~144 blocks per day. Dividing all three gets us 463. I have removed 1,000,000 coins from this calculation to account for Satoshi's coins.
The process I took to plot this model price (credit to PlanB for originally creating this calculation):
-Declare constant variables for the halving period, starting block reward, and the number of coins Satoshi owns.
-Fetch the block index by using the request.security() function.
-Determine the number of halvings that have occurred by dividing the block index by the halving period.
-Calculate the current block reward by multiplying the initial block reward by 0.5 raised to the power of the number of halvings.
-Calculate the number of blocks mined per period (day or week) and derive the stock (total bitcoins in circulation minus Satoshi's coins) and flow (annual block rewards) from it.
-Calculate the S2F ratio by dividing the stock by the flow.
-Calculate the S2F model price by applying a mathematical formula (ModelPrice = exp(-1.84) * S2F to the power of 3.36) along with a 463-day moving average.
** Please note, due to the use of the 463-day MA, the first ~400 days of the S2F model price is not entirely accurate.
In addition to the above, I have added vertical lines on each halving date, along with labels that have a tooltip if you hover over them, which will show more information about that particular halving.
Important tips:
-This script has been designed to work on the 1-Day timeframe but can also work on the 1-Week timeframe. Any other timeframe will not accurately plot all the information due to the way I have developed the script.
-This script is best used on the ticker I have posted this on, "INDEX:BTCUSD". It can also work on "BLX" or "BITSTAMP:BTCUSD".
-Hide candles when using the script to just show the halving rainbow (hover over the symbol name in the top left and press the eye icon).
-Right-click the price scale and select "Scale price chart only" to get a better view of the plots.
-Right-click the price scale and select "Logarithmic."
-I will update the script as time goes on to show future halvings along with adjusting the next halving date as we get closer (if it changes).
Settings Menu:
Tooltips are included explaining what the settings do, but here's a quick summary:
-'Show Vertical Halving Lines?': Default is true. This allows the user to remove the vertical lines shown on each halving date.
-'Show Halving Labels?': Default is true. This allows the user to remove the info labels shown on each halving date.
-'Halving Line and Label Color': Default is white. This allows the user to change the color of the halving lines and labels to better fit their chart layout.
-'Show Stock to Flow Model Price?': Default is true. This allows the user to remove the S2F model price.
-'Stock to Flow Model Price Color': Default is white. This allows the user to change the color of the S2F model price to better fit their chart layout.
-'Draw Color Table?': Default is true. This allows the user to remove the color table in the top right of the chart.
-'Distance rainbow is away from actual price action': Default is 0 (Plots over candles). This allows the user to adjust where the halving rainbow is plotted if they would like to also see candles on the chart. (Use any value under 0.9)
Feel free to message me or comment on the post with any questions or issues!
Much more to come!
Thanks for reading, enjoy!

Trend Tracer IndexThis is the first iteration of an effort to make multiple well-known analytical tools collaborate to help give an objective consensus to the current market conditions.
This indicator ONLY works on a 1 Day Bitcoin Chart!
It contains the following indicators:
Puell Multiple (ours: )
Hash ribbons (by capriole_charles: )
Weekly moving average
Logaritmic growth curve (by quantadelic: )
Stock to flow model (ours: )
Each indicator can be viewed one at a time as either an overlay or oscillator version of itself. Make sure to read the tooltip (the little "i") on how to switch between them since you need to manually move it between the oscillator pane and the chart pane.
A global index was added which will take the average of all these indicators to show the final consensus.
You can assign weights to each indicator, this will affect the Global index. They can be viewed as a 0 to 1 or a 0 to 100 scale, it should work the same.
For example if you don't want the stock to flow index as part of your equation leave that at 0, maybe you want the weekly moving average at half it's weight you can put it at 0.5. This way the global index average will primarily be decided by the other 3 indicators, and slightly be affected by the weekly moving average.
There is a table that contains all the index values of each indicator for a quick overview.
Finally, alerts have been added for each indicator and the global index.
I will maintain this indicator with updates and perhaps even add more analytical tools based on any suggestions.

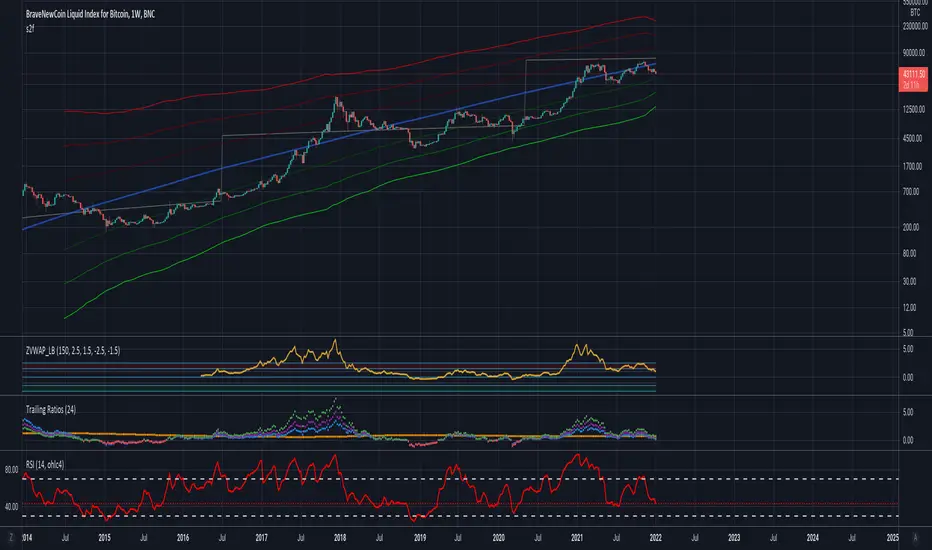
TrendTracers Bitcoin Stock to Flow ModelFor the best results, make sure to view this indicator on a bitcoin chart with a very long history (e.g. BNC:BLX)!
This model treats Bitcoin as being comparable to commodities such as gold, silver or platinum. These are known as ‘store of value’ commodities because they retain value over long time frames due to their relative scarcity. It is difficult to significantly increase their supply i.e. the process of searching for gold and then mining it is expensive and takes time. Bitcoin is similar because it is also scarce. In fact, it is the first-ever scarce digital object to exist. There are a limited number of coins in existence and it will take a lot of electricity and computing effort to mine the remaining coins still to be mined, therefore the supply rate is consistently low.
The stock-to-flow model predicts value changes in a straightforward manner. It compares an asset’s current stock to the rate of new production, or how much is produced in a year.
Calculation:
Take bitcoin production in a period, divide it by that period and then multiply by 365 to get the estimated yearly production and then calculate the stock to flow.
yearlyFlow = ((stockChange) / period ) * 365
stockToFlow = (stock - missingBitcoins) / yearlyFlow
Model Value = -1.84ᵉ * stockToFlow³.³⁶ (mathematical model to calculate the model price)
For more information about the calculations followed: stats.buybitcoinworldwide.com
Features:
Works on the Daily, Weekly and Monthly Timeframe.
Allows you to adjust between a 10-day period and a 463-day period.
Has the option to account for missing bitcoins, lets you adjust the amount of missing bitcoins.
The ability to toggle a standard deviation of the Model Value with a multiplier of 1, 2 or 3
Displays a Stock to Flow Deviation Ratio: If the Deviation Ratio is close to 0 it means the price of Bitcoin is close to the Model Value Line(or Stock to Flow Ratio). If the Deviation Ratio is close to 1 or -1, it means the price of bitcoin is near the selected deviation levels.
You can toggle between the Overlay version and the Oscillator version, default is on Oscillator version. If you want to switch: Untick Oscillator mode in the indicator settings, click on the three dots and select "move to existing pane above". Then click on the three dots again and select Pin to scale A. Done!
As a bonus: Now you can toggle a "1-year Realized Price" graph, while it's not officially part of the Stock to Flow Model it does share similar technicals about supply and scarcity. The 1-year Realized Price is the realized market cap divided by total amount of generated coins.
I just noticed that, while the color gradient function is pretty cool, it does not allow for end users to customize their colors after applying this indicator to their chart. Sorry!

Ripple (XRP) Model PriceAn article titled Bitcoin Stock-to-Flow Model was published in March 2019 by "PlanB" with mathematical model used to calculate Bitcoin model price during the time. We know that Ripple has a strong correlation with Bitcoin. But does this correlation have a definite rule?
In this study, we examine the relationship between bitcoin's stock-to-flow ratio and the ripple(XRP) price.
The Halving and the stock-to-flow ratio
Stock-to-flow is defined as a relationship between production and current stock that is out there.
SF = stock / flow
The term "halving" as it relates to Bitcoin has to do with how many Bitcoin tokens are found in a newly created block. Back in 2009, when Bitcoin launched, each block contained 50 BTC, but this amount was set to be reduced by 50% every 210,000 blocks (about 4 years). Today, there have been three halving events, and a block now only contains 6.25 BTC. When the next halving occurs, a block will only contain 3.125 BTC. Halving events will continue until the reward for minors reaches 0 BTC.
With each halving, the stock-to-flow ratio increased and Bitcoin experienced a huge bull market that absolutely crushed its previous all-time high. But what exactly does this affect the price of Ripple?
Price Model
I have used Bitcoin's stock-to-flow ratio and Ripple's price data from April 1, 2014 to November 3, 2021 (Daily Close-Price) as the statistical population.
Then I used linear regression to determine the relationship between the natural logarithm of the Ripple price and the natural logarithm of the Bitcoin's stock-to-flow (BSF).
You can see the results in the image below:
Basic Equation : ln(Model Price) = 3.2977 * ln(BSF) - 12.13
The high R-Squared value (R2 = 0.83) indicates a large positive linear association.
Then I "winsorized" the statistical data to limit extreme values to reduce the effect of possibly spurious outliers (This process affected less than 4.5% of the total price data).
ln(Model Price) = 3.3297 * ln(BSF) - 12.214
If we raise the both sides of the equation to the power of e, we will have:
============================================
Final Equation:
■ Model Price = Exp(- 12.214) * BSF ^ 3.3297
Where BSF is Bitcoin's stock-to-flow
============================================
If we put current Bitcoin's stock-to-flow value (54.2) into this equation we get value of 2.95USD. This is the price which is indicated by the model.
There is a power law relationship between the market price and Bitcoin's stock-to-flow (BSF). Power laws are interesting because they reveal an underlying regularity in the properties of seemingly random complex systems.
I plotted XRP model price (black) over time on the chart.
Estimating the range of price movements
I also used several bands to estimate the range of price movements and used the residual standard deviation to determine the equation for those bands.
Residual STDEV = 0.82188
ln(First-Upper-Band) = 3.3297 * ln(BSF) - 12.214 + Residual STDEV =>
ln(First-Upper-Band) = 3.3297 * ln(BSF) – 11.392 =>
■ First-Upper-Band = Exp(-11.392) * BSF ^ 3.3297
In the same way:
■ First-Lower-Band = Exp(-13.036) * BSF ^ 3.3297
I also used twice the residual standard deviation to define two extra bands:
■ Second-Upper-Band = Exp(-10.570) * BSF ^ 3.3297
■ Second-Lower-Band = Exp(-13.858) * BSF ^ 3.3297
These bands can be used to determine overbought and oversold levels.
Estimating of the future price movements
Because we know that every four years the stock-to-flow ratio, or current circulation relative to new supply, doubles, this metric can be plotted into the future.
At the time of the next halving event, Bitcoins will be produced at a rate of 450 BTC / day. There will be around 19,900,000 coins in circulation by August 2025
It is estimated that during first year of Bitcoin (2009) Satoshi Nakamoto (Bitcoin creator) mined around 1 million Bitcoins and did not move them until today. It can be debated if those coins might be lost or Satoshi is just waiting still to sell them but the fact is that they are not moving at all ever since. We simply decrease stock amount for 1 million BTC so stock to flow value would be:
BSF = (19,900,000 – 1.000.000) / (450 * 365) =115.07
Thus, Bitcoin's stock-to-flow will increase to around 115 until AUG 2025. If we put this number in the equation:
Model Price = Exp(- 12.214) * 114 ^ 3.3297 = 36.06$
Ripple has a fixed supply rate. In AUG 2025, the total number of coins in circulation will be about 56,000,000,000. According to the equation, Ripple's market cap will reach $2 trillion.
Note that these studies have been conducted only to better understand price movements and are not a financial advice.

{Gunzo} Stock to Flow (Gold, Silver, Dollar, Bitcoin)This indicator displays the Stock to Flow (S2F) ratio for popular commodities (Gold, Silver, Dollar, Euro, Bitcoin, Ethereum) in order to
compare them and determine which ones could be a good Store of Value (SoV).
OVERVIEW :
Stock to Flow is a popular indicator used to predict commodities scarcity. It evaluates the total stock of a commodity against the total amount that can be produced during a year. This model supposes that if scarcity is increasing, the price is going to increase.
This model has been used over the last years on Bitcoin to determine if the asset was undervalued or overvalued, and even make prediction models on the future price.
This script is going to focus on the Stock to Flow ratio (total stock/amount produced) to compare the following assets over time :
Mining resources (mined) for Gold and Silver
Cryptos assets (mined) for Bitcoin and Ethereum
FIAT currencies (banknotes printed) for Dollar and Euro
CALCULATION :
The calculation of the Stock to Flow ratio evaluates the total stock of a commodity produced against the production made for a specific year. The data is calculated on a yearly basis, then interpolated to get monthly or daily values.
DATA ORIGIN :
The main information needed to calculate the Stock to Flow ratio is the "yearly production" of a commodity. I tried to retrieve that information from the most reliable sources :
for Gold from research on www.gold.org
for Silver from research on www.silverinstitute.org
for Ethereum from research on etherscan.io
for Bitcoin from data source "QUANDL:BCHAIN/TOTBC" from www.quandl.com
for Dollar from research on www.federalreserve.gov
for Euro from research on www.ecb.europa.eu
SETTINGS :
Smoothing for interpolated data : Smoothing factor for assets that are calculated yearly and then interpolated (Gold, Silver, Dollar, Euro, and Ethereum)
Smoothing for non interpolated data : Smoothing factor for assets that are calculated daily and not interpolated (Bitcoin)
Display asset names : Display assets names in a colored rectangle on the right side of the chart
Display asset values : Display assets Stock to Flow ratio in a colored rectangle on the right side of the chart
Display key events for assets : Display important events for the assets at the bottom of the chart using the same color as the assets lines (for example Orange diamond is a Bitcoin halving). Please refer to the script code for the details of all events.
USAGE :
This script can be used on any asset available on TradingView as the data used is either static or external.
However I recommend using it the Gold asset from currency.com as the depth of the chart will be bigger (since 1980s).
It is recommended to used this script on the monthly timeframe as the chart data is calculated yearly and then interpolated.

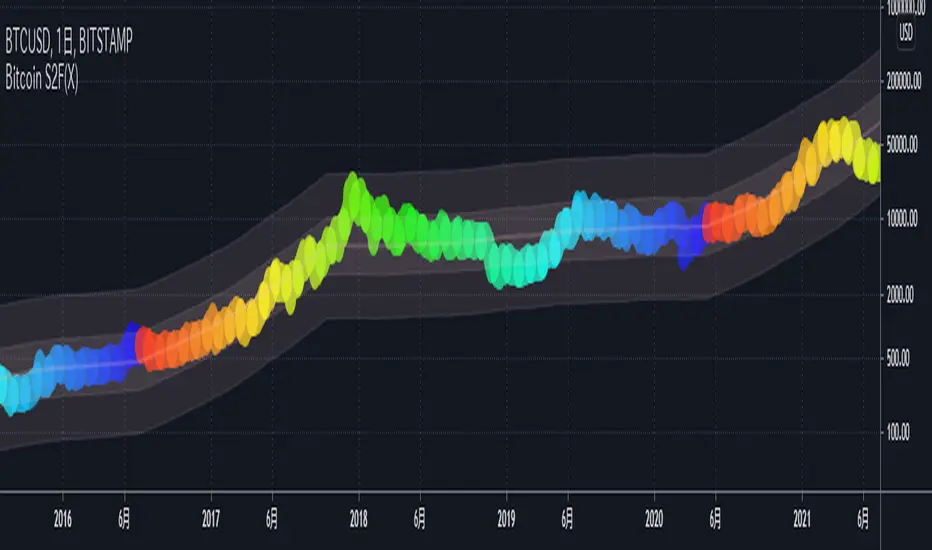
Bitcoin S2F(X)This indicator shows the BTCUSD price based on the S2F Model by PlanB.
We can see not only the S2F(Stock-to-Flow) but also the S2FX(Stock-to-Flow Cross Asset) model announced in 2020.
█ Overview
In this model, bitcoin is treated as comparable to commodities such as gold .
These commodities are known as "store of value" commodities because they retain their value over time due to their relative scarcity.
Bitcoins are scarce.
The number of coins in existence is limited, and the rate of supply is at an all-time low because mining the 2.2 million outstanding coins that have yet to be mined requires a lot of power and computing power.
The Stock-to-flow ratio is used to evaluate the current stock of a commodity (the total amount currently available) versus the flow of new production (the amount mined in a given year).
The higher this ratio, the more scarce the commodity is and the more valuable it is as a store of value.
█ How To View
On the above chart price is overlaid on top of the S2F(X) line. We can see that price has continued to follow the stock-to-flow of Bitcoin over time. By observing the S2F(X) line, we can expect to be able to predict where the price will go.
The coloured circles on the price line of this chart show the number of days until the next Bitcoin halving event. This is an event where the reward for mining new blocks is halved, meaning miners receive 50% fewer bitcoins for verifying transactions. Bitcoin halvings are scheduled to occur every 210,000 blocks until the maximum supply of 21 million bitcoins has been generated by the network. That makes stock-to-flow ratio (scarcity) higher so in theory price should go up.
The stock-to-flow line on this chart incorporates a 463-day average into the model to smooth out the changes caused in the market by the halving events.
I recommend using this indicator on a weekly or monthly basis for BITSTAMP:BTCUSD .
█ Reference Script
Bitcoin Stock to Flow Multiple by yomofoV
Sushi Stock To Flow RainbowHello everyone,
as always, I hope you are doing well.
To sum up:
The stock-to-flow is the number we get when we divide the total stock by the annual production (flow).
It indicates how many years are required, at the current production rate, to produce what is in the current stock.
The stock is simply the total in circulation, in our case, the number of Sushi in circulation.
On the other hand, the flow is the total number of Sushi created each year.
In our case:
- The number of new sushi issued is reduced every month
- The total number of sushi in circulation is set at 250 million
- The last reduction will take place in October 2023
The empirical formula of the stock to flow is, in our case: total number of sushi in circulation / number of sushi produced each month.

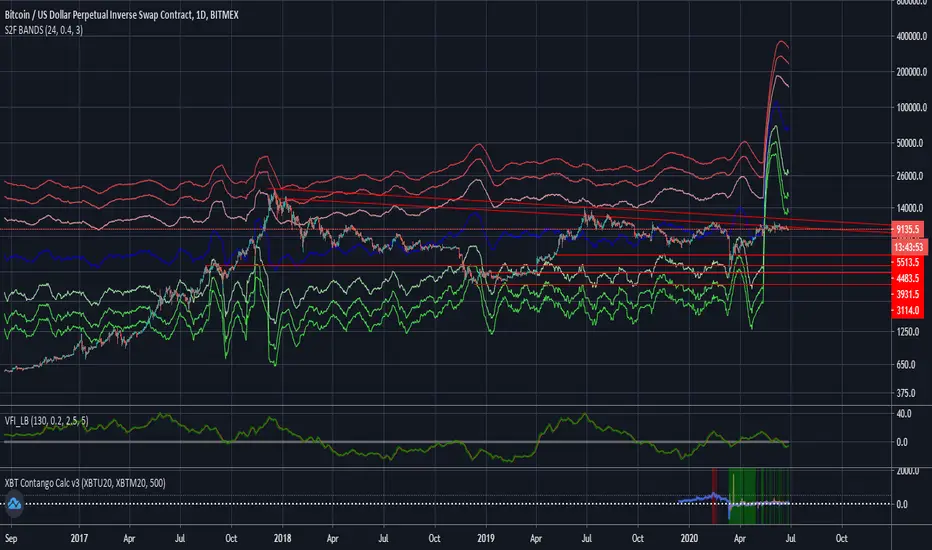
S2F Price LevelsThis is the indicator that plots Bitcoin's Stock to Flow model price and its significant levels.
Grey: S2F price
Green: S2F bottom (S2F multiple of 0.5)
Blue: S2F mode (S2F multiple of 0.67)
Red: S2F top

Bitcoin Stock To Flow Rainbow IndicatorHello everyone,
I have finished to create the Bitcoin stock to flow indicator, rainbow version.
It's a Bitcoin price prediction model.
What is Stock To Flow ?
Stock is the size of the existing stockpiles or reserves and flow is the yearly production.
The formula is : Stock divided by flow ( Stock_to_flow = STOCK / FLOW )
The supply of bitcoins is fixed in the source code.
What we know :
Blocks are created every 10 minutes ( average )
In 2009, 50 Bitcoins was created every 10 minutes , so 300 Bitcoins per hour, 7200 per day, 2628000 per year
The Halving happened each 210000 blocks , the average time between halving is around 1300-1400 days.
The mathematical formula that I used for the rainbow line is : exp(-1,84) * (Stock_to_flow ^ 3,36)
And the mathematical formula that I used for the " top price line " is : 1.2 * (Stock_to_flow ^ 3)
The rainbow line IS the prediction model .
We can observe that :
The price follow the rainbow line
After each halving, the price grow and touch few month after the rainbow line
When the price is between the rainbow line and the " top price line ", habitually, it's followed by a drop of the price below the rainbow line.
Special thanks to PlanB.

Bitcoin Stock to FlowModeling Bitcoin's Value With Scarcity
The Stock to Flow model for Bitcoin suggests that Bitcoin price is driven by scarcity over time.
Bitcoin is the first scarce digital object the world has ever seen. It is scarce like silver & gold, and can be sent over the internet, radio, satellite etc. Bitcoin includes a mathematical mechanism to restrict its supply over time making it more rare as time goes on. Digital Scarcity.
In 2017 BTC exceeded the market capitalization of Silver. After the next halving in 2024, Bitcoin will become the hardest asset the world has ever seen, rarer than Gold.
There is only enough Bitcoin in the world for each person to own .0023 BTC. Because of this, Bitcoin's value should continue to rise over time.
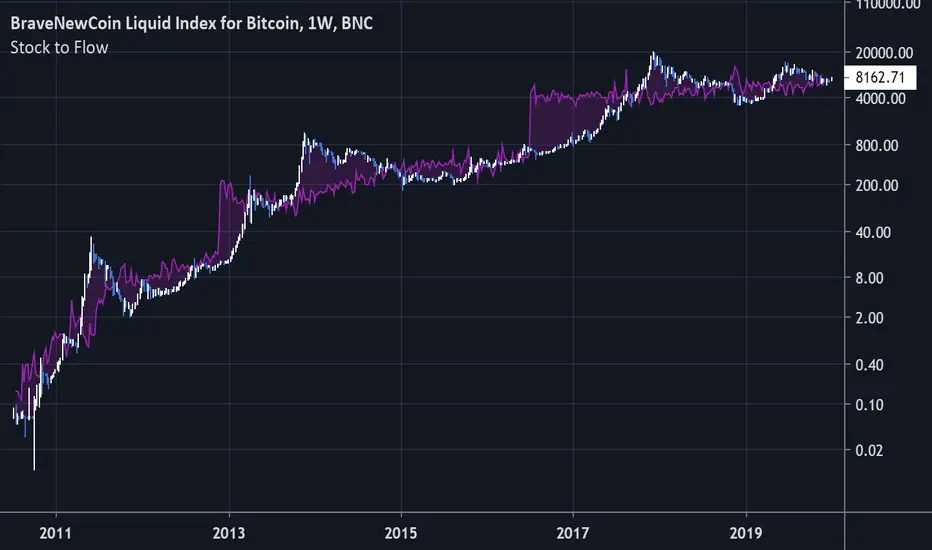
Stock/Flow ModelThe last script was blocked by the moderators of TradingView because it allegedly violates the rules, I publish a new version of the script without links to the authors and information about 'Stock-to-flow'.
In short: This blue line indicating what is the model price in USD (depends on the pair). The red and green dots are the daily data points. They show how far has the daily price deviated away from the stock to flow model's price.

Stock to Flow Model with Standard Deviation BandsThis Study takes the Stock to Flow Model for Bitcoin as presented by 100trillionUSD and smoothes it using an SMA. Then it calculates the close's standard deviation from it and displays the 2-Sigma Bands.
The stock to flow model seems to be one of the best predictions of Bitcoins price.
The standard deviation bands are supposed to show situations in which Bitcoin is significantly over- or under-bought.
A Simple Bitcoin Stock to Flow ModelThis is just a bit of fun. Stock to flow is a hot topic so I thought I'd mess around. Here is a model that is very closely based on the one available here: digitalik.net . I take no credit for the actual model.
It can be tuned with parameters a and b, but this is the best fit imo.
The model is a bit pointless as Tradingview doesn't let us run scripts on future candles, so no predictions.
The blue line is the actual model and the pink line is a 200 MA.
Run this script on the DAILY chart please ;)
Here's a close up of current action. Interesting maybe ;)

Bitcoin Stock To Flow Model Value (fixed)This indicator shows the Bitcoin value based on the Stock To Flow Model by planB
Fixed version of the original script by yomofoV:
Split up into 2 seperate indicators so you can put it into two seperate panes. This is the S2F Model Value.
You can find the S2F Multiple indicator here:
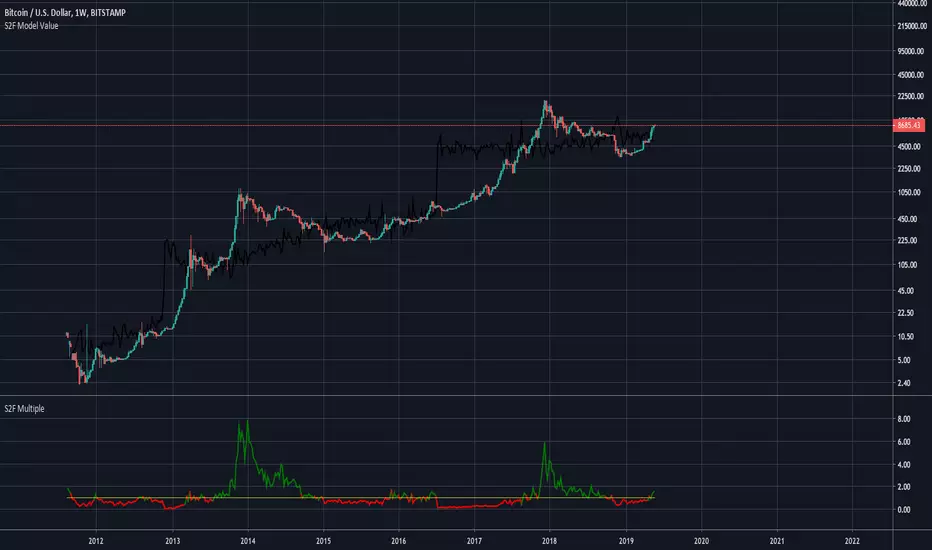
Bitcoin Stock to Flow Multiple (fixed)This is a fixed version of the original script by yomofoV:
I fixed the variable assignments and added switching of timeframes over indicator inputs.
To switch timeframes click on the indicator, open its settings and switch the timeframe to either monthly, weekly or daily.

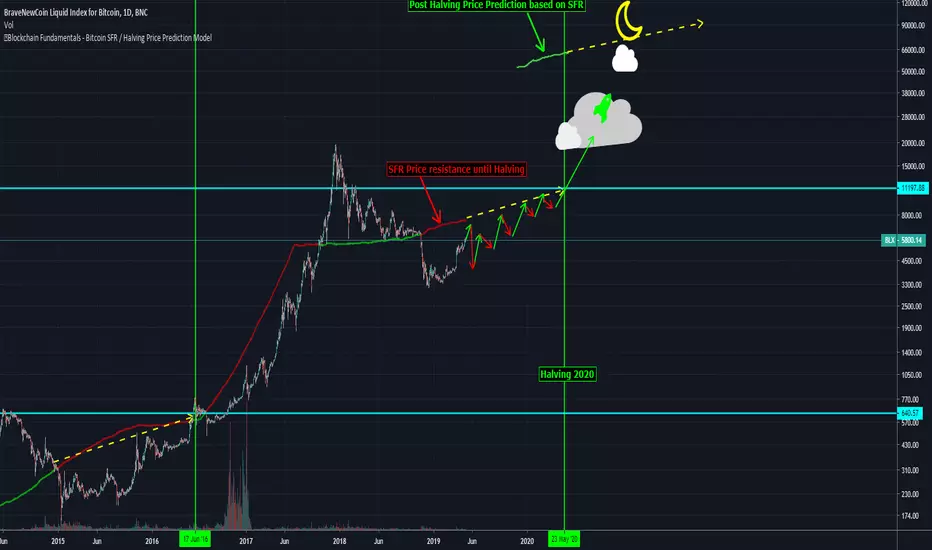
🔗Blockchain Fundamentals - Bitcoin Post Halving Price Model🔗Blockchain Fundamentals - Bitcoin SFR / Halving Price Prediction Model
Description
This price model is based upon the work of PlanB (@100trillionUSD) which can be seen here: medium.com
He states "We can also model bitcoin price directly with Stock to Flow. The formula of course has different parameters, but the result is the same, 95% R2 and a predicted bitcoin price of $55,000 with SF 50 after May 2020 halving."
He was using monthly data on a weekly timeframe. I converted to a daily timeframe, and add in future price prediction by projecting the average number of blocks mined. You can use this along with the Stock to Flow Ratio indicator here .
Post halving price prediction currently stands at ~$62k based on this model.
👍 Enjoying this indicator or find it useful? Please give me a like and follow! I post crypto analysis, price action strategies and free indicators regularly.
💬 Questions? Comments? Want to get access to an entire suite of proven trading indicators? Come visit us on telegram and chat, or just soak up some knowledge. We make timely posts about the market, news, and strategy everyday. Our community isn't open only to subscribers - everyone is welcome to join.
For Trialers & Chat: t.me
🔗Blockchain Fundamentals - Bitcoin's Stock to Flow Ratio🔗Blockchain Fundamentals - Bitcoin's Stock to Flow Ratio by Cryptorhythms
Intro
What is a stock to flow ratio and why is it important? The stock-to-flow ratio of a commodity is the amount of the asset that is held in reserves divided by the amount produced every year.
The higher the stock-to-flow ratio the reduced inflation occurs on the asset annually. Commodities with a higher stock-to-flow ratio are preferred for their scarcity.
How does it relate to Bitcoin?
Today, Bitcoin has a considerable lower stock-to-flow ratio than gold and this is where the opportunity presents itself. Bitcoin’s software has a core component cooked into the protocol in the form of an event called “the halvening”
‘The halving’ is an event that happens every 210,000 blocks or roughly every 4 years where the block reward given to the miners for securing the network gets halved. For example in 2009 the block reward was 50 BTC and today in 2019 it currently sits at 12.5 BTC with the ETA for next halving happening on Mon, 25 May 2020 which will take reward down to 6.25 BTC.
The idea that Bitcoin is the first ever truly verifiable, non-confiscatable fixed asset to exist is an extremely powerful concept. Without its strong and non-inflatable monetary policy Bitcoin would have a futile attempt of being able to disrupt gold and even accrue value in the first place.
Over the next several decades we will see Bitcoin’s stock-to-flow ratio increase significantly into never before seen water. No other asset will have anywhere near the scarcity of bitcoin.
With the incredible influx of talent coming into the industry to build out the infrastructure (custodial, ETF’s, futures) needed to allow legacy financial institutions to dip their toes in the soon smooth and regulated crypto asset waters. The next few years will be very interesting.
You might say "where will all this capital come from to propel bitcoin to new all time highs?"
1. Well asteroid mining is coming which could well eliminate golds scarcity. Your garden variety metallic asteroid could contain as much gold as half the gold humanity has ever mined!
2. Countries/economies with negative interest rate monetary policy and /or heavy quantitative easing. Their currency supply and debt just keep increasing...
3. Countries looking for ways around the USD dominated and US controlled financial systems (Iran, Russia, Venezuela, North Korea, etc)
4. There's tons more I just wanted to highlight a few.
Usage
You can compare Bitcoin with various other precious metals and commodities from the settings panel. I suggest a logarithmic scale for this indicator, other wise most assets are clumped at the bottom:
There's also plots for the forecasted (estimated) SFR ratios after the 2020 and 2024 Halvings.
👍 Enjoying this indicator or find it useful? Please give me a like and follow! I post crypto analysis, price action strategies and free indicators regularly.
💬 Questions? Comments? Want to get access to an entire suite of proven trading indicators? Come visit us on telegram and chat, or just soak up some knowledge. We make timely posts about the market, news, and strategy everyday. Our community isn't open only to subscribers - everyone is welcome to join.
For Trialers & Chat: t.me

Bitcoin Stock to Flow Multiplethis study plots the price of btc over the Stock to Flow Model value
idea credited to: 100trillionUSD
my data is a bit off compared to the original source but overall it seems correct
