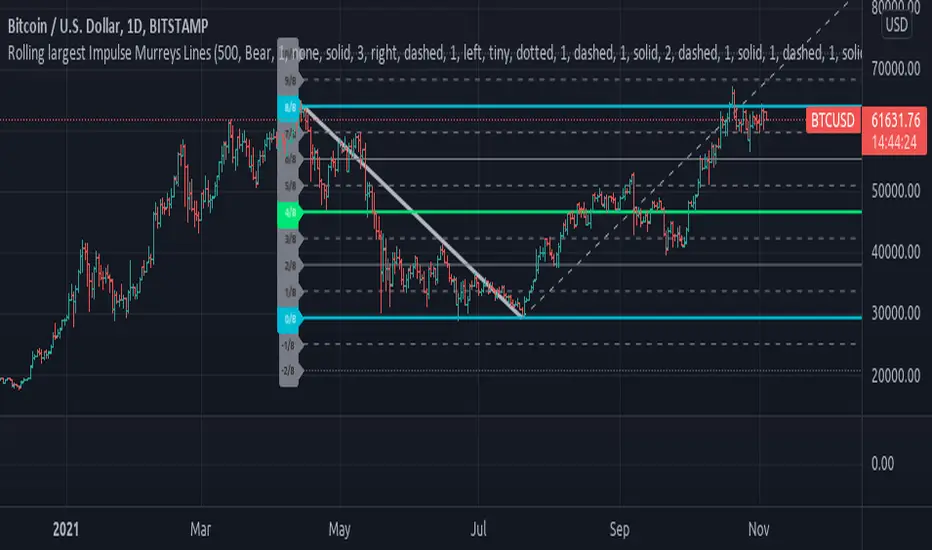
Rolling largest Impulse Murreys LinesExperimental:
Uses Kadane's max subarray sum algorithm to find the largest impulse within a window and draws Murrey's math lines based on that impulse.
Swing
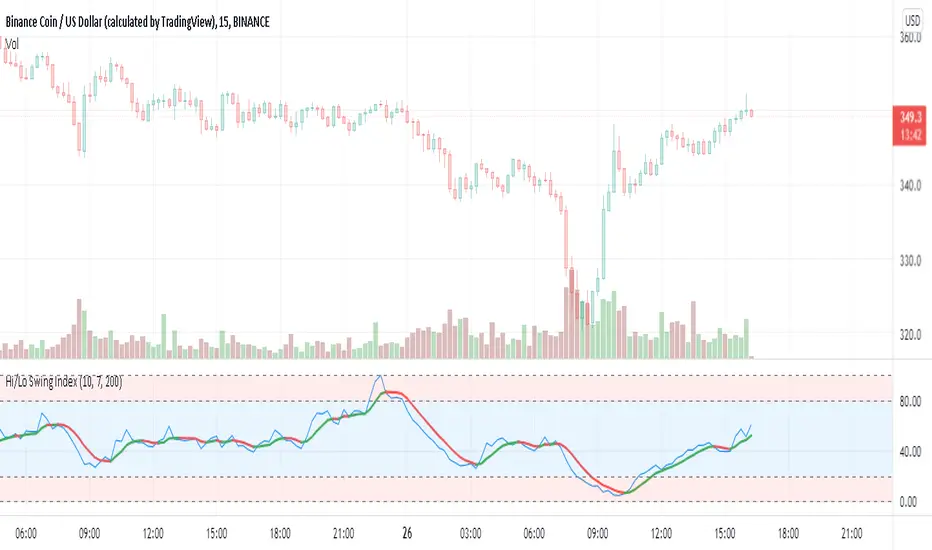
Hi/Lo Swing Index [by hajixde]Author: Hajixde
This indicator illustrates the High-to-Low variation. It works nicely on shorter time frames.
The index value is calculated based on the observation length (Memory Length). By changing this input, you can have a wider or shorter observation range.
MA Length is the moving average filter length, which smooths out the signal.
There is an additional smoothing function to make the output even smoother (Smoothing Length). Remember, that "Smoothing Length" is better to be less than "MA Length".
You may activate the trend direction.
Advanced OutSide with HMA and Klinger Forex Swing strategyThis is a swing forex strategy, adapted for big timeframes, such as 4h+.
For this example I adapted the strategy to EUR USD main forex pair.
Its components are:
Outside condition
Klinger Oscillator
Hull moving average
Rules for entry
For long: if current high is bigger than previous high and current is smaller than previous low and klinger is positive, close of the candle is above lsma and we have a bull candle.
For short: if current high is smaller than previous high and current is bigger than previous low and klinger is negative, close of the candle is below lsma and we have a bear candle.
Rules for exit
We exit when we have a reverse condition
We exit in case we hit the tp/sl based on % movement of the price.
If you have any questions, let me know !

Improved Bollinger Swing Strategy Stock NasdaqThis is an improved bollinger band strategy adapted to Nasdaq Index/Stocks.
The new update include a multiple logic calculation BB adapted for long and short, together with a risk management using movement in %.
Rules for entry
For long we have a crossover between the close and the lower band from the bb
For long we have a crossover between the close and the upper band from the bb
Rules for exit
We exit when we either find a reverse condition, or if we hit the take profit/stop loss levels.
If you have any questions, let me know !

Full Swing Gold Vwap Macd SMO StrategyThis is a full strategy designed for gold market using 12h timeframe chart.
Its components are:
VWAP monthly
SMO oscillator
MACD histogram
Rules for entry:
For long: when enter when close of the candle is above vwap monthly, current histogram is higher than the previous one and SMO oscillator is above 0
For long: when enter when close of the candle is below vwap monthly, current histogram is lower than the previous one and SMO oscillator is below 0
Rules for exit:
We exit the trade if we get a reverse condition.
We also exit the trade based on a risk management system, both for SL and TP using % movements.
If you have any questions let me know !

Crypto swing correlation RSI and SMAThis is a crypto swing strategy, designed for long term periods and correlated pairs with crypto market total(or other coins used as correlation, however I recommend total of crypto or btc)
Its components are:
RSI with a very length
Correlation candles
SMA 9
Rules for entry:
For long : RSI is above 51 level and going higher and close of the candle is above the SMA
For short :RSI is below 49 and going lower and close of the candle is below the SMA
Rules for exit:
We exit when we encountered an opposite condition than the entry one, or based on take profit/stop loss levels.
If you have any questions let me know !

Full Crypto Swing Strategy ALMA Cross with MACDThis is a full crypto swing strategy designed.
From my testing it looks like it perform the best on timeframes 4h +.
The below example has been adapted to BNB/USDT, using the entire period since 2017 until present day, with a comission of 0.03% ( which is the comission for the futures on binance).
Its components are :
ALMA Fast
ALMA Slow
MACD Histogram
Rules for entry
For long, we have a crossover of the fast alma with the slow one and the histogram is ascending.
For short, we have a crossunder of the fast alma with the slow one and the histogram is descending.
Rules for exit
We exit based on a risk management system for TP and SL, or when we receive an opposite condition than the initial one.
Regarding risk management
0.05 = 5% movement
2 = 200% movement
0.001 = 0.1% movement
If you have any questions, let me know !

DMI Swings (by Coinrule)The Directional Movement Index is a handy indicator that helps catch the direction in which the price of an asset is moving. It compares the prior highs and lows to draw three lines:
Positive directional line (+DI)
Negative directional line (-DI)
Average direction index (ADX)
DMI is simple to interpret. When +DI > - DI, it means the price is trending up. On the other hand, when -DI > +DI, the trend is weak or moving on the downside.
The ADX does not give an indication about the direction but about the strength of the trend.
Typically values of ADX above 25 mean that the trend is steeply moving up or down, based on the -DI and +D positioning. This script aims to capture swings in the DMI, and thus, in the trend of the asset, using a contrarian approach.
ENTRY
-DI is greater than +DI
ADX is greater than 45
EXIT
+DI is greater than -DI
ADX is greater than 45
Trading on high values of ADX, the strategy tries to spot extremely oversold and overbought conditions. Values of ADX above 45 may suggest that the trend has overextended and is may be about to reverse.
Our backtests suggest that this script performs well for very short-term scalping strategies on low time frames, such as the 1-minute.
The script considers a 0.1% trading fee to make results more realistic to those you can expect from live market conditions. So realistically, live results should be similar to backtested results.
You can plug this script directly into your crypto exchange using TradingView Signals on Coinrule.
Trade Safely!

High/Low Channel Multi averages Crypto Swing strategyThis is a swing strategy designed for trending markets such as crypto and stock, with big timeframes , like 8h.
For this strategy we take SMA, EMA, VWMA, ALMA, SMMA, LSMA and VWMA and make an apply them all to both HIGH and LOW separately and make 2 averages, 1 applied to high and the other applied to low.
With them we make a channel.
Rules for entry
For long: close of a candle is above avg applied to high.
For short: close of a candle is below avg applied to low.
Rules for exit
We exit when we either hit TP or SL or when we receive a different condition than the entry one.(long- > short and viceversa)
If you have any questions, let me know !

Aggresive Scalper/Swing Crypto StrategyThis is a simple yet very efficient scalper long strategy adapted for low timeframes for crypto. Can also be used with bigger timeframes as a swinger.
Its main components are:
Price oscillator swing
Vortex
Risk management for TP/SL
Rules for entry
We calculate the difference between the oscillator from the lowest low and the highest high. If the difference is positive, its a long potential. If its negative we exit from the long trade.
At the same time we check that the we have a crossover between the VIP vortex with the VIM vortex part.
Lastly we check that the current candle is bigger the second previous high.
Rules for exit
If we reach the take profit or the stop loss.
If we have a negative difference betwee LL and HH and VIP vortex crossunder with VIM vortex .
In this example I aimed for a 1:10 risk reward ratio, meaing that for every dollar lost, we will gain 10 when we win. Thus having a 10% minimum win rate will give us a profit over many trades.
If you have any questions, let me know !

Percentage Oscillator SwingThe percentage price oscillator (PPO) is a technical momentum indicator.
It shows the relationship between the close of a candle and the highest/lowest point with a specific lenght in percentage terms.
Rules
The higher percentage on the values upwards, compared to those downwards, the higher the power of the bull trend.
The higher percentage on the values downwards, compared to those upwards, the higher the power of the bear trend.

Extremely high win rate FOREX swing strategyTHis is a very simple yet extremely efficient FOREX strategy .
In general it tends to work the best against NZD and AUD pairs, however other major pairs and crosses can work as well.
It's made of a time management, together with MACD , moving average , a price action rule and a risk management.
THe logic behind is the next one :
For LONG:
We have 3 ascending candles.
Histogram of MACD is positive.
Last close of a candle is was above moving average.
If all those previous condition happened before 17/18 UTC time depending if its summer time or not, we enter the trade.
For Short:
We have 3 descending candles.
Histogram of MACD is negative.
Last close of a candle is was below moving average.
If all those previous condition happened before 17/18 UTC time depending if its summer time or not, we enter the trade.
RIsk management
For risk management, since we aim to have a 95%+ win rate, we aim to have a 5:1 or 10:1 risk to reward ratio. Meaning that for each $ we can win, we can lose 5-10$.
THats why I recommend to be extremely careful when playing with leverage with this strategy.

Vwap mtf Swing Stock StrategyThis is a trending strategy designed for stock market, especially long trending assets such as TSLA, NIO, AMAZON and so on.
Its made of volatility bands and weekly VWAP, in this case daily and weekly.
This strategy has been adapted to go long only.
Rules for entry
For long , we want to enter close of a candle is above vwap weekly, and at the same time the close of a candle cross-under the lower volatility band.
For exit , we want to enter close of a candle is below vwap weekly, and at the same time the close of a candle cross-over the upper volatility band.
This strategy does not have a risk management inside, so use it with caution.
If you have any questions, let me know !

3 RSI 6sma/ema ribbon crypto strategyThis is a very efficient swing trading strategy designed for crypto long timeframes like 2h+.
Initially we have 3 RSI .
AFter that we use them as source for 6 SMA/EMA for each RSI, 5, 30, 50, 70, 90, 100. With those we create a ribbon that we are going to use in order to check the direction of the trend.
Rules for entry:
For long : if either all the SMA/EMA's from the 2nd RSI are telling us to go long, or all the all SMA/EMA's from the 3rd rsi are telling us to go long F
For short : if either all the SMA/EMA's from the 2nd RSI are telling us to go short, or all the all SMA/EMA's from the 3rd rsi are telling us to go short
We exit when we get an opposite condition than the entry one.
Caution: this strategy has no risk management inside, so use it with caution. If you have any questions , let me know !

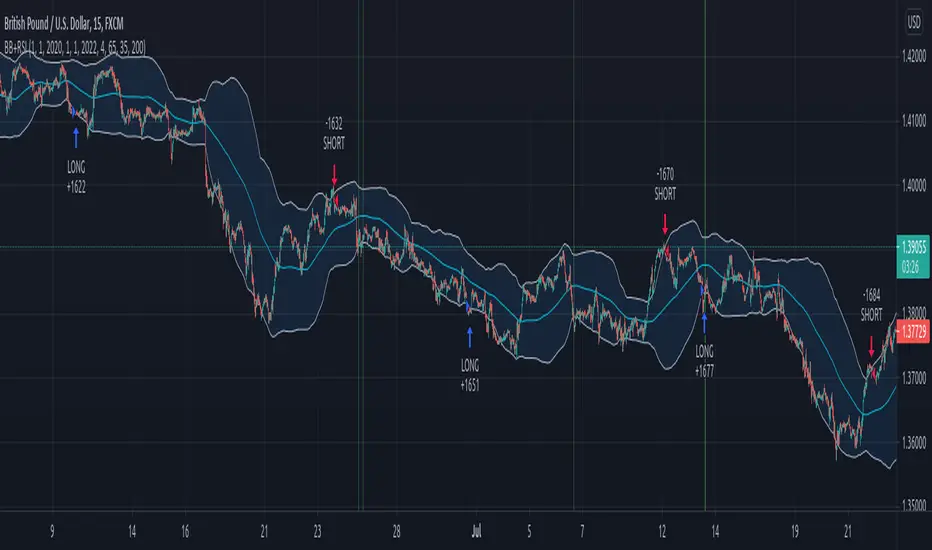
Swing forex strategy 15minThis is a strategy made using BB+ RSI indicators that seems to work great with 15 min major pairs for FOREX.
THe rules for it are simple:
For long we enter when the close of our candle crosses upwards the lower line and rsi crossover the over sold line
We exit long when we have a short entry.
For short we enter when the close of the candle crosses downwards the top line and rsi cross under the over bought line
WE exit short when we have a long entry.
Careful, this strategy has no risk management inside.
If you have any questions let me know !
Multi TimeFrame (MTF) Trend StrengthCalculate and display simple multi timeframe (3 timeframe) trend strength using heikin ashi.

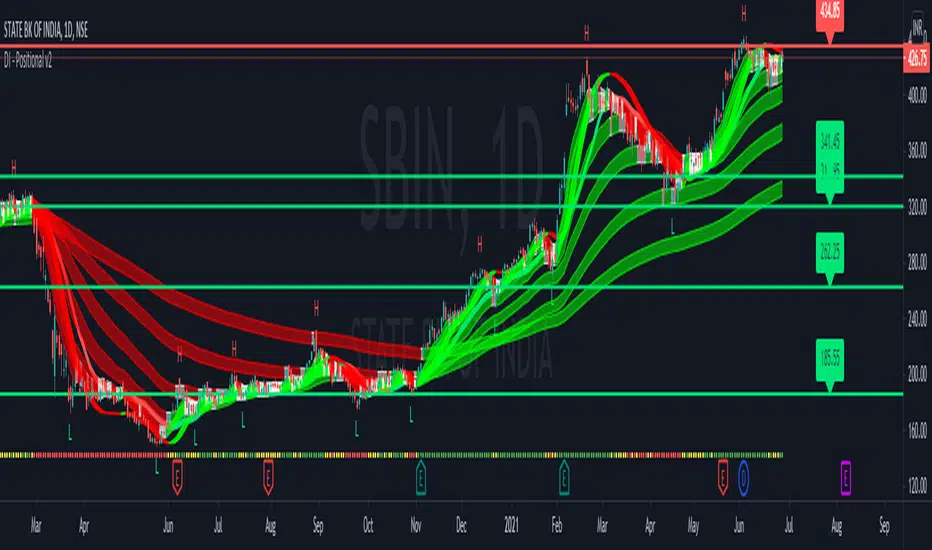
D Indicators - Positional tool*Presenting a perfect setup for Positional and Swing traders.
1) Slow and Fast Bands
# 3 fast and 3 slow, in total of 6 EMA bands are added to the indicator in order
to make accurate decisions and helping find out in which trend the price is.
Enter when price gives a breakout above or below all of the 6 bands.
2) Trend Indicators
# Total of 3 trend indicators are also included:
Trend Indicator 1 ---> It is a SMA(20) and its color changes based upon
Trend Indicator 2 ---> will be plotted at the bottom of the screen. Based upon RSI
Trend Indicator 3 ----> EHMA
Their color will be yellow whenever the market is sideways which will act
as a cautionary sign that in about next phase the price will be rangebound.
Use them as a helping hand, and check whether they show the same trend or not while you enter.
3) Support/Resistance lines
# On charts, this indicator is used to locate levels of support and resistance.
As a function, Targets and SL can be planned.
When a candle closes above the support/resistance line, the lines change
color automatically. It'll turn green.
If the price is below the sup, it will also change color to red.
4) High/Low
# Will mark the high/low of a particular swing so that, one can place the SL over there and enter.
Thank you and regards,
D Indicators
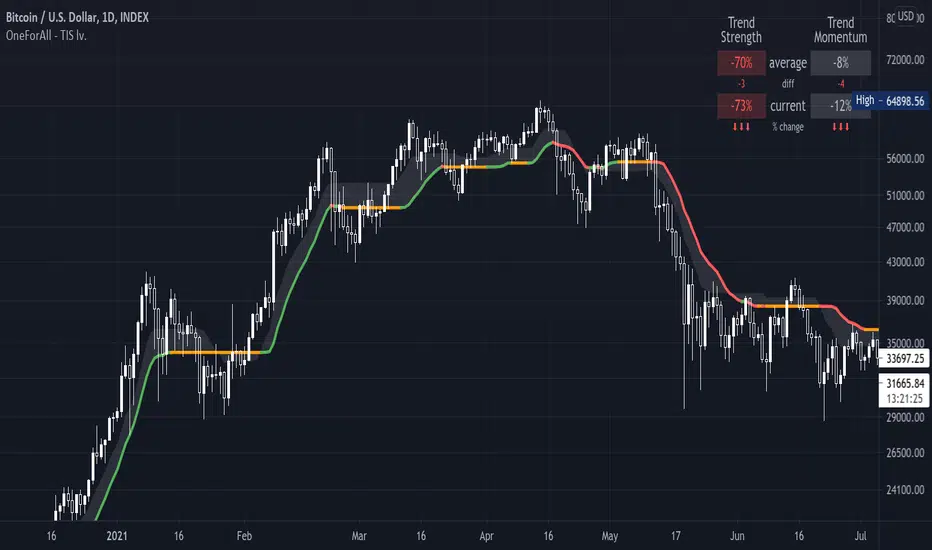
One For All - Trend Insight System (Light ver.)Introduction :
Compared to the TIS v1.0, this "light" version is simpler to use and to understand, hence it will suits the basic needs of traders and investors looking for a clear and user friendly indicator to assess the current trend situation for continuous markets. The settings allow an adaptation for call markets, but more backtesting needed at your discretion (see notes below on call markets).
The TIS takes price action, volume and volatility, to :
- provide a clear and easy to interpret global picture on the current trend siuations
- give hints for decent take profit and exit points
- help find support and resistance levels
- assess trend strength and momentum
Disclaimer :
The Trend Insight System (TIS) is among the most perfected trend following indicator. Built around the Verbatim (the main colored line), it is inspired by Tushar S. Chande's work on volatility, that I really enjoyed reworking in-depth and re-engineer from scratch, after some tweaks and managing to factor-in the volumes, the Verbatim was born.
The Verbatim is essentially a "smart" moving average that will adapt itself to the price action, the volatility and the volumes, in order to filter-out whipsaw price action and help the user clarify opportunities for trend trading. Since the various components of the TIS helps serve as Support & Resistance level (see examples below), it will also prove to be helpful for swing traders.
Please use with caution, proper risk management and along with your favorite oscillator, channels, candlestick reading and signals system (such as the Pattern Detection System that will be provided complimentary to the TIS, in a separate script).
Some explanation :
Verbatim line :
- Green shows a bullish trend, orange for consolidation and red for bearish trend
- When it consolidates, it can be extended to the right to be used as a Support & Resistance line
example use case :
In summary :
- A possible entry is when price action confirms over the consolidating (orange) Verbatim, or after the Verbatim turns green. Please note that they both can prove to be false trend start, so these signals are best used with other indicators for confirmation
- A possible exit point show up when the price action starts closing into the Verbatim, or even safer, when the price action confirms under the verbatim, again, to be used with other indicators on the side
Trend Strength and Momentum:
- Read the current status at a glance
- Trend strength is the relative position of each trend lines (most of which are hidden on this "light" version), from -100% (=bear power) to +100% (=bull power)
- Momentum is measuring the slope of the Verbatim (and another hidden "smart" trend line) also from -100% to +100%; trend lines pointing downwards = bears waking up / in force, horizontal = consolidation or upwards = bulls waking up/in force
Important notes :
While is a very powerful yet easy to read Technical Analysis tool, it has been fully optimized for continuous markets such as crypto.
It is highly advised to use the default settings provided as they have been backtested more thoroughly ("continuous market" and "close" input)
To prevent confusing casual users and to avoid overoptimization -risky at best and counter productive at worst, according to legendary traders such as Mark Douglas- this version has most of the customization settings locked out; volume integration, smoothing method used, smoothing constant, volatility setting, period of study. The settings left available are :
- continuous market / call market selection, selecting "continuous maket" will use a specifically designed method of calculation for volatility , based on ATR, while selecting "call market" will automatically use ATR for calculating the volatility , and
- input source selection for the volatility calculation, which only works for "continuous market".
The locked out settings might be included in the future in a more restricted yet complete "Expert mode" version.
End notes :
It will always be considered a work in progress to help bring out the best of trend analysis.
Suggestions are welcomed to make it a more user-friendly tool.
One For All - Trend Insight System v1.0Introduction :
The TIS takes price action, volume and volatility, to :
- provite a clear and easy to interpret global picture on the current trend siuations
- give hints for good take profit and exit points (see local consolidation line)
- help find support and resistance levels
- assess trend strength and momentum
Disclaimer :
The Trend Insight System (TIS) is among the most perfected trend following indicator. Built around the Verbatim (the main colored line), it is inspired by Tushar S. Chande's work on volatility, that I really enjoyed reworking in-depth and re-engineer from scratch, after some tweaks and managing to factor-in the volumes, the Verbatim was born.
The Verbatim is essentially a "smart" moving average that will adapt itself to the price action, the volatility and the volumes, in order to filter-out whipsaw price action and help the user clarify opportunities for trend trading. Since the various components of the TIS helps serve as Support & Resistance level (see examples below), it will also prove to be helpful for swing traders.
Please use with caution, proper risk management and along with your favorite oscillator, channels, candlestick reading and signals system (such as the Pattern Detection System that will be provided complimentary to the TIS, in a separate script).
Some explanation :
Verbatim line :
- Green is bullish trend, orange for consolidation and red for bearish trend
- When it consolidates, it and be extended to the right to be used as a Support & Resistance line
example use case :
Local consolidation line :
- A more optimal way to find an exit point when we have missed a top formation
example use case :
Verbatim channel :
- A way to visualize price disequilibrium
example use case:
Verbatim cloud:
- Stronger Support and Resistance levels
- Price disequilibrium
- Consolidation range (when Verbatim is inside the cloud and did not go through)
example use case:
Trend Strength and Momentum:
- Read the current status at a glance
- Trend strength is the relative position of each trend lines, from -100% (=bear power) to +100% (=bull power)
- Momentum is measuring their slope also from -100% to +100%; trend lines pointing downwards = bears waking up / in force, horizontal = consolidation or upwards = bulls waking up/in force
Important notes :
While is a very powerful yet easy to read Technical Analysis tool, it has been fully optimized for continuous markets such as crypto.
Each item of the Trend Insigth System can be disabled to suit your personal use. It is highly advised to use the default settings provided.
To prevent confusing casual users and to avoid overoptimization -risky at best and counter productive at worst, according to legendary traders such as Mark Douglas- this version has most of the customization settings locked out; volume integration, smoothing method used, smoothing constant, volatility setting, period of study. The settings left available are :
- continuous market / call market selection, selecting "continuous maket" will use a specifically designed method of calculation for volatility, based on ATR, while selecting "call market" will automatically use ATR for calculating the volatility, and
- input source selection for the volatility calculation, which only works for "continuous market".
The locked out settings might be included in the future in a more restricted yet complete "Expert mode" version.
End notes :
It will always be considered a work in progress to help bring out the best of trend analysis.
Suggestions are welcomed to make it a more user-friendly tool.

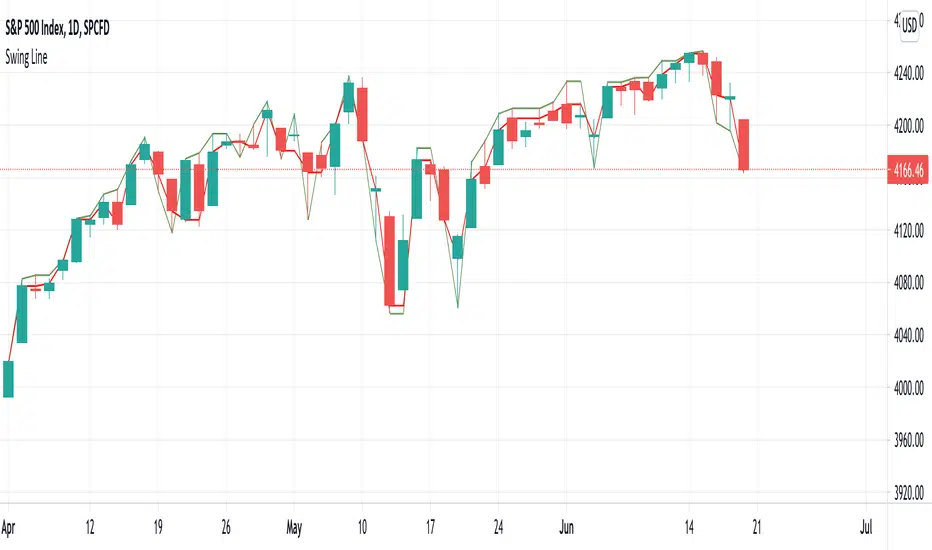
Swing LineThe author was inspired by Charles Dow's concept on trend and Gann's concept on swing trade.
Swing line can help identify resistance and support. Breaking resistance indicate an uptrend. Breaking support indicates a downtrend. This is a simple and intuitive method in trend determination.
However, many chart readers nowadays set Candlestick as preferred pattern. The shared indicator provides another choice for constructing swing lines.
Volatility OscillatorThis tool displays relative volatility and directional trend. Excellent way to pickup diversions and reversals. Length can be lowered to 11 or 13 in settings to show price range.
Can be used to identify patterns such as parallel channels and likely direction of price action as pictured below.

Swing Failure Pattern Inquisitor SFP Inquisitor
v0.2a
coded by Bogdan Vaida
Code for Swing High, Swing Low and Swing Failure Pattern.
Note that we're still in the alpha version, bugs may appear.
Note that the number you set in your Swing History variable
will also be the minimum delay you see until the apples appear.
This is because we're checking the forward "history" too.
The SFP will only check for these conditions:
- high above Swing History high and close below it
- low below Swing History high and close above it
In some cases you may see an apple before the SFP that "doesn't fit"
with the SFP conditions. That's because that apple was drawn later and
the SFP actually appeared because of the previous apple .
20 candles later.
Legend:
🍏 - swing high
🍎 - swing low
🧺 - candle where the last swing was driven from
🍌 - swing failure pattern
🍎🍌 - hungry scenario: swing low but also a SFP compared to the last swing

EMA+RSI Pump & Drop Swing Sniper (SL+TP) - StrategyThis is the strategy version of the 'EMA-RSI-Pump-Drop-Swing-Sniper-With-Alerts':
Some additions with this strategy:
~Added Stop loss & Take profit control. In Settings > Inputs if the Stop Loss is at .051 that means it's 5.1% and the Take Profit at .096 is 9.6%. If you wish to remove the TP and SL just change the value to 1.00 and it would be the same as it being 100% TP and SL which is likely to never be hit.
~Added Backtesting by changing the month/date/year in Settings > Inputs
~Added a 2nd EMA line to assist with the long entry signals. I only use this for long entry & exits, though you could use the long exits as Short entries too. I just personally don't do short trading on Bitcoin.
This is using an EMA and RSI with slightly modified settings to give good entry and exit points while looking at Bitcoin. I use this on a 1-hour and 4-hour chart and with other indicators to find good positions to enter a trade or exit if things are turning red.
It's important to know this strategy was made as a request by another user that was using the indicator version. I don't use this as a trading strategy by itself, I use the visuals it gives as a confirmation with other indicators to find the best possible entry and exit positions.
If you click on the EMA line it will color the bars of the chart based on if they are above or below the EMA - This is just visually helpful for me to see the active trend.
Make sure you hover over or click on the EMA line to see the colors of the candles change - it's not visible by default or without doing this.
