Symbol InfoFor those who likes clean chart:
Adjustable Symbol ticker and timeframe( AKA watermark) script is here.
1: You can place Symbol ticker and timeframe info anywhere on the chart.
Also you can hide one of them or both.
Position:
Horizontal options: Left Center Right
Vertical options: Top Middle Bottom
Size: Tiny Smal Normal Large Huge Auto
Color is adjustable. Background is optional too.
2: Even more cool part is you can add 2 different custom texts that can switch. (Idea from Pinecoders original script)
You don't have to use text function and reposition it everytime, your message will always stays at one place.
Let the chart deliver your message.
I put my favourite trading slangs there:
1. Do Your Own Research (DYOR)
2. Not a Financial Advice ( NFA)
Timeframe

All Indicators in one ( RSI - SMA - STOCH - MACD - ADX - MFI )This Indicator will improve your Chart reading as it display most of the common used Indicators in a table with colored Background changes depend on the status of the indicator .
What indicators does this script have ?
RSI Multi timeframes (Chart RSI - 15m - 1h - 4h )
SMA ( 5 - 10 - 20 - 50 )
Stochastic
MACD
ADX
MFI
all of the above indicators will show in a table , table cell will change in color ( green or red ) depend on the status of the indicators
Green and red table status :
For the RSI
If RSI is above RSI MA = Green which indicate - up trend
if not then its RED which indicate down trend
-----------
For SMA
if Price above SMA = Green which indicate - up trend
if not then its RED which indicate down trend
also SMA 50 when price is above it , it changes its color to green
if price is under SMA 50 , it will be red
-----------------------
For Stochastic :
if K > D and ks < 90 = Green which indicate - up trend
if not then its RED which indicate down trend
-----------------------
For MACD
if MACD is above signal and MACD is bigger than 0.000 = Green which indicate - up trend
if not then its RED which indicate down trend
-----------------------
For ADX
if ADX> 20 and plus > minus = Green which indicate - up trend
if not then its RED which indicate down trend
-----------------------
For MFi
if MFi > 75 = Overbought which indicate - a dump could happen
if MFi < 20= Oversold which indicate - a pump could happen
if MFI < 50 and > 20 = Bearish Range which indicate - price is going down
if MFI > 50 and < 75 = Bullish Range which indicate - price is going UP
also added a feature
whenever the price cross the 50 SMA
it will show you the lowest price from the 10 Previous candles , could be used as a stoploss
**
All settings can be adjusted to your needs

Mtf Supertrend Table
english
It is a study of how the supertrend indicator looks on multiple timeframes. You can see the Supertrend direction in Multiple Timeframes by looking at the chart
Türkçe
supertrend indikatörünün çoklu zaman dilimdlerinde nasıl göründüğü yönünde bir çalışmadır. Tabloya bakarak Çoklu Zaman dilimlerinde Supertrend yönünü görebilirsiniz

MTF EMA Ribbon & Bands + BBMulti Timeframe Exponential Moving Average Ribbon & Bands + Boillinger Bands
I used the script "EMA Ribbon - low clutter, configurable " by adam24x, I made some color change and I added a few indicators (Boillinger Bands, EMA on multi timeframe and EMA bands from "34 EMA Bands " by VishvaP).
The script can display various EMA from the chart's timeframe but also EMA from other timeframes.
Bollinger Bands and EMA bands can also be added to the chart.

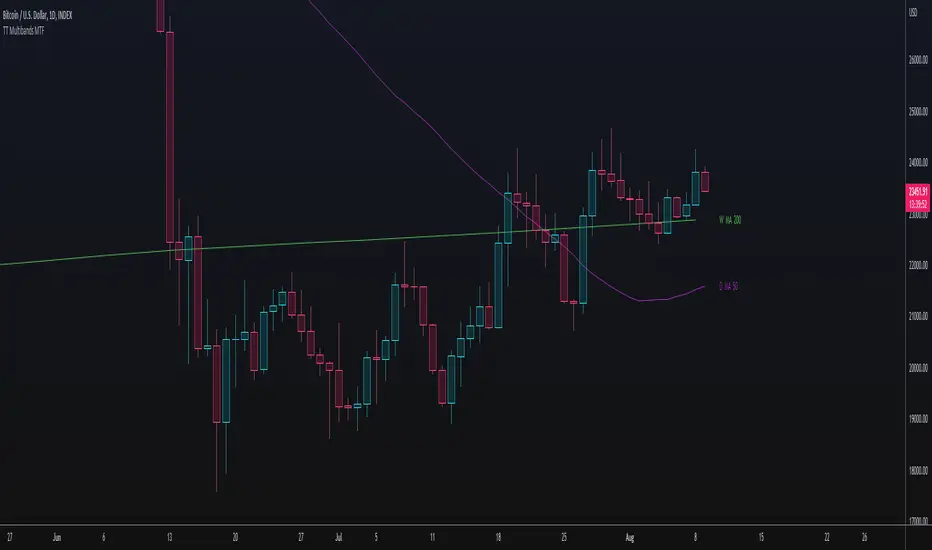
TT Multibands MTFThis Multi Moving Average Indicator is for a long list of Moving Averages:
- Simple Moving Average (SMA)
- Exponential Moving Average (EMA)
- Weighted Moving Average (WMA)
- Hull Moving Average (HMA)
- Double Exponential Moving Average (DEMA)
- Triple Exponential Moving Average (TEMA)
- Volume Weighted Moving Average (VWMA)
- Kaufman's Adaptive Moving Average (KAMA)
- Relative Moving Average (RMA)
- Arnaud Legoux’s Moving Average (ALMA)
Advantages:
- Auto Plotting the Lable: < TIMEFRAME + BAND TYPE + LENGTH >
- Multi TimeFrame (MTF)
- Usable with Custom Time Frames: You can choose any Time Frame out of your Custom Time Frame List
- "No Repainting"
- "No Gaps" on lower Chart Time Frames (HD, no "Stairs")
"No Repainting" and "No Gaps" TRUE
"No Gaps" FALSE
MTF VWAP & StDev BandsMulti Timeframe Volume Weighted Average Price with Standard Deviation Bands
I used the script "Koalafied VWAP D/W/M/Q/Y" by Koalafied_3 and made some changes, such as adding more standard deviation bands.
The script can display the daily, weekly, monthly, quarterly and yearly VWAP.
Standard deviation bands values can be changed (default values are 0.618, 1, 1.618, 2, 2.618, 3).
Also the previous standard deviation bands can be displayed.

Value At Risk Channel [AstrideUnicorn]The Value at Risk Channel (VaR Channel) is a trading indicator designed to help traders control the level of risk exposure in their positions. The user can select a time period and a probability value, and the indicator will plot the upper and lower limits that the price can reach during the selected time period with the given probability.
CONCEPTS
The indicator is based on the Value at Risk (VaR) calculation. VaR is an important metric in risk management that quantifies the degree of potential financial loss within a position, portfolio or company over a specific period of time. It is widely used by financial institutions like banks and investment companies to forecast the extent and likelihood of potential losses in their portfolios.
We use the so-called “historical method” to compute VaR. The algorithm looks at the history of past returns and creates a histogram that represents the statistical distribution of past returns. Assuming that the returns follow a normal distribution, one can assign a probability to each value of return. The probability of a specific return value is determined by the distribution percentile to which it belongs.
HOW TO USE
Let’s assume you want to plot the upper and lower limits that price will reach within 4 hours with 5% probability. To do this, go to the indicator Settings tab and set the Timeframe parameter to "4 hours'' and the Probability parameter to 5.0.
You can use the indicator to set your Stop-Loss at the price level where it will trigger with low probability. And what's more, you can measure and control the probability of triggering.
You can also see how likely it is that the price will reach your Take-Profit within a specific period of time. For example, you expect your target level to be reached within a week. To determine this probability, set the Timeframe parameter to "1 week" and adjust the Probability parameter so that the upper or lower limit of your VaR channel is close to your Take-Profit level. The resulting Probability parameter value will show the probability of reaching your target in the expected time.
The indicator can be a useful tool for measuring and managing risk, as well as for developing and fine-tuning trading strategies. If you find other uses for the indicator, feel free to share them in the comments!
SETTINGS
Timeframe - sets the time period, during which the price can reach the upper or lower bound of the VaR channel with the probability, set by the Probability parameter.
Probability - specifies the probability with which the price can reach the upper or lower bound of the VaR channel during the time period specified by the Timeframe parameter.
Window - specifies the length of history (number of historical bars) used for VaR calculation.

OHLC MTFThe script allows you to plot the opening, highest, lowest and closing (ohlc) values of a previous candle.
Settings :
- "Time Frame" : allows you to choose the reference time frame;
- "Offset" : sets which candle to select the data from.
Ex : If you select "1 day" as the time frame and "1" as the offset, the OHLC values of yesterday's daily candle will be displayed (regardless of your current time frame).

Impactful pattern and candles pattern AlertThe Alertion indicator!
impactful pattern:
pattern that happen near the zone or in the zone at lower timeframe and give us entry and stop limit price.
It is helpful for price action traders and those who want to decrease their risk.
There are 3 IP patterns:
Quasimodo
Head and shoulder
whipsaw engulfing
These patterns may occur near the zone or may not occur but by them, you can decrease your trading risk for example you can
trade with half lot before IP pattern and enter with other half after pattern.
how to use?
for example:
you find zone at 1h timeframe for short position
when price enter to your zone
you run this indicator and choose your lower timeframe, for example 15m and click on short position.
Then make the alert by right-click on your chart and choose the add alert and at condition box choose the impactful pattern and then click on create
now wait for message :)
Candles pattern:
like reversal bar, key reversal bar, exhaustion bar, pin bar, two-bar reversal, tree-bar reversal, inside bar, outside bar
these occur when the trend turn, so it is usable when the price enter to your zone or near your zone.
This pattern can decrease your risk.
Inside bar and outside bar:
if this pattern engulf up, it is bullish pattern and if engulf down, it is bearish pattern.
what does this indicator do?
this indicator is for making alert
it helps you to decrease your risk and failure.
You optimize it to alert you when IP pattern happen or candle pattern happen or inside bar or outside bar engulfing or all of them.
For IP pattern, it will message you entry and stop limit price.
It works at 2 different timeframes, so you can make alert for example in 1h TF for candles pattern and 15m TF for IP pattern.
Indicator will alert you for candles pattern at your chart timeframe and for IP pattern at timeframe you've chosen when you run the indicator, and it is changeable
in setting.
setting options
TIMEFRAME
IP: select the timeframe for IP patterns it means when IP pattern happen at that timeframe the indicator will alert you
example = your TF is 1h, you found the supply zone and want to trade, note that IP pattern happen in lower TF, so you select 15m TF or TF lower than 1h.
Short position: select it if you want to make short position.
BUFFERING
indicator send you entry and stop limit price
you can change it by amount of percent
it is your strategy to change your entry and stop loss or not
example= in head and shoulder pattern at short position, the stop limit is high price of head in pattern
so the indicator will message you the exact price but if you want to put
your stop limit 5 percent upper than exact price you can enter 5 in front of stop loss
or you want to enter 5 percent lower than exact high price of shoulder, you can optimize it.
ALERTION
you choose what alert you want
IP alert or candle alert or inside and outside bar alert
type your text for alert
you can write additional text for your message
ADVANCE
IP alert frequency option:
1. Once per bar : indicator will alert you for IP pattern once at your chat timeframe bar, and you should wait til next bar for next alert.
2. Once per bar close : alert you when your chart timeframe bar closed and next alert will happen when next bar is closed.
3. All: alert you all the times IP pattern happen
pivot left and right bars: lower will find smaller pattern
at the END:
this indicator is not strategy
it is part of your strategy that help you to increase your winning rate.
It is helpful for scalping and candle patterns finding.
After you make an alert, you can delete the indicator or change your timeframe or make another alert, your previous alert won’t change.
Thank you all.

Gann Box by time frame
█ OVERVIEW
This script is designed to plot Gann boxes within a specific time frame candle. That means, you can get your intraday Gann box with one click and zoom in to low time frame. Highs and lows are set by candle chosen, you can display the yearly Gann box if that's something you want to view!
In addition, this script can highlight the golden ratio and its inverse ( .618 & .382 ) within the box itself. You have the option to select between a daily, a weekly, or a monthly candle. Not to mention that you have the ability to select a multiplier to those candles, where for example, you would be able to plot the 3 month ( quarterly ) gann box. or the yearly by selecting 12 months! This script includes zero, one and two divisions to Gann box. The first division would get you the sun lines only. while the first division has the middle 0.5 point and so on. This script is meant to be used as a one-click fast solution. Highs and lows get adjusted as the chart breaks those levels automatically.
█ Future Plans and upgrades to this script may include :
1. Adding more divisions.
2. Data box that shows box stats and performance.
3. More geometrical features such as the spirals and the circles on demand by one click.
and more! feel free to let me know what you'd like to see!
█ How to use :
1. Put the script on your chart
2. Navigate to the settings
3. Select your box's time frame.
give the script a few seconds and you should be set.
This script is coded as an addon to the Gann ToolBox package/scripts.

Multiple Moving Avg MTF TableThis script replaces the other script that was just the SMAs that where in a Multi Time Frame Table as this was a redo of that one and this one is SO MUCH MORE!!!!
Not only does this one do the Simple Moving Avg 5, 10, 20, 50, 120, 200 into a table that shows Current/Hourly/Daily/Weekly/Monthly/Quarterly ( 3M )/ Yearly. It now does Exponential Moving Avg , Weighted Moving Avg , and Volume Weight Moving Avg along with Simple Moving Avg.
I still use this script so that you can quickly capture the values so that short-term, and long-term resistance and support can be determined during market hours. Even better now you can select between SMA / EMA / WMA /or VWMA .
imgur.com
The table will change to the values based on the Choice of the type of Moving Avg and if you change the default values.
Now it will take a little bit for the table to show up, so please be patient. I have tested it with stocks, forex, and crypto.

RMI TFM:Chart + 3D + 1W + 1M This indicator defaults to;
Period: 20
Look Back For Momentum :5
OverBought: 80
OverSold :20
of a Relative Momentum Index indicator;
1- RMI value according to the candle duration selected in the chart, (black)
2- RMI value according to pure 3D candles with the security() function, (blue)
3- With the security() function, the RMI value according to pure 1W candles, (orange)
4- With the security() function, the RMI value (Gray) according to 1M candles shows.
It also calculates RMI according to the price value you enter manually and shows or hides it according to your preference.

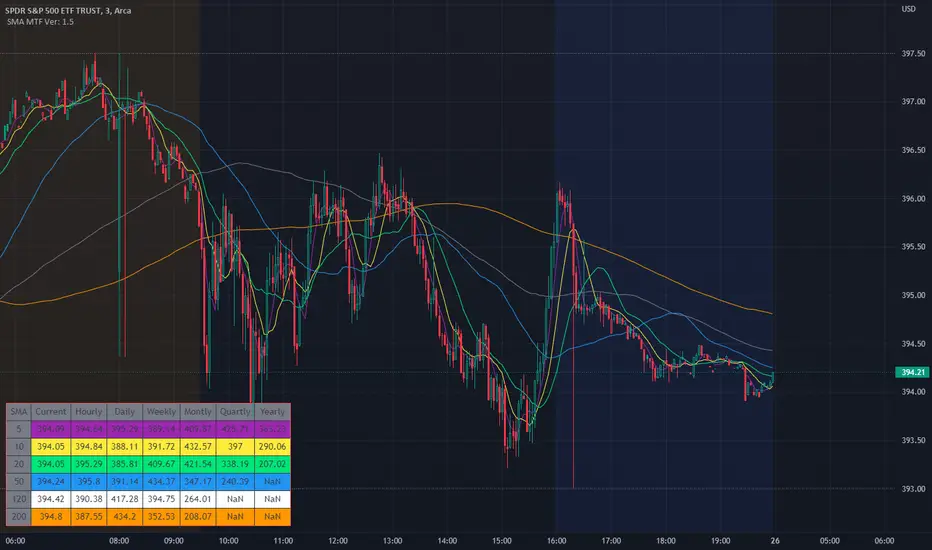
SMA Multi Time Frame Table V1.5Since I couldn't find a script like this I made one so here is what it does.
The script will plot on the chart as well as post the related data into the table.
The default Simple Moving Avg are 5, 10, 20, 50, 120, 200 which can also be changed to whatever SMA you would like. The SMA values are then plotted on the charts so that quickly check to see where they are and how the candles are reacting to the SMAs.
Not only does the script plot the SMAs but it also places higher time frames into the table that is in the script, from current price, to daily, weekly, monthly, quarterly (3 months if you don't have it added) and yearly. The reason why was it price action of the stock does interact and can be rejected or find support from SMA on a higher time frames.
I still use this script so that you can quickly capture the values so that short-term, and long-term resistance and support can be determined during market hours.
Another good thing is that when you change the values in the script settings it also applies those settings to the table as well.
Now it will take a little bit for the table to show up, so please be patient. I have tested it with stocks, forex, and crypto.
I wanted to get this published and I am still working on the background to try and get EMAs. Where you can flip over to EMA to also see the EMA plots and table values for the MTF.
+ Multi-timeframe Multiple Moving Average LinesThis is a pretty simple script that plots lines for various moving averages (what I think are the most commonly used across all markets) of varying lengths of timeframes of the user's choosing. Timeframes range from 5 minutes up to one month, so regardless if you're a scalper or a swing trader there should be something here for you.
There are 8 lines (that can be turned on/off individually), which may seem like a lot, but if you use two averages and want to display four different timeframes for each, you can do that. The nice thing is that because the lines start plotting from the current bar they won't clutter up the screen. And obviously having moving averages from different timeframes on your chart makes price action more difficult to read (I mean sure, you can make them invisible, but who wants to do that all the time).
For each line there are two labels. One with the moving average type, and the other with its specific timeframe. I can't include the moving average length because it's not a string input. If anyone has a workaround for this, let me know, otherwise I would simply recommend setting different colors depending on the length, or if you only use one or two lengths and one or two moving averages this shouldn't be an issue. I had to use two labels because for the label text I couldn't include more than one string input, this is why there is an input for the 'moving average type label distance.'' You will want to adjust this depending on if you are trading crypto, futures, or forex because in some cases there may still be label overlap.
Pretty much everything else is self-explanatory.
I've added alerts. I might need to modify them if I can, because it would be nice for them to state the name and timeframe of the moving average. But I think this will do for now.
Enjoy!

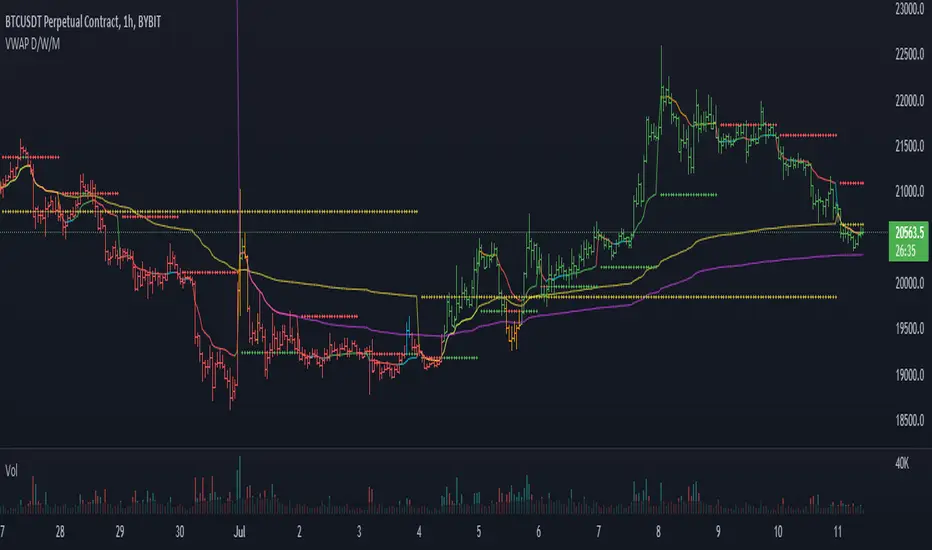
VWAP and previous VWAP for Support & Resistance for D W MI overhauled my old multi timeframe VWAP script to make the VWAP OC-Check work for all timeframes. Now only one function is used to calculate the 3 preset VWAPs.
Previous VWAPS = the price where the last session closed sometimes work as Support and Resistance.
The OC-Check Mode theory examines if the VWAP from the Open is above or below the VWAP from Close
and if price is above or below normal VWAP (HLC3).
This way we have 4 states:
Red = Strong Downtrend
Orange = Weak Downtrend
Blue = Weak Uptrend
Green = Strong Uptrend
As always it is just a theory - nothing is set in stone regarding any indicator.
Magnifying Glass (LTF Candles) by SiddWolf█ OVERVIEW
This indicator displays The Lower TimeFrame Candles in current chart, Like Zooming in on the Candle to see it's Lower TimeFrame Structure. It plots intrabar OHLC data inside a Label along with the volume structure of LTF candle in an eloquent format.
█ QUICK GUIDE
Just apply it to the chart, Hover the mouse on the Label and ta-da you have a Lower Timeframe OHLC candles on your screen. Move the indicator to the top and shrink it all the way up, because all the useful data is inside the label.
Inside the label: The OHLC ltf candles are pretty straightforward. Volume strength of ltf candles is shown at bottom and Volume Profile on the left. Read the Details below for more information.
In the settings, you will find the option to change the UI and can play around with Lower TimeFrame Settings.
█ DETAILS
First of all, I would like to thank the @TradingView team for providing the function to get access to the lower timeframe data. It is because of them that this magical indicator came into existence.
Magnifying Glass indicator displays a Candle's Lower TimeFrame data in Higher timeframe chart. It displays the LTF candles inside a label. It also shows the Volume structure of the lower timeframe candles. Range percentage shown at the bottom is the percentage change between high and low of the current timeframe candle. LTF candle's timeframe is also shown at the bottom on the label.
This indicator is gonna be most useful to the price action traders, which is like every profitable trader.
How this indicator works:
I didn't find any better way to display ltf candles other than labels. Labels are not build for such a complex behaviour, it's a workaround to display this important information.
It gets the lower timeframe information of the candle and uses emojis to display information. The area that is shown, is the range of the current timeframe candle. Range is a difference between high and low of the candle. Range percentage is also shown at the bottom in the label.
I've divided the range area into 20 parts because there are limitation to display data in the labels. Then the code checks out, in what area does the ltf candle body or wick lies, then displays the information using emojis.
The code uses matrix elements for each block and relies heavily on string manipulation. But what I've found most difficult, is managing to fit everything correctly and beautifully so that the view doesn't break.
Volume Structure:
Strength of the Lower TimeFrame Candles is shown at the bottom inside the label. The Higher Volume is shown with the dark shade color and Lower Volume is shown with the light shade. The volume of candles are also ranked, with 1 being the highest volume, so you can see which candle have the maximum to minimum volume. This is pretty important to make a price action analysis of the lower timeframe candles.
Inside the label on the left side you will see the volume profile. As the volume on the bottom shows the strength of each ltf candles, Volume profile on the left shows strength in a particular zone. The Darker the color, the higher the volume in the zone. The Highest volume on the left represents Point of Control (Volume Profile POC) of the candle.
Lower TimeFrame Settings:
There is a limitation for the lowest timeframe you can show for a chart, because there is only so much data you can fit inside a label. A label can show upto 20 blocks of emojis (candle blocks) per row. Magnifying Glass utilizes this behaviour of labels. 16 blocks are used to display ltf candles, 1 for volume profile and two for Open and Close Highlighter.
So for any chart timeframe, ltf candles can be 16th part of htf candle. So 4 hours chart can show as low as 15 minutes of ltf data. I didn't provide the open settings for changing the lower timeframe, as it would give errors in a lot of ways. You can change the timeframe for each chart time from the settings provided.
Limitations:
Like I mentioned earlier, this indicator is a workaround to display ltf candles inside a label. This indicator does not work well on smaller screens. So if you are not able to see the label, zoom out on your browser a bit. Move the indicator to either top or bottom of all indicators and shrink it's space because all details are inside the label.
█ How I use MAGNIFYING GLASS:
This indicator provides you an edge, on top of your existing trading strategy. How you use Magnifying Glass is entirely dependent on your strategy.
I use this indicator to get a broad picture, before getting into a trade. For example I see a Doji or Engulfing or any other famous candlestick pattern on important levels, I hover the mouse on Magnifying Glass, to look for the price action the ltf candles have been through, to make that pattern. I also use it with my "Wick Pressure" indicator, to check price action at wick zones. Whenever I see price touching important supply and demand zones, I check last few candles to read chart like a beautiful price action story.
Also volume is pretty important too. This is what makes Magnifying Glass even better than actual lower timeframe candles. The increasing volume along with up/down trend price shows upward/downward momentum. The sudden burst (peak) in the volume suggests volume climax.
Volume profile on the left can be interpreted as the strength/weakness zones inside a candle. The low volume in a price zone suggests weakness and High volume suggests strength. The Highest volume on the left act as POC for that candle.
Before making any trade, I read the structure of last three or four candles to get the complete price action picture.
█ Conclusion
Magnifying Glass is a well crafted indicator that can be used to track lower timeframe price action. This indicator gives you an edge with the Multi Timeframe Analysis, which I believe is the most important aspect of profitable trading.
~ @SiddWolf

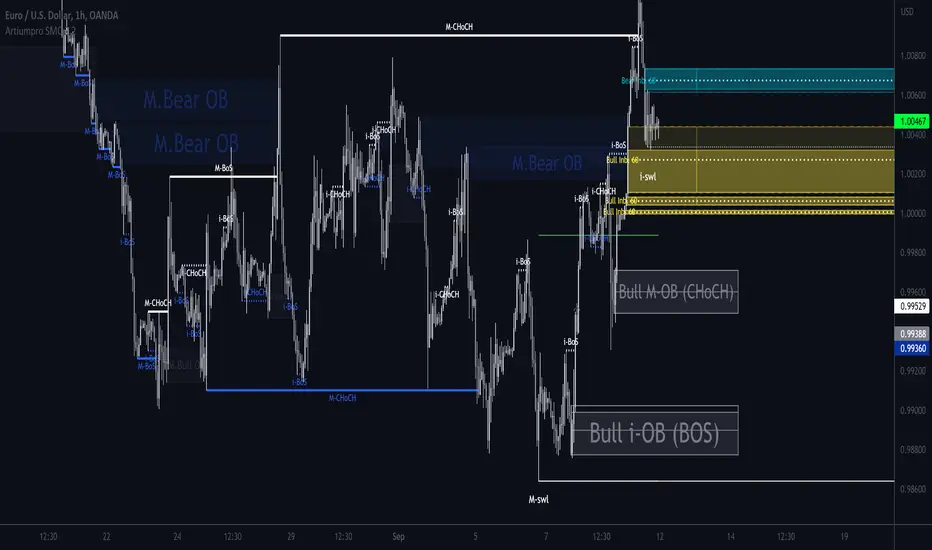
ArtiumPro Smart Money ConceptsSmart money concepts refer to the use of institutional trading strategies which align with the perspectives of Smart Money in the market. i.e. the composite man. Market Structure is the foundation of price action trading, understanding price action is fundamental to SMC.
ArtiumPro SMC 2.1 is an SMC (Smart Money Concepts) indicator full of features to aid SMC traders. Our aim is to save you time with automatic chart mark-up and help you spot areas of interest you may miss with the naked eye.
Fvg (Fair Value Gap) - is also known as an imbalance. An FVG is an imbalance of orders, for instance, for sellers to complete their trades, there must be buyers and vice versa so when a market receives too many of one kind of order buys or sells, and not enough of the order's counterpart. When the amount is not balanced and too many orders are put in for one direction, it creates an imbalance.
Multi timeframe FVG - this will show the same as above but on the higher timeframe you choose. It’ll show as 2 lines that show the higher timeframe fvg with a filled box that mitigates on entry.
Order Blocks - These are supply and demand zones, displayed typically as the last down/up candle before a move in the opposite direction. Great POI’s for entry and take profits.
Outside candle - this is a candle that sweeps the highs and lows of the previous candle, best used for the 1 hour or above these can indicate a change of price direction.
Previous day high & low
Not only does it show your previous day's low and high but it also shows your opening and close of the day. You have settings where you can turn off the open and close and just have daily highs and lows. It’s your choice within your settings.
Market Structure - We have packed this feature with options that are customizable for you,
Break of Structure (BOS) indicates a trend continuation.
Change of Character (CHoCH) indicates the first sign of a possible trend change.
Equal Highs/lows - this will mark your double/triple tops and bottoms.
Retracement - set this to your preferred retracement amount to customize your market structure to what you qualify as a valid pullback.
Elliott Wave ZigZag
Many people ask for the Elliott Waves. Well, here it is, inside this SMC. Just like your pivot highs and lows, the Elliott Wave is showing in real-time so you can see where your previous highs and lows are with the Elliott Wave break of structures that you can use in conjunction with the Smart Money Concepts Indicator of ArtiumPro.
Fib levels - for Premium & Discount areas - in this Instance the fib is used to determine if the price has pulled back into a premium or discount zone for optimal trade entry.
Trading Sessions
One of the most advanced trading session indicators out there and it’s included inside the most advanced SMC indicator on the market today. It has open breakout and settings to filter the opening range along with your pip daily range. You can select what timezone you are in and it automatically adjusts on the chart. Cool right? Hope you enjoy it, happy trading!
MPF EMA Cross Strategy (8~13~21) by Market Pip FactoryThis script is for a complete strategy to win maximum profit on trades whilst keeping losses at a minimum, using sound risk management at no greater than 1.5%
The 3x EMA Strategy uses the following parameters for trade activation and closure.
1/ Daily Time Frame for trend confirmation
2/ 4 Hourly Time Frame for trend confirmation
3/ 1 Hourly Time Frame for trend confirmation AND trade execution
4/ 3x EMAs (Exponential Moving Averages)
* EMA#1 = 8 EMA (Red Color)
* EMA#2 = 13 EMA (Blue Color)
* EMA#3 = 21 EMA (Orange Color)
5/ Fanning of all 3x EMAs and CrossOver/CrossUnder for Trend Confirmation
6/ Price Action touching an 8 EMA for trade activation
7/ Price Action touching a 21 EMA for trade cancellation BEFORE activation
* For LONG trades: 8 EMA would be ABOVE 21 EMA
* For SHORT trades: 8 EMA would be BELOW 21 EMA
* For trade Cancellation, price action would touch the 21 EMA before trade is activated
* For trade Entry, price action would touch 8 EMA
Once trigger parameter is identified, entry is found by:
a) Price action touches 8 EMA (Candle must Close for confirmed Trade preparation)
b) Trade preparation can be cancelled before trade is activated if price action touches 21 EMA
c) Trailing Stop Loss can be used (optional) by counting back 5 candles from current candle
CLOSURE of a Trade is identified by:
e) 8 EMA crossing the 21 EMA, then close trade, no matter LONG or SHORT
f) Trail Stop Loss
IMPORTANT:
g) No more than ONE activated trade per EMA crossover
h) No more than ONE active trade per pair
NOTE: This strategy is to be used in conjunction with Cipher Twister (my other indicator) to reduce trades on
sideways price action and market trends for super high win ratio.
NOTE: Enabling of LONGs and SHORTs Via Cipher Twister is done by using the previous
green or red dot made. Additionally, when the trend changes, so do the dot's validity based
on being above or below the 0 centerline.
----------------------------
Strategy and Bot Logic
----------------------------
.....::: FOR SHORT TRADES ONLY :::.....
The Robot must use the following logic to enable and activate the SHORT trades:
Parameters:
$(crossunder)=8EMA,21EMA=Bearish $(crossover)=8EMA,21EMA=Bullish $entry=SELL STOP ORDER (Short)
$EMA#1 = 8 EMA (Red Color) $EMA#2 = 13 EMA (Blue Color) $EMA#3 = 21 EMA (Orange Color)
Strategy Logic:
1/ Check Daily Time Frame for trend confirmation if:
(look back up to 50 candles - find last cross of EMAs)
$(chart)=daily and trend=$(crossunder) then goto 2/ *Means: crossunder = ema21 > ema8
$(chart)=daily and trend=$(crossover) then stop (No trades) *Means: crossover = ema8 > ema21
NOTE: This function is switchable. 0=off and 1=on(active). Default = 1 (on)
2/ Check 4 Hourly Time Frame for trend confirmation if:
(look back up to 50 candles - find last cross of EMAs)
$(chart)=4H and trend=$(crossunder) then goto 3/ *Means: crossunder = ema21 > ema8
$(chart)=4H and trend=$(crossover) then stop (No trades) *Means: crossover = ema8 > ema21
NOTE: This function is switchable. 0=off and 1=on(active). Default = 1 (on)
3/ 1 Hourly Time Frame for trend confirmation AND trade execution if:
(look back up to 50 candles - find last cross of EMAs)
$(chart)=1H and trend=$(crossunder) then goto 4/ *Means: crossunder = ema21 > ema8
$(chart)=1H and trend=$(crossover) then stop (No trades) *Means: crossover = ema8 > ema21
4/ Trade preparation:
* if Next (subsequent) candle touches 8EMA, then set STOP LOSS and ENTRY
* $stoploss=3 pips ABOVE current candle HIGH
* $entry=3 pips BELOW current candle LOW
5/ Trade waiting (ONLY BEFORE entry is hit and trade activated):
* if price action touches 21 EMA then cancel trade and goto 1/
Note: Once trade is active this function does not apply !
6/ Trade Activation:
* if price activates/hits ENTRY price, then bot activates trade SHORTs market
7/ Optional Trailing stop:
* if active, then trailing stop 3 pips ABOVE previous HIGH of previous 5th candle
or * Move Stop Loss to Break Even after $X number of pips
NOTE: This means count back and apply accordingly to the 5th previous candle from current candle.
NOTE: This function is switchable. 0=off and 1=on(active). Default = 0 (off)
8/ Trade Close ~ Take Profit:
* Only TP when
$(chart)=1H and trend=$(crossover) then close trade ~ Or obviously if Stop Loss is hit if 7/ is activated.
----------END FOR SHORT TRADES LOGIC----------
.....::: FOR LONG TRADES ONLY :::.....
The Robot must use the following logic to enable and activate the LONG trades:
Parameters:
$(crossunder)=8EMA,21EMA=Bearish $(crossover)=8EMA,21EMA=Bullish $entry=BUY STOP ORDER (Long)
$EMA#1 = 8 EMA (Red Color) $EMA#2 = 13 EMA (Blue Color) $EMA#3 = 21 EMA (Orange Color)
Strategy Logic:
1/ Check Daily Time Frame for trend confirmation if:
(look back up to 50 candles - find last cross of EMAs)
$(chart)=daily and trend=$(crossover) then goto 2/ *Means: crossover = ema8 > ema21
$(chart)=daily and trend=$(crossunder) then stop (No trades) *Means: crossunder = ema21 > ema8
NOTE: This function is switchable. 0=off and 1=on(active). Default = 1 (on)
2/ Check 4 Hourly Time Frame for trend confirmation if:
(look back up to 50 candles - find last cross of EMAs)
$(chart)=4H and trend=$(crossover) then goto 3/ *Means: crossover = ema8 > ema21
$(chart)=4H and trend=$(crossunder) then stop (No trades) *Means: crossunder = ema21 > ema8
NOTE: This function is switchable. 0=off and 1=on(active). Default = 1 (on)
3/ 1 Hourly Time Frame for trend confirmation AND trade execution if:
(look back up to 50 candles - find last cross of EMAs)
$(chart)=1H and trend=$(crossover) then goto 4/ *Means: crossover = ema8 > ema21
$(chart)=1H and trend=$(crossunder) then stop (No trades) *Means: crossunder = ema21 > ema8
4/ Trade preparation:
* if Next (subsequent) candle touches 8EMA, then set STOP LOSS and ENTRY
* $stoploss=3 pips BELOW current candle LOW
* $entry=3 pips ABOVE current candle HIGH
5/ Trade waiting (ONLY BEFORE entry is hit and trade activated):
* if price action touches 21 EMA then cancel trade and goto 1/
Note: Once trade is active this function does not apply !
6/ Trade Activation:
* if price activates/hits ENTRY price, then bot activates trade LONGs market
7/ Optional Trailing stop:
* if active, then trailing stop 3 pips BELOW previous LOW of previous 5th candle
or * Move Stop Loss to Break Even after $X number of pips
NOTE: This means count back and apply accordingly to the 5th previous candle from current candle.
NOTE: This function is switchable. 0=off and 1=on(active). Default = 0 (off)
8/ Trade Close ~ Take Profit:
* Only TP when
$(chart)=1H and trend=$(crossunder) then close trade ~ Or obviously if Stop Loss is hit if 7/ is activated.
----------END FOR LONG TRADES LOGIC----------
IMPORTANT:
* If an existing trade is already open for that same pair, & price action touches 8EMA, do NOT open a new trade..
* bot must continuously check if a trade is currently open on the pair that triggers
* New trades are to be only opened if there is no active trade opened on current pair.
* Only 1 trade per pair rule !
* 5 simultaneous open trades (not same pairs) default = 5 but value can be changed accordingly.
* Maximum risk management must not exceed 1.5% on lot size
*** Some features are not yet available autoated, they will be added in due course in subsequent version updates ***

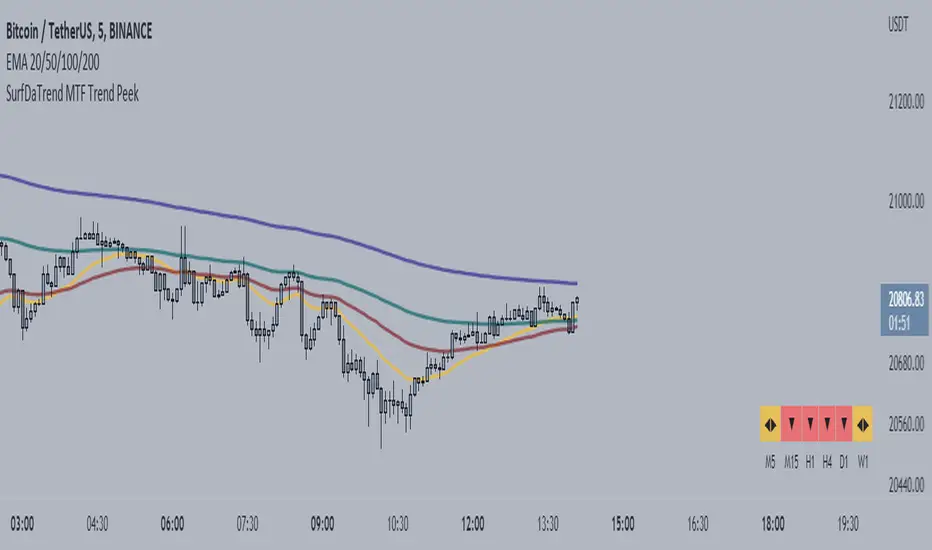
SurfDaTrend MTF Trend PeekThis script displays whether the EMA's align on Multiple-Timeframes. The user will set the EMA periods to use to determine the trend. This is useful for Multi-timeframe analysis and ensuring you are not trading against the HTF trend. This script also benefits users who use only a single screen as it is troublesome to switch to multiple timeframes to check EMA alignment.
***note: This is only useful for traders who trade on the lower timeframes. Not recommended for long-term traders.
Multi-timeframe EMAThe Multi-timeframe exponential moving average (EMA) indicator visualizes EMAs from 1 minute to 1 quarter on a single chart using the request.security function. Standard and Fibonacci timeframes are available as well as the ability to hide high-timeframe EMAs to keep the chart clean. Cross-overs and arrangement of the EMAs indicate sentiment.
Much love to DumpCap! The script is presented sans secret sauce.
MTF EMASMulti time frame EMA
This script will plot the configured EMAS on the current time frame (CTF) and also the same EMAS on a higher time frame (HTF).
Hard coded according:
* 5m EMAS will be plotted on TF bellow 5m
* Daily EMA will be plotted on TF above 5m and bellow 1D
* Weekly EMA will be plotted on daily TF
* Monthly EMA will be plotted on weekly TF
This configuration give us the opportunity to watch EMA support/resistance from HTF on the CTF

Joel on Crypto - MACD ScalpingJoel on Crypto - MACD Scalping
This is a Scalping indicator primarily intended for the 5 minute time frame.
It is based on the Crypto Scalping YouTuber Joel on Crypto's popular 5 minute scalping strategy and this is the indicator he personally use when Scalping.
This is a Multi-timeframe indicator where if you use it on the 5 minute time frame, the MACD Histogram bars will be based on the 1 minute timeframe.
The purpose of this indicator is not to trade it like a bot. The purpose is to grab the traders attention a time where there COULD be a scalping opportunity.
Use this indicator at your own risk.

Multi EMA with labels (Any timeframe)This script lets you add up to 8 EMAs (Exponential Moving Averages) that can be set to any timeframe and length. The difference between this and other EMA indicators is that it has a simple label attached to each EMA showing which timeframe it belongs to and what length it is, so you can get that information at a glance while trading without having to remember the specific settings for each EMA.
I was personally looking for something like this because I like clarity on my chart and these labels really help. The existing EMA indicators I found with labels don't support multiple timesframes or if they do, they don't include the timeframe itself in the label, so that's why I created this simple script and shared it in case somebody else is looking for the same. Enjoy.
