Cyclic Smoothed RSI MTFAdaptive cyclic smoothed Relative Strength Indicator (csRSI MTF)
The cyclic smoothed RSI MTF indicator is an enhancement of the RSI , adding zero-lag smoothing, adaptive oversold/overbought bands and period color highlighting from higher timeframe to filter signals.
Providing the following advanced features:
using the current dominant cycle length as input for the indicator to ensure more accurate change in trends,
additional smoothing without introducing lag and maintaining clear sharp turns for signal generation,
adaptive upper and lower bands to avoid whipsaw trades and adapt the indicator to trending/cyclic conditions,
using higher time-frame csRSI oversold/overbought conditions to automatically highlight time windows with green/red backgrounds on the indicator panel for signal filtering and/or alert rules,
can be used to trigger alerts on your key symbols to get informed when a red/green windows are reached.
The following common problems with standard indicators are solved by this indicator:
First, normal indicators introduce a lot of false signals due to their noisy signal line. Second, to compensate for the noise, one would normally try to add some smoothing. But this only results in adding more delay to the indicator, which makes it almost useless. Third, oscillators contain static threshold levels to define oversold/overbought conditions. However, the market is not static and changes between trending and cycling periods. In trending periods, these static oversold/overbought levels are useless ore will trigger too much whipsaw trades. Finally, indicators don't take their state from other timeframes into account to filter signals.
All four problems described above are solved by the developed adaptive cyclic RSI with embedded MTF period highlighting.
Examples
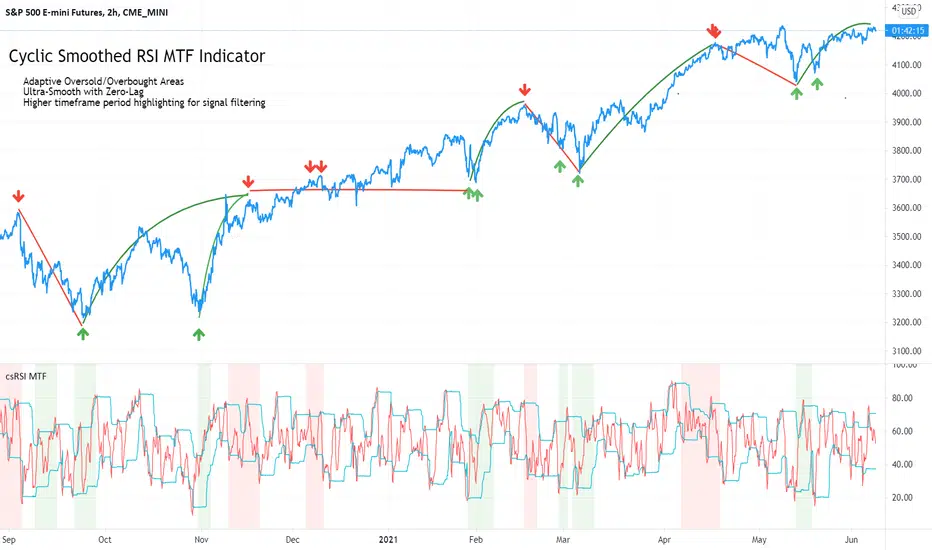
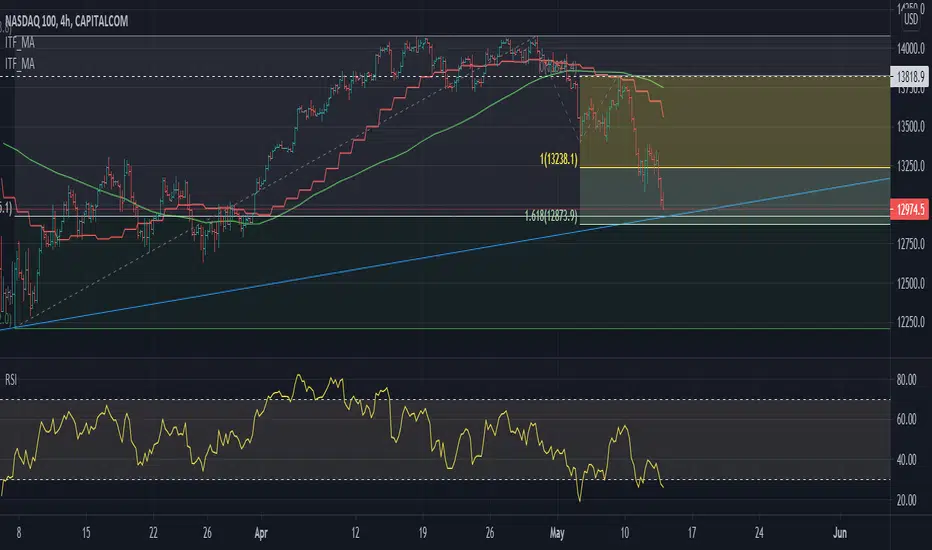
S&P500 EMini Futures - csRSI 2H chart / 1D filter example signals
S&P E-Mini Futures 2h chart with daily higher time-frame filtering period for the csRSI, showing the standard RSI in the lower panel for signal comparison, signals from the csRSI are marked on the price chart
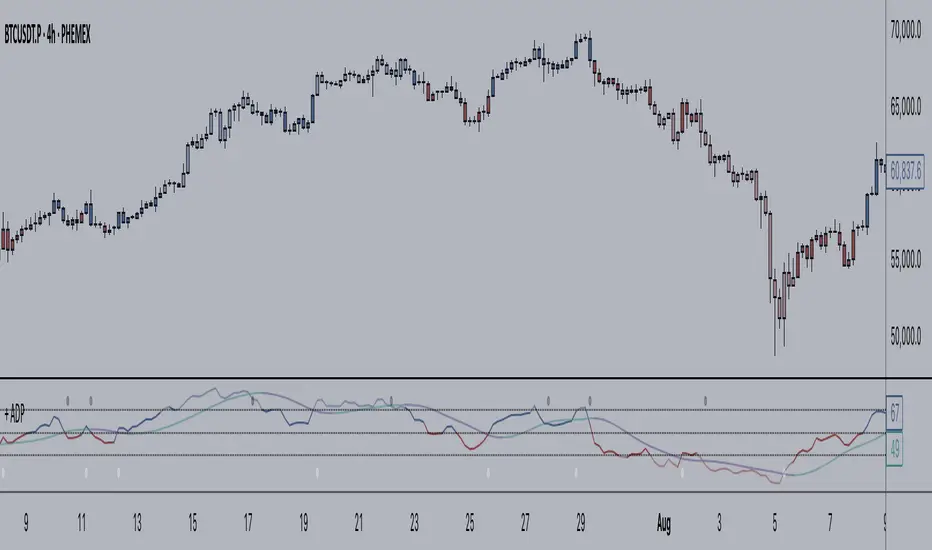
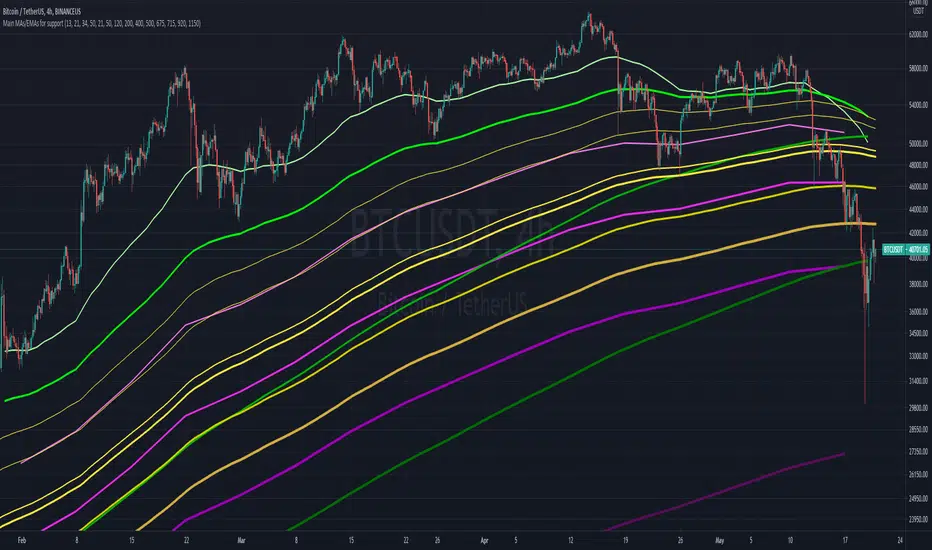
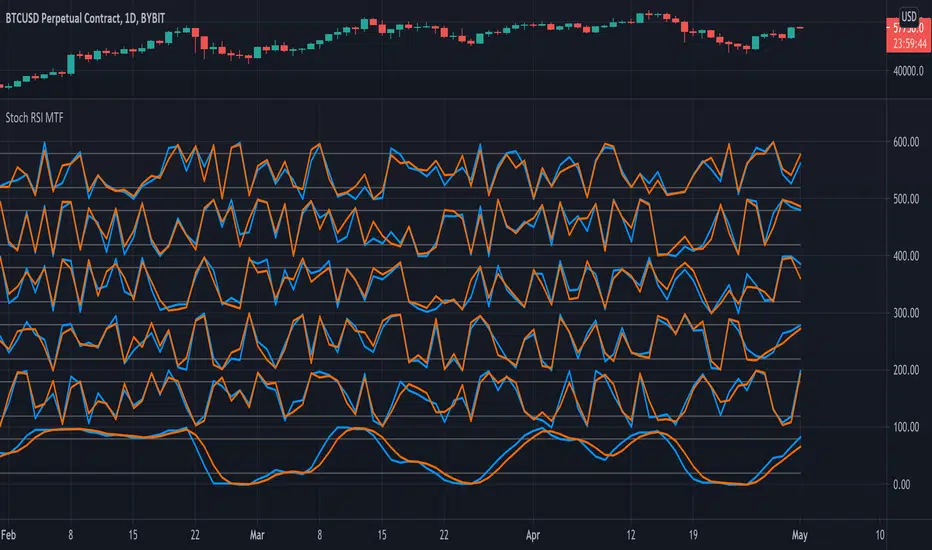
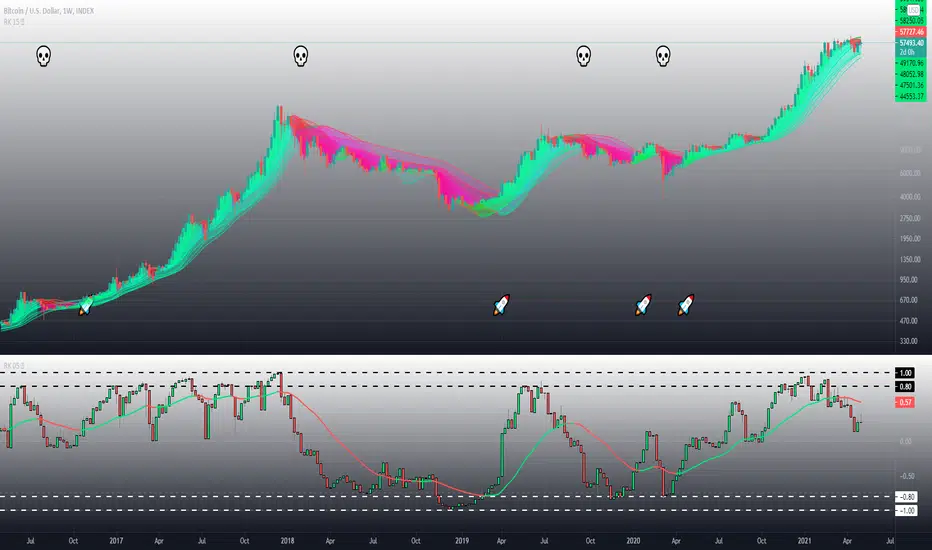
Bitcoin BTC /USD - csRSI 2H chart / 1D filter example signals
Bitcoin BTC /USD 2h chart with daily higher time-frame filtering period for the csRSI, signals marked
EUR/USD Forex - csRSI 20min chart / 2h filter example signals
EUR/USD 20min chart with 2H higher time-frame filtering period for the csRSI, signals marked
Info:
All three examples are setup with the basic standard settings and no additional parameter adjustments. The placed arrows on the price/indicator panel and the projection price areas have been added manually to visualize the signals for an discretionary trading approach. They are derived based on standard technical indicator oscillator readings (signal turn above/below bands). Due to the nature of the indicator (ultra-smooth, sharp curves, dynamic bands), these signals are easy to spot, and will help to avoid whipsaw trades in volatile conditions.
Settings & Parameter
The Inputs section allows you to select the time frame for the indicator signals. We recommend keeping the indicator time-frame according to your chart time frame ("Same as chart"). The cycle length allows to improve the signals by entering the dominant cycle length of the analyzed dataset. This parameter is optional if the current dominant cycle is not known. In that case, leave it at 20. The dominant cycle length can even improve the indicator signal generation. The examples above have not been optimized by using the dominant cycle length and just used the standard setting of 20.
The MTF CYCLE FILTER area is used to set the time-frame used as filter to plot the colored indicator background in red and green areas when the higher time-frame indicator is above (red) or below (green) the dynamic bands. These indicate the period of time with high probability to look for signals on the main indicator line.
The MTF Resolution parameter input is important for generating the highlighted red/green areas on the indicator panel. You must enter a higher time-frame than your indicator time-frame in order to get the reliable highlighting. We recommend the following combinations of trading time-frame and filter time-frame resolutions:
Chart Timeframe | MTF Indicator Highlighting Resolution
------------------------------------------------------------------------
20 min | 2 h
2 h | 1 d
You can enter the current dominant cycle length on the chosen higher time-frame resolution to even further optimize the indicator accuracy in the field "MTF CYCLE FILTER - Cycle Length".
The Style sections allows to active/de-active individual plots. The standard setting disables the higher time-frame csRSI indicator which is only used to indicate the colored areas. If required, you can also enable the MTF indicator and adaptive bands to be plotted in the same indicator panel. The values shown in the style section also indicate which values are available for individual alert generation.
Automatic Signals & Alerts
It is possible to create your own automatic signals with the csRSI MTF indicator using the TradingView alert function. Click on the three dots "More" beside the indicator name label and select "Add Alert on csRSI ..." from the context menu. For example, if you want to receive an alert when the high probability periods (red/green highlighted areas) have been reached for a symbol without manually watching the indicator panel, you can set up a custom alert. The csRSI indicator provides the raw values necessary to set up your alarm conditions. Set the "CSRSI MTF" as the value for the "Out of Channel" condition and select the "HigBand MTF" and "LowBand MTF" indicator values as the upper and lower limit parameters in the alarm's dialog box. Once you have set up this alarm, you will not need to monitor your charts manually. The TradingView alert will inform you as soon as an important time zone is reached. These are the situations when you would open the chart and watch for trigger signals on the indicator line. If you set up this alert as an email, you can even focus on other things and let the csRSI MTF highlighter condition alert you when you should pay attention to the trading chart.
Usage & Trade Signals
Classic rules apply as with every technical oscillator. In addition use this indicator to identify the following conditions:
Indicator turns above/below the adaptive upper and lower bands (expected trend reversals)
Indicator crosses below upper band / crossed above lower band (start of trend reversal)
Indicator crosses above upper band / crossed below lower band (trend continuation/confirmation)
Divergence between price / indicator indicate strong signal confidence
Hidden divergences between price/indicator indicate string signal confidence
After strong price movements, wait for the second signal confirmed by a divergence
Use the mentioned conditions in the highlighted red/green periods indicated by the MTF settings
Purpose & Disclaimer
This indicator is not designed for use as an automated trading strategy. This is an improved technical indicator using the dominant cycle to provide its advanced features. The basic applications of technical analysis for using oscillators apply. The script is intended for use in discretionary trading and can be used as a part of automated systems. Indicator signal failures will occur as you should expect with every technical indicator. If you are not sure if this indicator might help your trading style, please try and check our open source public version which will give you basic understanding upfront.
Basic open-source public version
This indicator is an advanced version of our public available open-source cyclic smoothed RSI indicator named "RSI cyclic smoothed v2". The advanced invite-only version provides fully automatic time frame highlighting by using a cyclically smoothed RSI from a higher time frame to indicate time frames with high probability signals. These high probability windows are highlighted when the indicator from the higher time frame is in dynamic overbought or oversold territory. You will find the basic open-source public version here below for your own review:
How to get access
Please check the "authors instructions" section for further details.
Script a pagamento