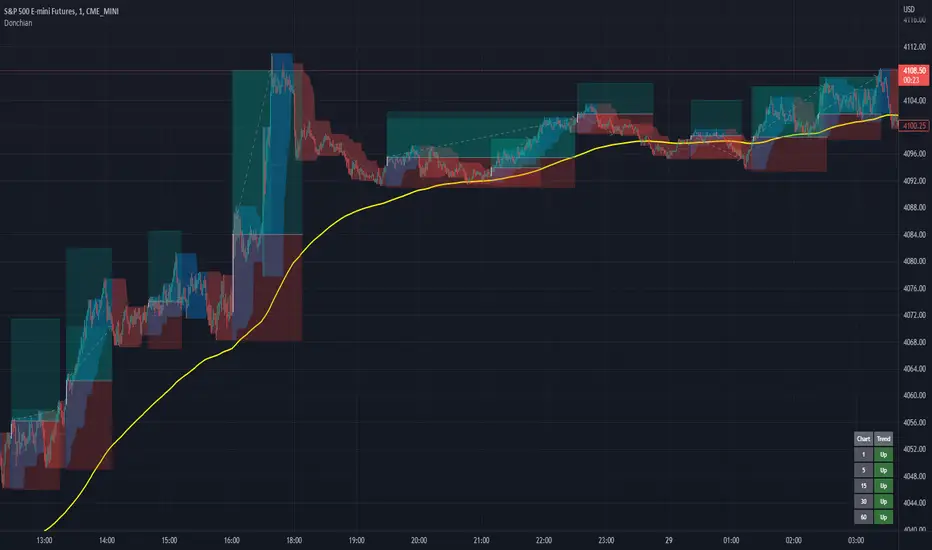
Donchian Channels+Standard Donchian Channels, this includes a Trend EMA which can be configured and the channels will use to give buy and sell signals. The channels are also colored in such a way to indicate a trend reversals. My favorite part that sets this apart from others is, if using the bClose option (which I recommend you do) the trend will not reverse until there is a close above/below the previous channel high/low. i.e. a reversal into an uptrend requires the current bar to close above the previous upper channel rather than just a new high.
The coloring of the current trend allows for a quick read of current market conditions and I use this on any timeframe across all forms of charts (forex stock, futures , crypto, etc). When taking one of the signals I use the opposite channel as the stop loss (when buying use bottom, and selling use top channel)
Update 1:
- Added my name to the code
- Updated the picture to show off the indicator better
- Raised the brightness of the fill color a bit, looks nicer I think
As a warning: I have obviously hand picked this picture to really show off this indicator's power to work in a trending market. Donchian Channels are a trending indicator and work best in trending markets with decent pull backs. If there are multiple signals going in each direction, it is a choppy market and you should stay out until it starts trending again. I generally use a 1:1.5 risk to reward ratio but sometimes will stretch it to 1:2 if it is a nice trade and I feel the market is in my favor as you can see from the trades placed in the picture (and I use that method for any commodity / chart and timeframe). I use the close of the white candle and then (since they are trades going short) I use the upper Donchian Channel as my stop loss.
I personally like to have the lines and labels turned off and enable all other options. Labels are just there to really stand out so you don't miss the white candle indication for a trade. OH! Also, I've had comments from friends that the white candles are hard to see, I turn off my candle borders in settings; makes it super easy to see them then. I turn lines off as the fill does the job well enough and it seems cleaner in my eyes.
If you'd like to see this picture on your chart, it is Micro E-Mini S&P 500 Futures from July 10, 2022 @ 18:00 on the 1-min chart.
just now
Update 2:
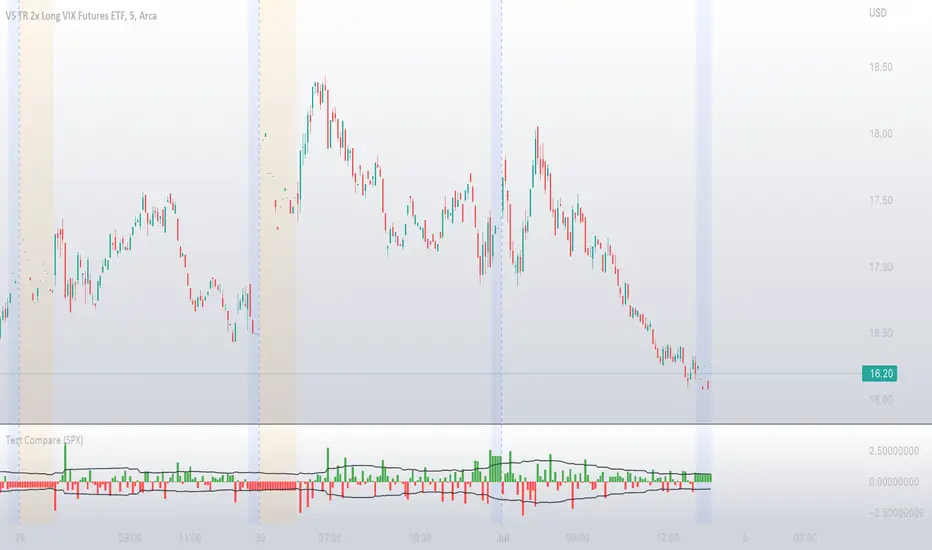
- Added day trading time highlights
- Added ranging market indicator (This I'm still working on so use at your own discretion, it's intended purpose is to tell when the Donchian Channels are not going to give great signals and to use a ranging indicator instead)
- Added multi-timeframe trend screener (handy if you want to quickly see the trend direction (based on the Trend EMA you set) of several time frames without having to change charts). It will draw in the bottom right of the chart.
Indicatore Pine Script®