Trend analysis - Take Profit (Expo)Trend analysis - Take Profit (Expo)
DESCRIPTION
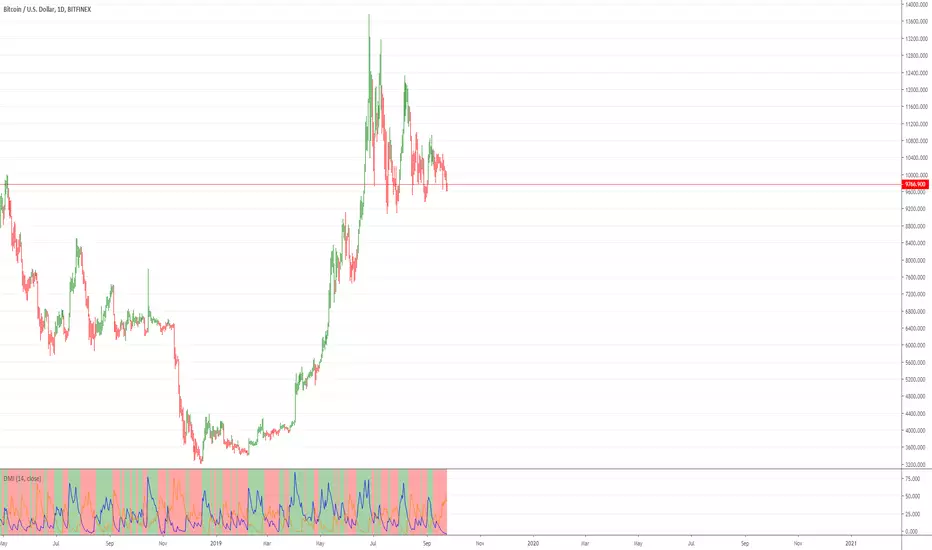
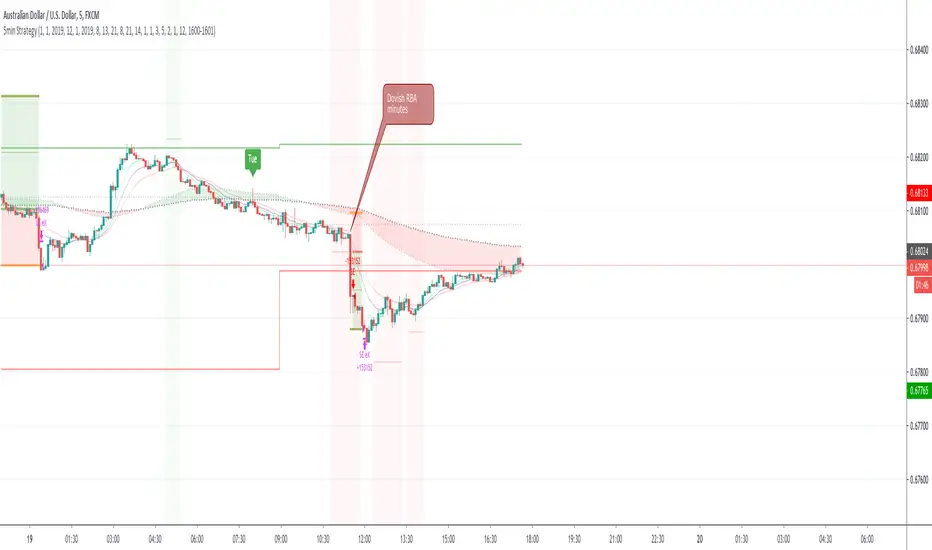
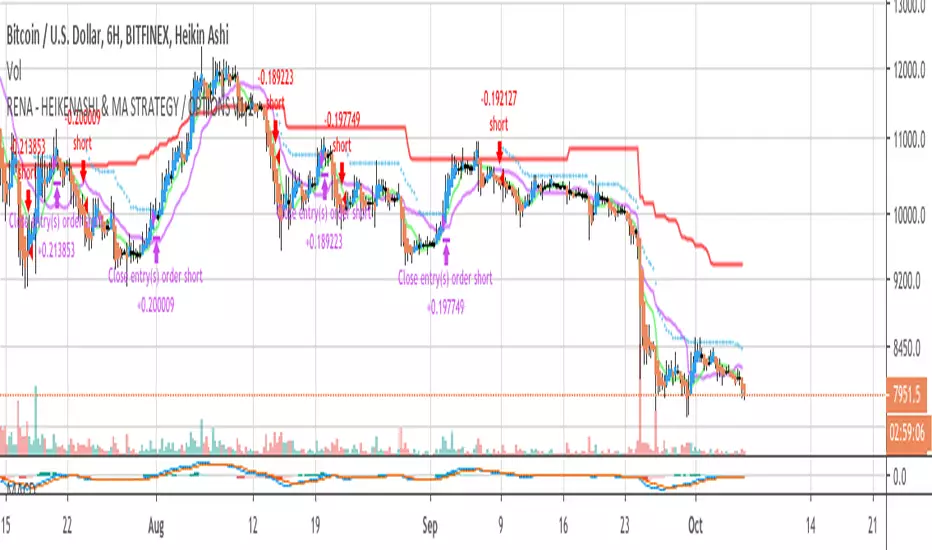
Trend analysis - Take Profit (Expo) indicator is developed to visualize ‘Lock In Profits -points' in trends. It’s a necessity for a professional trader to continuously ‘Lock In Profit’ in order to grow their balance and to reduce their risk. In fact, research shows that exits have more impact on the results than any other factor (Tharp, 2006). So when the indicator shows a ‘TP’ - point, start to lock in some of your profit and continuously do so on every TP - point and exit the trade when a circle is shown.
The indicator does also visualizes the current trend by the color of the cloud. Green color = positive trend. Red color = negative trend.
The professional trader will have the possibility to adjust the sensitivity of the TP - point as well as the length of the trend calculation.
HOW TO USE
1. Use this indicator to identify when to Lock In Profits in trends.
2. Use the indicator to identify trends.
3. Use the indicator to identify a trend shift.
INDICATOR IN ACTION
BTCUSD
BTCUSD
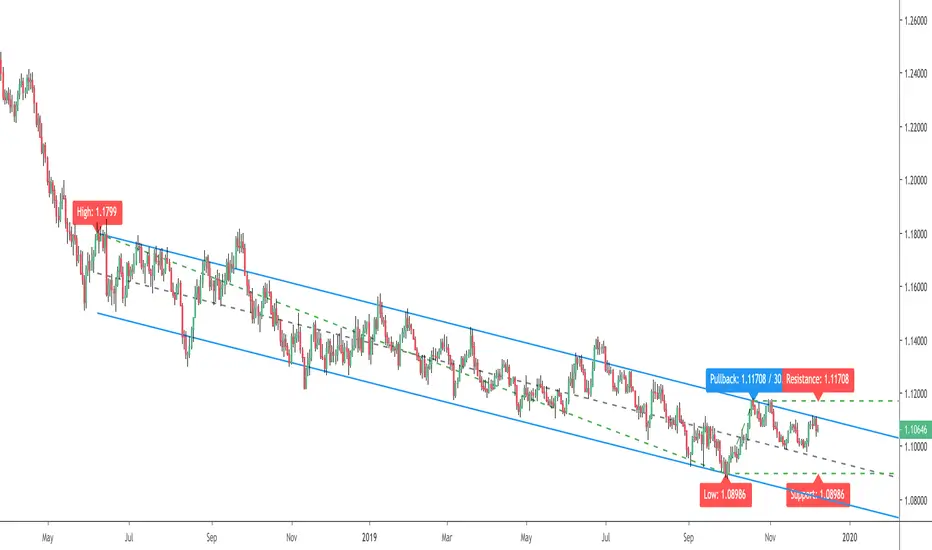
EURUSD
BRENT
EURGBP
The indicator works with RENKO, HEIKIN ASHI and with KAGI charts as well.
I hope you find this indicator useful, and please comment or contact me if you like the script or have any questions/suggestions for future improvements. Thanks!
I will continue to work on this indicator, so please share your experience and feedback with me so that I can continuously improve it. Thanks to everyone that have contacted me regarding my scripts. Your feedback is valuable for future developments!
ACCESS THE INDICATOR
• Contact me on TradingView or use the links below
-----------------
Disclaimer
Copyright by Zeiierman.
The information contained in my scripts/indicators/ideas does not constitute financial advice or a solicitation to buy or sell any securities of any type. I will not accept liability for any loss or damage, including without limitation any loss of profit, which may arise directly or indirectly from use of or reliance on such information.
All investments involve risk, and the past performance of a security, industry, sector, market, financial product, trading strategy, or individual’s trading does not guarantee future results or returns. Investors are fully responsible for any investment decisions they make. Such decisions should be based solely on an evaluation of their financial circumstances, investment objectives, risk tolerance, and liquidity needs.
My scripts/indicators/ideas are only for educational purposes!
Trendfollowing

Adaptive Trend (Expo)Adaptive Trend (Expo)
DESCRIPTION
This Adaptive Trend (Expo) indicator is used to detect trends as well as to adapt to the trend characteristic in order to filter-out trend noise. Having an indicator like this enables professional traders to stay longer in trends. The indicator is also equipped with upper- and lower boundaries as well as a mid-line.
Positive trend
If the two trendlines (positive & negative trendline) emerges into one single line, it’s regarded as a positive trend. If a green cloud is painted in the indicator it’s a sign that the indicator is categorizing that price move as noise, and thus the professional trader should keep their long position, or enter Long.
Negative trend
If the two trendlines (positive & negative trendline) separates and become two lines as well as a red cloud is painted in the indicator, this is regarded as a negative trend.
As a general rule, if the ‘positive & negative trendline’ is above the midline there is a positive trend. If the ‘positive & negative trendline’ is below the midline there is a negative trend.
You have the possibility to change the ‘trendvalue’, a shorter length is more sensitive than a longer length.
HOW TO USE
1. Use the indicator to identify trends.
2. Use the indicator as a trend following strategy.
INDICATOR IN ACTION
EURUSD
EURUSD
EURUSD
BTCUSD
The indicator works with RENKO, HEIKIN ASHI and with KAGI charts as well.
I hope you find this indicator useful, and please comment or contact me if you like the script or have any questions/suggestions for future improvements. Thanks!
I will continue to work on this indicator, so please share your experience and feedback with me so that I can continuously improve it. Thanks to everyone that have contacted me regarding my scripts. Your feedback is valuable for future developments!
ACCESS THE INDICATOR
• Contact me on TradingView or use the links below
-----------------
Disclaimer
Copyright by Zeiierman.
The information contained in my scripts/indicators/ideas does not constitute financial advice or a solicitation to buy or sell any securities of any type. I will not accept liability for any loss or damage, including without limitation any loss of profit, which may arise directly or indirectly from use of or reliance on such information.
All investments involve risk, and the past performance of a security, industry, sector, market, financial product, trading strategy, or individual’s trading does not guarantee future results or returns. Investors are fully responsible for any investment decisions they make. Such decisions should be based solely on an evaluation of their financial circumstances, investment objectives, risk tolerance, and liquidity needs.
My scripts/indicators/ideas are only for educational purposes!

Liens Support & Resistances + Trend following v2
1. Previous daily Support and resistance levels ( Not showing on chart - Needs to be used on lower tf )
2. Previous Weekly Support and resistance levels
Blue circles = Weekly Support
Yellow circles = Weekly resistance
This setting is currently set to "0 days" so when you open the script it wont show.
On chart previous weekly is set to "10 weeks"
3. Auto Support and resistance levels targeting Highs and lows(wicks).
Auto color change
Support = always green
resistance = always red.
4. Trendfollowing Using the 20 ema
Bars change color when price is over/under ema.

Liens Support and resistance + trend following1. Two different support and resistance levels. One that focuses on price action and one for wicks. (Wicks needs to be turned on)
3. 20 ema trendfollowing. Bars change color. when price is over/under ema.
4. Bar color levels also work with rsi levels. Currently set to 0-100. If you only want bars to change color when the rsi is overbough/oversold. simply just change the levels to 70-30 or whatever you like :)

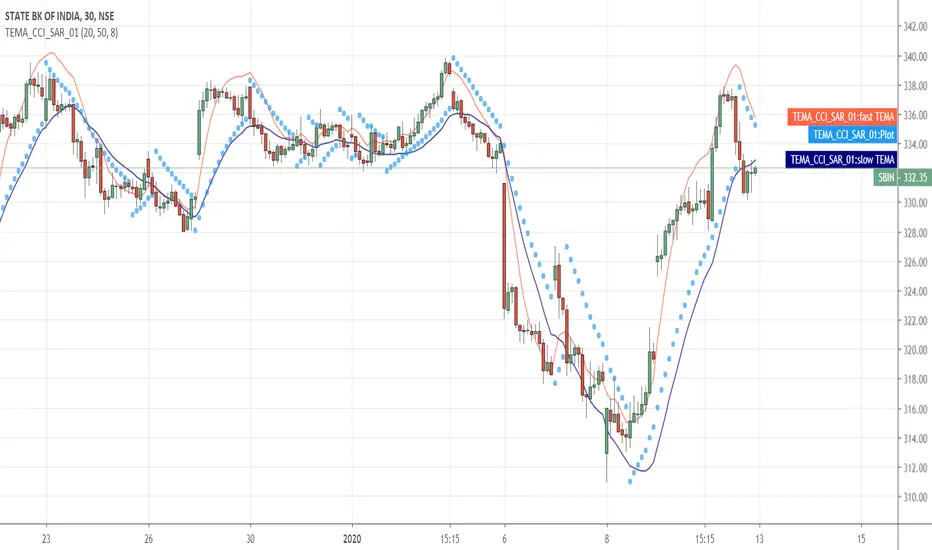
TEMA_CCI_SAR_01This strategy is using TEMA and PSAR for buying selling. Educational.
Disclaimer: if you this tool for trading which may cause losses and profits which myself or Tradingview and its partners wont responsible for it.
Donchian Breakout StrategyThis strategy buys when the Donchian Channel is broken to the upside and uses the lower Donchian Channel line as a trailing stop. You can also choose to use a moving average as a filter to keep you out of trades that are counter trend.
You can also configure which dates you want to backtest, so you can see how this behaves over specific time frames and market cycles.

Estamina Trend Strategy By KrisWatersTrend following strategy based on moving avarage crossovers. Strategy provides only long signals. Use only for BTCUSDT pair on 4H timeframe.

Parametric Oscillator (Zeiierman)█ Overview
The Parametric Oscillator (Zeiierman) transforms price movement into a structure-aware momentum field, a flowing wave of oscillator-candles wrapped around a smooth Quick Price Action line. Instead of reading raw closes, it constructs a multi-lane view from open, high, low, and close data to capture how price pressure expands, contracts, and shifts through time. These relationships are then projected into a bounded oscillator domain, creating a dynamic visualization of momentum and market balance.
The oscillator-candles flip green or red to signal shifts in buying or selling strength, while the Quick Line tracks underlying momentum on a 0–100 scale. Together, they reveal where pressure is forming, how quickly it’s changing, and whether that change is sustainable, helping traders spot momentum swings, stretched zones, and directional bias across any timeframe.
⚪ What Makes It Unique
The oscillator’s uniqueness lies in how it constructs and interprets price structure. It builds four independent lanes of open, high, low, and close to measure wave relationships and capture micro-drift, wick aggression, and full price behavior rather than relying solely on closing data.
Beneath the surface, the oscillator runs on a balanced motion function that translates market volatility into a clear rhythm of momentum and structure. Each change in color and gradient reflects the balance between acceleration and stability, revealing the underlying pulse of market behavior.
█ Main features
⚪ Parametric Oscillator
The Parametric Oscillator turns market movement into a visual map of buying and selling pressure. Its oscillator-candles reveal how momentum builds, compresses, and releases, showing the balance between strength and exhaustion in real time. As candles shift color and gradient, traders can instantly read acceleration, fading energy, or volatility spikes, allowing for quick interpretation of trend health and potential reversals.
The display captures both immediate bursts of momentum and the underlying trend’s persistence, giving a continuous view of how pressure evolves across market phases. It can be used to spot areas of buildup before breakouts, early signs of compression before expansion, and the transition points where control shifts from buyers to sellers.
⚪ Quick Price Action
The Quick Price Action line provides a smooth, real-time read of market momentum that often shifts before price itself reacts. Acting as a leading momentum gauge, it highlights subtle changes in strength and direction, helping traders anticipate moves rather than chase them.
When the line begins to turn, it frequently does so well ahead of price, signaling acceleration, exhaustion, or an early phase of reversal. A rise toward higher levels reflects building bullish pressure, while a downturn from elevated zones shows fading strength or emerging sell bias.
It adapts smoothly across symbols and timeframes, the Quick Price Action line gives traders a consistent, early warning system and a clear visual cue of when momentum is starting to shift and where the next meaningful move may form.
█ How to Use
⚪ Trend Following
The Momentum Candle Line helps define the underlying directional bias by measuring the strength and persistence of momentum. When momentum holds above or below the midline (50), it reflects whether buyers or sellers maintain control of the trend. Watching how the candles form relative to that level helps identify continuation or potential shifts in direction.
Maintain a bullish bias when the Momentum Candles stay above 50 and candles form higher lows.
Maintain a bearish bias when they stay below 50 and candles form lower highs.
⚪ Detect Leading Momentum
The Quick Price Line helps identify leading momentum moves that often precede price action. These can signal the start of a new move in that direction or the early stages of a reversal.
When the Quick Line peaks above 80, it indicates strong positive momentum.
When it peaks below 30, it signals strong negative momentum.
By observing how the momentum candles behave around these levels, traders can determine whether the move is likely a continuation or a reversal.
⚪ Fading Price Moves
Momentum drives price to new highs and lows, but when that momentum fades, reversals often follow. The Quick Price Line or the Parametric Oscillator candles can reveal weakening momentum before price reacts, giving traders an early signal. When the Quick Line peaks and then begins to fade, it indicates that momentum is losing strength. This can precede a pause, a range, or a full reversal in price. Likewise, if the Parametric Oscillator starts to fade while price continues to move, it suggests that momentum is weakening and a reversal or pullback may be approaching.
█ How It Works
⚪ Dual-Lane Displacement
Price is decomposed into trend and fast components across the open, high, low, and close. These relationships form four signed streams that describe body drive and wick aggression.
Calculation: Builds relative spreads between the trend and fast components, creating a multi-dimensional price-flow state.
⚪ Parametric Mapping
Each data stream is passed through a parametric transform (defaulting to a momentum-sensitive map) and assembled into synthetic OHLC in oscillator space.
Calculation: Applies a state transform over the data, aggregates into oscillator OHLC, and exponentially smooths for stability.
⚪ Quick Price Action
A companion line extracts recent trend displacement, normalizes it in a rolling window around the local mid, and passes it through a smoothing process controlled by Price Trend (softness). This yields a stable 0–100 scale that reacts quickly yet remains consistent across assets and timeframes.
Calculation: Windowed normalization around a dynamic midpoint with adjustable softness to balance responsiveness and stability.
-----------------
Disclaimer
The content provided in my scripts, indicators, ideas, algorithms, and systems is for educational and informational purposes only. It does not constitute financial advice, investment recommendations, or a solicitation to buy or sell any financial instruments. I will not accept liability for any loss or damage, including without limitation any loss of profit, which may arise directly or indirectly from the use of or reliance on such information.
All investments involve risk, and the past performance of a security, industry, sector, market, financial product, trading strategy, backtest, or individual's trading does not guarantee future results or returns. Investors are fully responsible for any investment decisions they make. Such decisions should be based solely on an evaluation of their financial circumstances, investment objectives, risk tolerance, and liquidity needs.

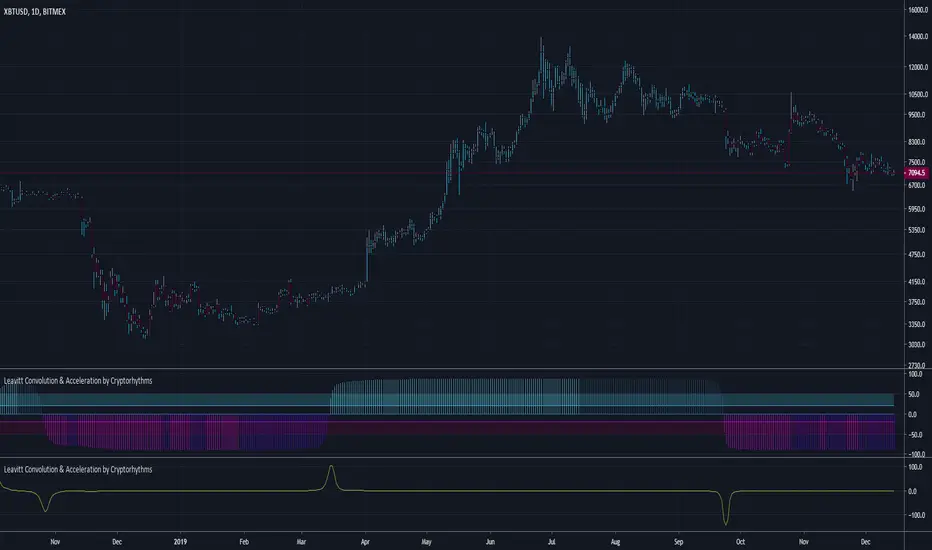
Leavitt Convolution & Acceleration by CryptorhythmsLeavitt Projection, Convolution, & Acceleration by Cryptorhythms
Intro
Bringing you another open source Gem this time from the January 2020 Issue of TASC.
Description
In the article in the Oct 2019 TASC issue titled "An interplanetary marriage" author Jay Leavitt describes the evolution process required in strategy design by introducing his Mars strategy. This grew out of concepts presented in his earlier TASC articles such as the stratosphere, moon rocket, and tech emini strategies. This dual indicator uses a linear regression of price data to help derive slope and acceleration information, in turn helping him to identify trends and trend turning points.
Additions
As usual a few useful extras are included such as a rudimentary signaling system, bar coloration by trade state, overbought/oversold areas to assist in algorithmic setups, and more!
👍 We hope you enjoyed this indicator and find it useful! We post free crypto analysis, strategies and indicators regularly. This is our 71st script on Tradingview!
💬Check my Signature for other information
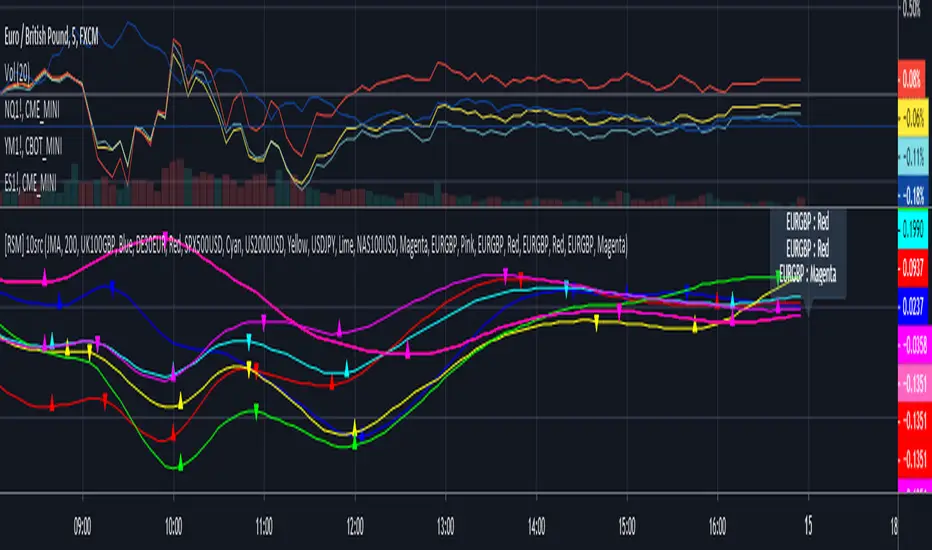
[RSM] Relative Strength Momentum 10 sources v1.1This indicator was designed to compare relative price momentum across multiple related/unrelated symbols, maximum of 10.
Each symbol's momentum/trend is determined by price movement and custom weighted moving averages.
You can use this indicator to determine changing trends by looking at correlated leading symbols.
Description of Input Parameters:
Dark theme: Turn on this checkbox if you are using the dark theme in Tradingview.
MA Type: Default is preferred, but allows you to choose different Moving Averages to determine momentum.
MA Period: Ideal period is 200 for a Chart TF of 15 minutes to 1 Hour for most symbols I've tested. (US/Euro Indexes CFD and Futures )
Symbol 1-10: Enter a valid Symbol in Tradingview otherwise indicator will return an error.
Color Symbol 1-10: Pick a unique color for each corresponding Symbol.
Display Symbol 1-10: Checkbox to turn on/off corresponding symbol's plot.
Access to Script:
Please contact me privately on Tradingview, user id: a.tesla2018
Alternatively, use the links below for method of payment/access to this indicator. Please do not forget to mention your TV name in notes.
Bollinger Bands Trend Model-BuschiEnglish
In general, Bollinger Bands are used as an indicator to visualize the "reversion to the mean". However, in this model, by using smaller variable values (default: 10 time intervals instead of 20, 1 standard deviation instead of 2), they are used as an trend following indicator. Two consecutive closes above the upper band form a buy signal (symbol 'B' above bar) which is reversed by two consecutive closes below the lower band (symbol 'S' under bar) and vice versa. The corresponding buying (green) and selling (red) zones are coloured between the bands.
Deutsch
Im Allgemeinen werden Bollinger-Bänder als ein Indikator verwendet, um die "Rückkehr zum Mittelwert" zu visualisieren. In diesem Modell werden sie durch kleine Variablen-Werte (Standardwert: 10 Zeitintervalle anstatt 20, 1 Standardabweichung anstatt 2) jedoch als Trendfolge-Indikator verwendet. Zwei aufeinanderfolgende Schlusskurse über dem oberen Band (Symbol 'B' über dem Balken) bilden ein Kaufsignal, das durch zwei aufeinanderfolgende Schlusskurse unter dem unteren Band (Symbol 'S' unter Balken) umgekehrt wird. Gleiches gilt umgekehrt. Die entsprechenden Kauf-Zonen (grün) und Verkauf-Zonen (rot) werden zwischen den Bändern eingefärbt.

Auto Trend Channel by Atilla YurtsevenHi traders,
I have coded this "Auto Trend Channel" script to help myself to draw a perfect trend. I usually use "Open / Close" as source. Play around with the "Lookback" period to find the best fit. Hope you enjoy it.
Note: This indicator repaints as highs and lows changed.
Remember to follow me and drop some comments below.
Disclaimer: This is not financial advice
Trade safe,
Atilla Yurtseven
[RSM] Relative Strength Momentum v1.0 [pvt]This indicator was designed to compare relative price momentum across multiple related/unrelated symbols, maximum of 6.
Each symbol's momentum/trend is determined by price movement and custom weighted moving averages.
You can use this indicator to determine changing trends by looking at correlated leading symbols.
Description of Input Parameters:
Dark theme: Turn on this checkbox if you are using the dark theme in Tradingview.
MA Type: Default is preferred, but allows you to choose different Moving Averages to determine momentum.
MA Period: Ideal period is 200 for a Chart TF of 15 minutes to 1 Hour for most symbols I've tested. (US/Euro Indexes CFD and Futures)
Symbol 1-6: Enter a valid Symbol in Tradingview otherwise indicator will return an error.
Display Symbol1-6: Checkbox to turn on/off corresponding symbol's plot.
Access to Script:
Please contact me privately on Tradingview, user id: a.tesla2018
Alternatively, use the links below for method of payment/access to this indicator.

First time coding - a 5min forex Scalping strategy This is my first attempt at producing a strategy in Pine Script.
I am NOT a professional coder. I'm not even a good coder at that. I've only started Pine Script coding since September 2019. I am teaching myself.
This script is far from finished. I need to tweak a number of things about this script. Namely:
Add a validity window to the 'trigger bar' condition. Ie, I want to shut down the condition when the price closes above EMA21
Change the order entry so they are stop orders, using the stop entry price derived from the signals
Make changes to lot sizing
Add a trailing stop condition
Comments welcome, but do not expect me to reply to any questions or requests. In fact, don't expect any replies from me. I consider myself notoriously bad at replies.
I do welcome any feedback from any seasoned coders out there, as I am still a novice coder, and have so much to learn!
As to anyone who wants to criticise me - constructive and helpful criticism are most welcome, criticism to make yourself feel superior to me - you kind can eat a dk.
For the strategy rules, google the user ForexSignals TV account and look for the video "SIMPLE and PROFITABLE Forex Scalping Strategy".
Share, learn, prosper
Peace to y'all
Serialhenry
6/11/19
FiboStaircase by Solah AzmanThe band represents the range between local highest and local lowest and the layers are proportional to Fibonacci ratio. Suitable for 5 minutes charts.

Pivot Reversal Strategy - FIGS & DATES 2.0Simple Pivot Reversal Strategy with some adding settings.
Date Range: To test over specific market conditions.
Initial Capitol: $10K - This is a more realistic representation of funds used this strategy (for me anyway). The default of $100K can give different results (usually better) than when using a smaller balance.
Order Size: 100% Equity - These trend following strategies typically used this way, going all in each direction.
Commission: .075% - It's always disheartening to think you've found a ridiculously good setting, and then realize you forgot to add the commission.
All of these settings can be changed, but it's easier for me (and more fool proof) to have them set as default.

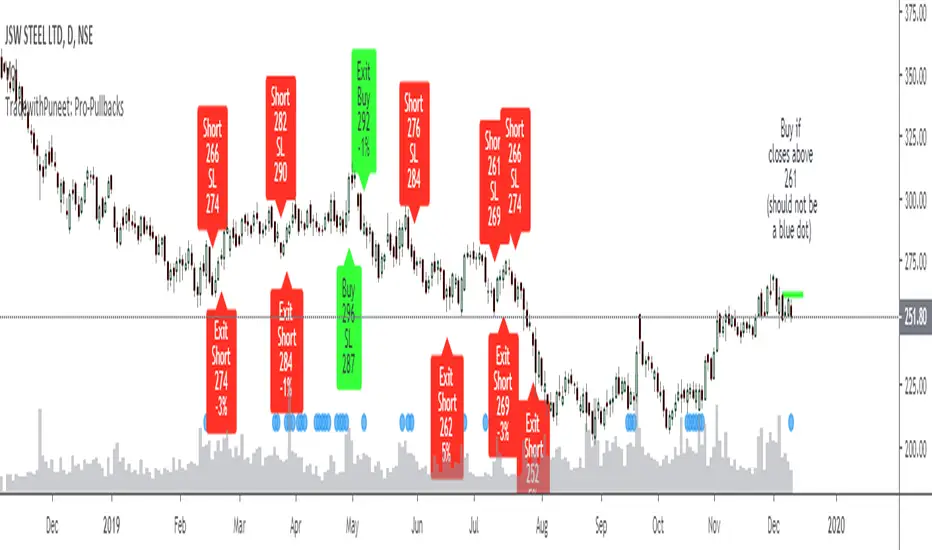
TradewithPuneet: Pro-PullbacksThe Pro-Pullbacks strategy is designed to trade pullbacks . In other words, this strategy will give you:
• BUY signals : When in an already established Uptrend , a stock falls but then resumes its upward trajectory.
• SHORT signals : When in an already established Downtrend , a stock rises but then resumes its downward trajectory.
Through this strategy, we aim to trade in the direction of an already established trend by entering on a pullback. Thus, instead of trying to catch the whole trend, this strategy tries to profit from an already established trend.
The strategy uses certain filters to identify whether the stock is in Uptrend or Downtrend. Next, it identifies pullbacks to an identified trend. Pullbacks are sometimes too short or too deep. This strategy ignores such short & deep pullbacks. Finally, it identifies certain threshold levels (for confirmation), beyond which the stock is expected to resume the original trend. If the stock closes beyond the threshold level, it gives the necessary BUY or SHORT signal.
The strategy guides you the price level at which to enter a trade. You can enter your choice of target profit and stop loss levels.
This strategy is only built for stocks, not for indices or any other financial instrument.
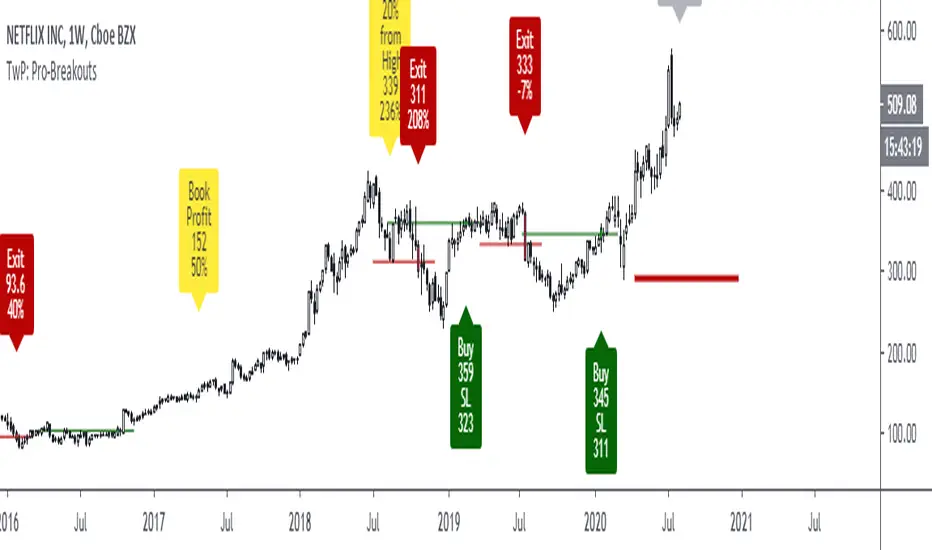
TradewithPuneet: Pro-BreakoutsThe Pro-Breakouts strategy is designed to get into a LONG position when a stock enters an Uptrend after a breakout. This strategy gives you:
• BUY signals : On a breakout, with strong probability of continuing up-moves.
• No SHORT signals are included in this strategy.
Through this strategy, we aim to ride a big chunk of the Uptrend till it reverses.
The strategy uses certain filters to avoid fake breakouts. Once those filter conditions are met, the stock waits for a breakout of key resistance level. Upon the breakout, the stock gives a BUY signal. Finally, when the stock breaks its key support level, it gives an EXIT signal.
The strategy guides you the price level at which to BUY and EXIT. You can also input your acceptable stop loss and profit booking levels, which are then displayed on the chart. The resistance and support lines (which result in trades) are drawn automatically on the chart.
The strategy is for medium to long-term traders . It works only on Daily timeframes and on closing prices. Hence, during the market hours, if a stock breaks out of its key-resistance level, you will see a BUY signal, but if it closes below it, the signal will disappear.
This strategy is only built for stocks, not for indices or any other financial instrument.
Moving Median Price by Atilla YurtsevenMoving Median Price is similar to Moving Average. However it uses the median instead of the mean. I believe that median is more important than the mean in some cases. Let me explain why:
There are 5 employees in a company. Their annual salary is $24,000,00. There's also a CEO of the company and his annual salary is $100,000.00. So if you calculate the mean to find the average salary using mean, you find $36,666.66. Well, nobody gets paid more than $24K but the CEO. Median helps us here. If you use median, the average salary is $24,000.00.
Keep in mind that you can use the median to find the average salary you pay per employee. You can still use mean for different purposes.
I have also added 2. Median to the script. You can enable or disable.
Disclaimer: I'm not an advisor and this script or the article is not financial advice.
Trade safe,
Atilla Yurtseven

Stochastic binary option styleUsing Time Frames For Trend – You can also use different time frames to determine trends with stochastic. To do this you will need to use two different time frame charts, I like to use the weekly/daily or daily/hourly combination depending on the asset. Weekly/daily works well with stocks and indices while I prefer the shorter time frame for currency and commodities. This is how it works; stochastic on the longer term chart sets trend, stochastic on the shorter term chart gives the signal. If, on the weekly chart, stochastic is pointing up then you would trade bullish signals on the daily charts. Or if using the daily/hourly combo the stochastic on the daily would set trend while signals would come from the hourly chart.
Green color bar and background means k is > d, the crowd is bullish (trend is bullish, a bullish crossover is happened), red is the contrary (bears are the leaders)
Credit to Michael Hodges

RENA - OPTIONS V1.2A swiss army knife type script, lots of indicators etc, good for crypto markets.
Study with alerts baked in can be found here
pm me for source code
happy trading xo
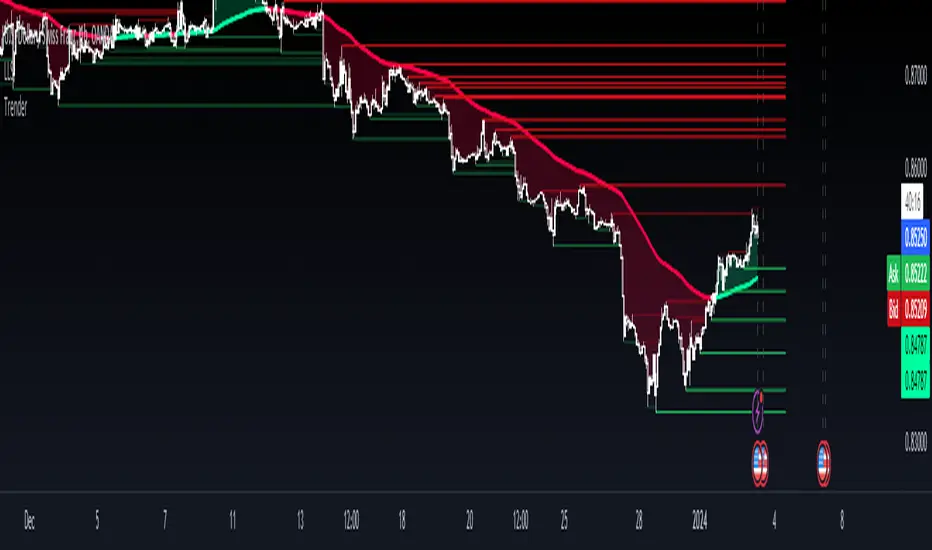
TrenderTrender is an indicator that compiles trend-following ideas in a complete friendly-custom indicator. Based on classic arithmetic moving averages, exponential moving averages, volume and a little bit of Fibonacci. Indicator built and usable in TradingView, focused only for easy visualization of the trend.
Directional Movement Index with double exponential moving averagThe Directional system is a trend-following method developed by J. Welles Wilder,
in the mid-1970s. It identifies trends and shows
when a trend is moving fast enough to make it worth following. It helps traders to
profit by taking chunks out of the middle of important trends.
Trading Rules
1. Trade only from the long side when the positive Directional line is above the
negative one. Trade only from the short side when the negative Directional line
is above the positive one. The best time to trade is when the ADX is rising, show-
ing that the dominant group is getting stronger.
2. When ADX declines, it shows that the market is becoming less directional. There
are likely to be many whipsaws. When ADX points down, it is better not to use
a trend-following method.
3. When ADX falls below both Directional lines, it identifies a flat, sleepy mar-
ket. Do not use a trend-following system but get ready to trade, because major
trends emerge from such lulls.
4. The single best signal of the Directional system comes after ADX falls below
both Directional lines. The longer it stays there, the stronger the base for the
next move. When ADX rallies from below both Directional lines, it shows that
the market is waking up from a lull. When ADX rises by four steps
from its lowest point below both Directional lines, it “rings a bell” on a
new trend . It shows that a new bull market or bear market is being
born, depending on what Directional line is on top.
5. When ADX rallies above both Directional lines, it identifies an overheated mar-
ket. When ADX turns down from above both Directional lines, it shows that the
major trend has stumbled. It is a good time to take profits on a directional trade.
If you trade large positions, you definitely want to take partial profits.
This particular version uses DEMA (double exponential moving averages) in attempt to catch moves sooner.