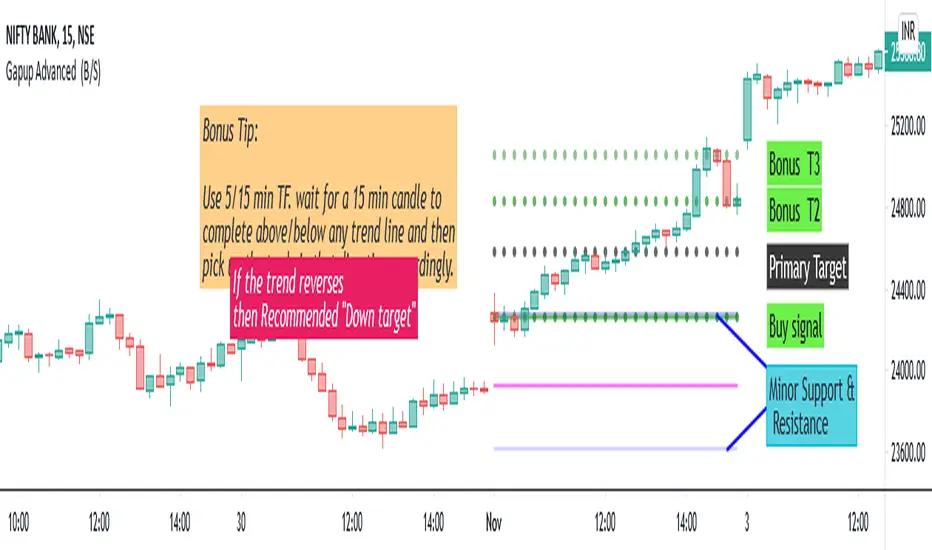
Gapup Advanced (B/S)This indicator provides you support and resistance line for Intraday trading. We have made the calculations using the historical data of (EMA 10, open ,high,low,close,52week high,52w low). We tried to capture the rapid moment of stock depending on the previous day values and EMA 10. Unlike the lagging indicator which changes the values periodically.
This is a Leading Indicator which uses TRADINGVIEW's powerful code "Resolution "-ie the indicator values will not change for the intraday, though you change to any timeframe.
Our indicator will take care of the work of conditioning and plotting and plot only if it matches all the criteria. So plotting of EMA is not required. If you want to plot EMA manually ,I would (recommend tf=15min,10ema) .
How to use this Indicator ?
When we can go long?
When you get a green line along with dot, go for BUY. Once the candle hits our target (i.e the black dotted line) close the trade and book your profits. And once the dot in the green line is off ,it means the stock will not go beyond primary target. When the dot in the green line is off, it means it has the possibility to go DOWN further.
Bonus Tip: If the 15 min candle closes above any of the trend line and in the next candle if it takes support from that line itself then it has the possibility to go up further.
When we can go short ?
When you get a red line along with dot, go for SELL. Once the candle hits our target (i.e the black dotted line) close the trade and book your profits. And once the dot in the red line is off , it means the stock will not go beyond primary target. When the dot in the red line is off, it means it has the possibility to go UP further.
Bonus Tip: If the 15 min candle closes below any of the trend line and in the next candle if it faces the resistance from that line itself then it has the possibility to go down further.
The other 2 green dotted lines/ red dotted lines are Bonus targets 2 and 3.
ie. The trend may reverse @ any point above the primary target in case of buy.
Ie. The trend may reverse @ any point below the primary target in case of sell.
To be a Consistent Profitable Trader:
Always aim for the one adjacent level above or below the current level.
Unique Feature - "THE PINK LINE"
In case of buy call, if the trend reverses we give you a recommended down target.
In case of sell call , if the trend reverses we give you a recommended up target.
Minor Support & Resistance line:
Also if the trend reverses,
In case of buy, minor support and resistance are present below.
In case of sell, minor support and resistance are present above.
It can used to trade in Options, futures ,equity. Suitable for all high moment stocks,indices, commodities.
Final Bonus Tip:
I always recommend for every trader to trade with min stock quantity eg:1-10 with any indicator/ strategy. Then you can choose to trade in lots in futures and options.
It is useful for scalpers and Intraday traders.
Recommended Time Frame : 5/15 min.
Suitable for all stocks,indices, commodities .
Trendindicator
Trend Average (Expo)
Trend Average (Expo) measures the overall trend strength and how strong the current price move/momentum is. The color of the average helps to identify the strength and momentum of the trend.
The user can enable Bar Color that coloring the candlesticks based on the trend strength.
The user can choose between different average calculations, such as SMA, WMA, HMA, to mention a few.
This indicator is for those that don't want to have the Trend Oscillator (Expo) but still want to keep track of the trend strength and direction. There is a minor difference in how the trend is calculated due to the nature of input variables.
HOW TO USE
Identify the trend strength and direction
Identify current momentum
INDICATOR IN ACTION
Daily chart
I hope you find this indicator useful , and please comment or contact me if you like the script or have any questions/suggestions for future improvements. Thanks!
I will continually work on this indicator, so please share your experience and feedback as it will enable me to make even better improvements. Thanks to everyone that has already contacted me regarding my scripts. Your feedback is valuable for future developments!
-----------------
Disclaimer
Copyright by Zeiierman.
The information contained in my scripts/indicators/ideas does not constitute financial advice or a solicitation to buy or sell any securities of any type. I will not accept liability for any loss or damage, including without limitation any loss of profit, which may arise directly or indirectly from the use of or reliance on such information.
All investments involve risk, and the past performance of a security, industry, sector, market, financial product, trading strategy, or individual’s trading does not guarantee future results or returns. Investors are fully responsible for any investment decisions they make. Such decisions should be based solely on an evaluation of their financial circumstances, investment objectives, risk tolerance, and liquidity needs.
My scripts/indicators/strategies/ideas are only for educational purposes!
ACCESS THE INDICATOR
• Contact me on TradingView or use the links below

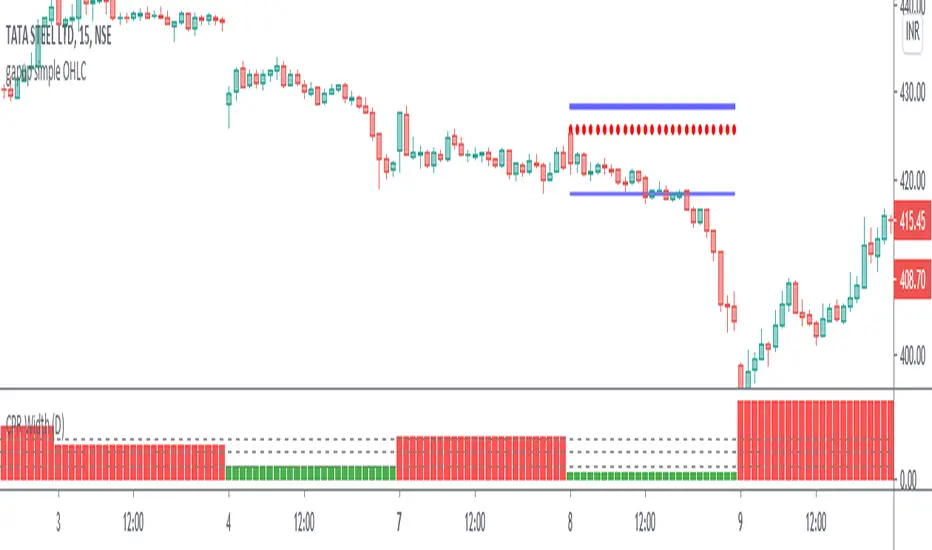
gapup simple OHLC OHLC means Open, High, Low and Close.
IFF,
Open = High. Go short. (Indicted with Red dotted line)
Open = Low. Go Long (Indicted with Green dotted line)
Using this concept with proper risk reward is the best way for intraday scalping trades with the correct time span for chart reading.
Always take a SL (stop Loss) with the previous day High & Low accordingly.
Either you go long or short,the best time to enter is 9.21-9.25am .
When you are going long,
if the candle breaks the prev day high (indicated by dark blue line) you can expect further up move.
When you are going short,
if the candle breaks the prev day low (indicated by faded blue line) you can expect further down move.
Disciplined trader :If you have missed the timings to enter please do not enter in between.wait for the next opportunity in some other day.
I want every trader to be successful for that you must be disciplined.
Enjoy the money rain.Happy Trading
Trend Algo (Zeiierman)█ Overview
Trend Algo (Zeiierman) converts raw price movement into a cohesive, volatility-aware trend map. Rather than static moving averages, it builds an adaptive trend core that responds to market state changes, then layers regime-sensitive clouds (Infinite Sky) and horizon-bounded channels (HorizonX), plus precise trend-change and continuation signals. The result is a clean framework for reading direction, timing pullbacks, and validating momentum.
The indicator visualizes the active trend line, adaptive clouds, and stateful signals to reveal transition zones, trend acceleration, and exhaustion. It suits intraday execution, swing confirmations, and structural regime assessment.
⚪ Why This One Is Unique
Unlike conventional trend tools, this version combines volatility-normalized trend estimation, AI-style regime clustering, and horizon-bounded support/resistance channels. Its framework uses multi-phase smoothing, adaptive width scaling, and state detection that aligns entries and continuations with current market inertia—reducing whipsaw while preserving responsiveness.
█ Main features
⚪ Dynamic Clouds
The Dynamic Trend Line provides a stabilized, noise-aware trajectory of price, color-coded by directional bias. Two cloud systems overlay the core trend:
Infinite Sky (AI) — a regime-aware cloud that distinguishes fast vs. slow trend states.
HorizonX — adaptive channels that operate as dynamic support/resistance and define trend boundaries.
⚪ Candle Coloring
The candle coloring is designed to highlight trend momentum peaks, allowing you to instantly recognize when the trend is accelerating or slowing down. This visual feedback makes it easier to interpret the strength and speed of directional moves directly on the chart, seamlessly complementing the Dynamic Trend Line and Cloud systems.
⚪ Trend Change Signals & Trend Continuation Signals
The main signals are the Trend Change Signals , designed to trigger when the current trend structure begins to shift its state. These signals give you an instant sense of when a potential trend reversal or directional change might occur.
To complement them, we’ve added Trend Continuation Signals , which only activate within an established trend. These signals confirm the current direction and indicate that the trend is gaining strength and preparing for another move in the same direction.
⚪ Trend Line
Two types of trend lines are integrated: Stability and Dynamic.
The Stability Line follows the current price action in a smooth, drift-like manner — staying closer to price to act as a faster support and resistance zone.
The Dynamic Line adapts to volatility, ensuring that continuous movements within the trend are taken into account. This helps traders stay aligned with the trend and capture extended moves during periods of higher market activity.
█ How to Use
⚪ Trend Changes
Trend Change Signals appear when the current trend structure begins to shift, signaling a potential reversal or directional transition. These signals help traders anticipate moments when momentum weakens or changes direction, offering early insight into possible turning points in the market. Combine Trend Change Signals with Candle Coloring or Cloud behavior to confirm entries and strengthen trend reversal validation.
⚪ Trend Continuations
Trend Continuation Signals trigger within an established trend, confirming that the current direction remains strong. They often appear after pullbacks or pauses, suggesting that the market is ready for another move in the same direction. These signals work best when paired with the Dynamic Trend Line, allowing traders to stay confidently aligned with powerful ongoing trends.
⚪ Support and Resistance
The Stability Trend Line acts as a reactive support and resistance guide, staying close to price and highlighting areas where market reactions are most likely to occur. It offers traders a clear view of short-term structure and helps identify potential bounce or rejection zones with precision.
The Dynamic Trend Line adapts to volatility, forming flexible support and resistance zones that expand during strong momentum and contract during quieter phases, keeping the visual structure balanced and responsive to changing market conditions.
HorizonX defines the outer adaptive boundaries of the trend. These dynamic channels operate as broader support and resistance frameworks, helping traders anticipate trend exhaustion or continuation zones beyond the immediate price action.
The Infinite Sky (AI) cloud adds a regime-aware layer that distinguishes fast and slow trend states, visually framing the strength of support or resistance regions as they evolve and allowing traders to read both momentum and structure in a single glance.
█ How It Works
⚪ Dynamic Trend Core
A volatility-normalized estimator generates the primary trajectory and color state, balancing stability vs. agility by adapting to dispersion and displacement.
Calculation: Multi-phase weighted smoothing with volatility-scaled adjustments and adaptive phase control to minimize lag while preserving curvature.
⚪ Infinite Sky (AI Regime Cloud)
Differentiates fast vs. slow trend states and paints a regime-aware cloud that guides timing and risk.
Calculation: Windowed return modeling (with optional consolidation), two-pole response filtering, and distribution-center clustering to classify regimes and modulate the envelope.
⚪ HorizonX Trend Channels
Defines dynamic support/resistance “horizons” that expand/contract with conditions and filter counter-trend noise when strong-trend mode is enabled.
Calculation: A volatility-aware core that evolves with changing price dynamics, maintaining precision across all market conditions.
⚪ Trend Line & Continuations
A fast reaction line confirms pullbacks and validates continuation only when aligned with prevailing bias and structure.
Calculation: Short-horizon smoothing with phase-managed weighting, slope/position gating, and context checks against regime and horizon levels.
⚪ Impulse Detection
Identifies statistically meaningful bursts that precede expansion or warn of exhaustion after extended runs.
Calculation: Nonlinear impulse-response mapping emphasizing second-order changes in directional energy while suppressing micro-noise.
⚪ Trend Bands
Upper/lower bands visualize the active envelope for timing adds, trims, or exits within trend.
Calculation: Percentile-guided banding blended with adaptive anchors to retain structural relevance through regime shifts.
⚪ Bar Color Integration
Bars can inherit trend/gradient context to make state shifts obvious at a glance.
Calculation: Algorithmic gradient model integrating directional momentum intensity to render bar coloration in sync with market flow.
-----------------
Disclaimer
The content provided in my scripts, indicators, ideas, algorithms, and systems is for educational and informational purposes only. It does not constitute financial advice, investment recommendations, or a solicitation to buy or sell any financial instruments. I will not accept liability for any loss or damage, including without limitation any loss of profit, which may arise directly or indirectly from the use of or reliance on such information.
All investments involve risk, and the past performance of a security, industry, sector, market, financial product, trading strategy, backtest, or individual's trading does not guarantee future results or returns. Investors are fully responsible for any investment decisions they make. Such decisions should be based solely on an evaluation of their financial circumstances, investment objectives, risk tolerance, and liquidity needs.
Script a pagamento

ForteTrader Heiken Multi Time Frame Trend IndicatorThis indicator is using Heiken Ashi Candle Stick System to measure three separate time frames of your choosing. Default setting is with 120 minutes, 240 minutes, and 720 minutes. Ideal for swing trading, or scalping. When two or more time frames align red, looking for short entries. When two or more green time frames align, looking for long entries. Entries and Exits are at your own discretion. This is not trading financial advice just a tool to help you all find overall confluence in your trading and direction.

[HTI2] Hiubris Trend Indicator 2This is the Study version of the Hiubris Trend Indicator 2 (Used for Alerts)
After testing several strategies for months and comparing them to the standard 'Buy and Hold' method, we've found the best performing strategy for BTCUSDT
We simplified it to make it more user-friendly (We've only added 1 optional exit: a % SL) and left all the inputs adjustable, so it can be optimized for ANY pair!
This is a Trend Indicator! This means that the '% Profitable Trades' is not the main focus, but catching every trend swing. When trying to catch every trend swing, naturally alot of the them might be unprofitable, especially in sideways markets. The idea behind this strategy is to catch all the significant trend movements, which are alot more profitable than all the 'sideway market' losses
This indicator is fully adjustable and matches exactly the published strategy!
The user has the option to setup alerts for all chart signals (Entries, Re-Entries, Stop-Loss)

[HTI2] Hiubris Trend Indicator 2 StrategyThis is the Strategy version of the HTI2 Indicator
After testing several strategies for months and comparing them to the standard 'Buy and Hold' method, we've found the best performing strategy for BTCUSDT
We simplified it to make it more user-friendly (We've only added 1 optional exit: a % SL) and left all the inputs adjustable, so it can be optimized for ANY pair!
This is a Trend Indicator! This means that the '% Profitable Trades' is not the main focus, but catching every trend swing. When trying to catch every trend swing, naturally alot of the them might be unprofitable, especially in sideways markets. The idea behind this strategy is to catch all the significant trend movements, which are alot more profitable than all the 'sideway market' losses
For that reason, we recomment backtesting on Timeframes greater than 15min. Initially we suggest you backtest without a Stop-Loss, trying multiple combinations of the 2 inputs (Length 9 to 32 / Multiplier 2 to 12)
After you found a profitable enough combination, you should look at the 'Average Losing Trade' and the 'Largest Losing Trade', then try further improving the results by setting up a Stop-Loss accordingly (if needed)
In our case, we've found that having a 2% SL (on BTCUSDT) really helps alot with those sideways market trend swings. This also allows us to comfortably us a 10x leverage
*** When using the Re-Entry feature, make sure to change the order size to contracts! Do not leave is as '% of Account' !!! ***
Some of our backtesting results
BTCUSDT 30-5 30min, 2% SL vs 'Buy and Hold'
2019 - present 697.42% vs 250%
2018 - 2019 119.42% vs -75%
EURUSD 18-6 30min, 0.6% SL
2019 - present 12.4%
AMZN 13-2 30min, 2% SL
2019- present 279.44%
XAUUSD 18-3 30min, 1.75% SL
2019- present 53.43%
BA 20-6 30min, 1.5% SL
2019- present 251.35%

Simple EMA trend indicatorSimple EMA trend indicator , pretty straightforward green equates to bullish and usually a retest/wick is often seen , same for the flipside viceversa

Trend analysis - Take Profit (Expo)Trend analysis - Take Profit (Expo)
DESCRIPTION
Trend analysis - Take Profit (Expo) indicator is developed to visualize ‘Lock In Profits -points' in trends. It’s a necessity for a professional trader to continuously ‘Lock In Profit’ in order to grow their balance and to reduce their risk. In fact, research shows that exits have more impact on the results than any other factor (Tharp, 2006). So when the indicator shows a ‘TP’ - point, start to lock in some of your profit and continuously do so on every TP - point and exit the trade when a circle is shown.
The indicator does also visualizes the current trend by the color of the cloud. Green color = positive trend. Red color = negative trend.
The professional trader will have the possibility to adjust the sensitivity of the TP - point as well as the length of the trend calculation.
HOW TO USE
1. Use this indicator to identify when to Lock In Profits in trends.
2. Use the indicator to identify trends.
3. Use the indicator to identify a trend shift.
INDICATOR IN ACTION
BTCUSD
BTCUSD
EURUSD
BRENT
EURGBP
The indicator works with RENKO, HEIKIN ASHI and with KAGI charts as well.
I hope you find this indicator useful, and please comment or contact me if you like the script or have any questions/suggestions for future improvements. Thanks!
I will continue to work on this indicator, so please share your experience and feedback with me so that I can continuously improve it. Thanks to everyone that have contacted me regarding my scripts. Your feedback is valuable for future developments!
ACCESS THE INDICATOR
• Contact me on TradingView or use the links below
-----------------
Disclaimer
Copyright by Zeiierman.
The information contained in my scripts/indicators/ideas does not constitute financial advice or a solicitation to buy or sell any securities of any type. I will not accept liability for any loss or damage, including without limitation any loss of profit, which may arise directly or indirectly from use of or reliance on such information.
All investments involve risk, and the past performance of a security, industry, sector, market, financial product, trading strategy, or individual’s trading does not guarantee future results or returns. Investors are fully responsible for any investment decisions they make. Such decisions should be based solely on an evaluation of their financial circumstances, investment objectives, risk tolerance, and liquidity needs.
My scripts/indicators/ideas are only for educational purposes!

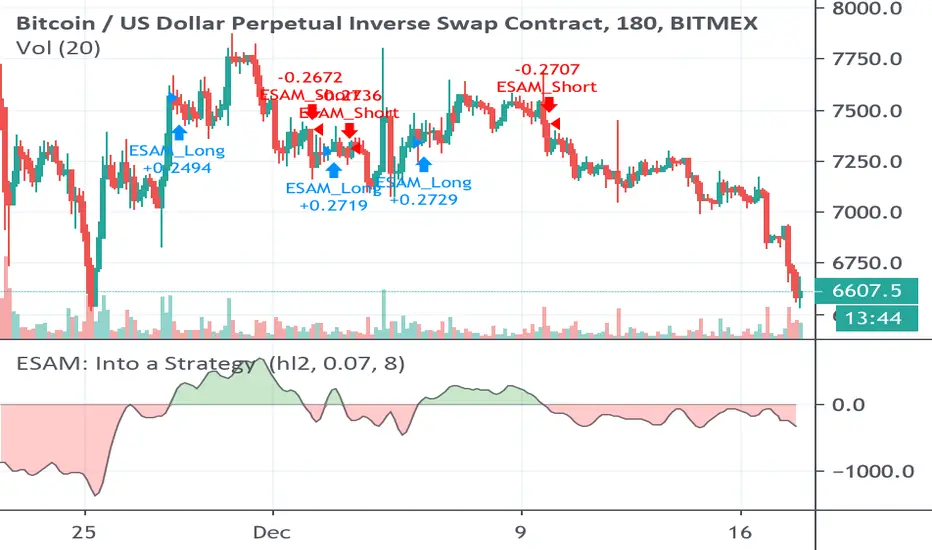
Strategy based on Ehlers Smoothed Adaptive Momentum [LazyBear]Strategy based on Ehlers Smoothed Adaptive Momentum (ESAM) indicator by LazyBear, slightly improved.
Indicator itself was developed and described by John F. Ehlers in his book "Cybernetic Analysis for Stocks and Futures" (2004, Chapter 12: Adapting to the Trend).
Backtesting: XBTUSD (Bitmex): 2h, 3h, 4h
FxCanli_TrendFxCanli_Trend
This indicator will help you to show the way of the trend
When the candles are;
Green Candles - Up Trend
Yellow Candles - Trend may Change
Red Candles - Down Trend

Megalodon Pro Automated Longer Term TraderHow to use?
Yellow line isolates between 0-100.
It should be used on DAILY time frame for understanding the market state.
It prints Green for Bull - Orange for Strong Bull - Red for Bear - Purple for Strong Bear signals.

[HTI] Hiubris Trend Indicator 1.4Hiubris Trend Indicator is super easy to use.
The Indicator includes Long and Short signals on chart, based on the current Trend direction - These signals can be also set up as Alerts.
It also includes multiple partial Exit Points (Take Profits) that can be used to lock in the profit you have made - These signals can be also set up as Alerts.
The Take Profits have a custom input that can be adjusted by the user regarding the frequency of the take profits - (The risk involved in each trade)
The indicator has a special Stop Loss feature that activates after a certain custom number of Take Profit points passed, locking down your profits you have made so far - These signals can be also set up as Alerts.
Hiubris Trend Indicator is very profitable on higher timeframes (45min, 2h, 4h) - It can also be used on lower timeframes, together with another HigherTimeframe Trend indicator, acting as a filter for the alerts (Ex: Hiubris Long Term Trend)

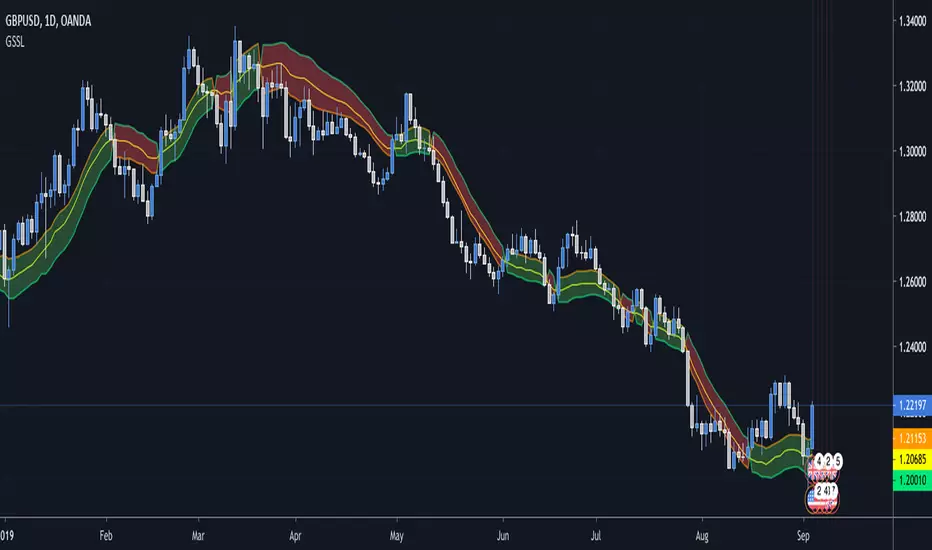
Generalized SSL by Vts// Generalized SSL:
// This is the very first time the SSL indicator, whose acronym I ignore, is on Tradingview.
// It is based on moving averages of the highs and lows.
// Similar channel indicators can be found, whereas
// this one implements the persistency inside the channel, which is rather tricky.
// The green line is the base line which decides entries and exits, possibly with trailing stops.
// With respect to the original version, here one can play with different moving averages.
// The default settings are (10,SMA)
//
// Vitelot/Yanez/Vts March 2019
Dream Indicator v 1.0UNDER DEVELOPMENT - PRIVATE RELEASE ONLY
Dream Indicator v 1.0
A trend following indicator optimized for use with heikin ashi charts.
Keeps you in a trade, and provides entry/exit points.
Effective across all time frames (higher is better, as with all indicators). MTF capable to provide either long-term trend following (higher time frame), or quicker entry/exit signals (lower time frame).
Requires a trade bias (e.g. divergence, support/resistance, 200 period MA).
This is a private release only, so I can grant access to specific users for feedback. A public release MAY follow in the future. Register your interest in the comments or PM me.

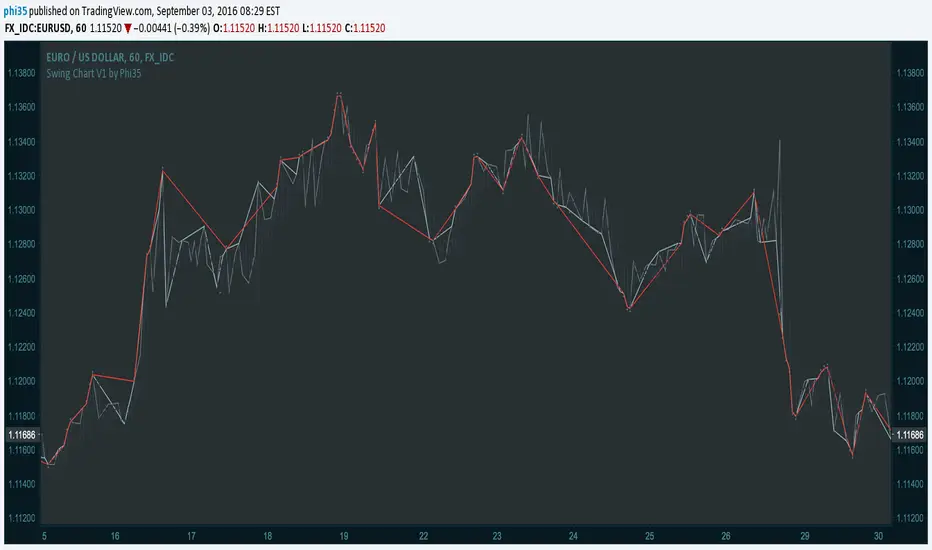
Swing Chart V1 by Phi35 © With this indicator, which plots the swing chart of the 3 degrees, swing traders can automate their work of tracking the right bars.
How it works:
Minor Degree (one bar) (gray)= If the current high is higher than the previous high or the current low is lower than the previous low.
Intermediate Degree (two bar) (baby blue)= If the current high is higher than previous and the penultimate high etc.
Main Degree (three bar) (red)= If the current high is higher than the previous, the penultimate and the high before penultimate high etc.
Alert:
On crossover there will be an alert (popup with a message) and in addition you will see "diamonds" on the place where the crossover took place
If there is an issue or any suggestions, feel free to contact me. Do not modify the code without permission.
Swing Chart V1 by Phi35 ©