[tradinghook] - Renko Trend Reversal Strategy - Renko Trend Reversal Strategy
Short Title: - Renko TRS
Description:
The Renko Trend Reversal Strategy ( - Renko TRS) is a powerful and original trading approach designed to identify trend reversals in financial markets using Renko charts. Renko charts differ from traditional time-based charts, as they focus solely on price movements and ignore time, resulting in a clearer representation of market trends. This strategy leverages Renko charts in conjunction with the Average True Range (ATR) to capture trend reversals with high precision and effectiveness.
Key Concepts:
Renko Charts: Renko charts are unique chart types that only plot price movements beyond a predefined brick size, ignoring time and noise. By doing so, they provide a more straightforward depiction of market trends, eliminating insignificant price fluctuations and making it easier to spot trend reversals.
Average True Range (ATR): The strategy utilizes the ATR indicator, which measures market volatility and provides valuable insights into potential price movements. By setting the brick size of the Renko chart based on the ATR, the strategy adapts to changing market conditions, ensuring optimal performance across various instruments and timeframes.
How it Works:
The Renko Trend Reversal Strategy is designed to identify trend reversal points and generate buy or sell signals based on the following principles:
Renko Brick Generation: The strategy calculates the ATR over a user-defined period (ATR Length) and utilizes this value to determine the size of Renko bricks. Larger ATR values result in bigger bricks, capturing higher market volatility, while smaller ATR values create smaller bricks for calmer market conditions.
Buy and Sell Signals: The strategy generates buy signals when the Renko chart's open price crosses below the close price, indicating a potential bullish trend reversal. Conversely, sell signals are generated when the open price crosses above the close price, suggesting a bearish trend reversal. These signals help traders identify potential entry points to capitalize on market movements.
Stop Loss and Take Profit Management: To manage risk and protect profits, the strategy incorporates dynamic stop-loss and take-profit levels. The stop-loss level is calculated as a percentage of the Renko open price, ensuring a fixed risk amount for each trade. Similarly, the take-profit level is set as a percentage of the Renko open price to secure potential gains.
How to Use:
Inputs: Before using the strategy, traders can customize several parameters to suit their trading preferences. These inputs include the ATR Length, Stop Loss Percentage, Take Profit Percentage, Start Date, and End Date. Adjusting these settings allows users to optimize the strategy for different market conditions and risk tolerances.
Chart Setup: Apply the - Renko TRS script to your desired financial instrument and timeframe on TradingView. The Renko chart will dynamically adjust its brick size based on the ATR Length parameter.
Buy and Sell Signals: The strategy will generate green "Buy" labels below bullish reversal points and red "Sell" labels above bearish reversal points on the Renko chart. These labels indicate potential entry points for long and short trades, respectively.
Risk Management: The strategy automatically calculates stop-loss and take-profit levels based on the user-defined percentages. Traders can ensure proper risk management by using these levels to protect their capital and secure profits.
Backtesting and Optimization: Before implementing the strategy live, traders are encouraged to backtest it on historical data to assess its performance across various market conditions. Adjust the input parameters through optimization to find the most suitable settings for specific instruments and timeframes.
Conclusion:
The - Renko Trend Reversal Strategy is a unique and versatile tool for traders looking to identify trend reversals with greater accuracy. By combining Renko charts and the Average True Range (ATR) indicator, this strategy adapts to market dynamics and provides clear entry and exit signals. Traders can harness the power of Renko charts while effectively managing risk through stop-loss and take-profit levels. Before using the strategy in live trading, backtesting and optimization will help traders fine-tune the parameters for optimal performance. Start exploring trend reversals with the - Renko TRS and take your trading to the next level.
(Note: This description is for illustrative purposes only and does not constitute financial advice. Traders are advised to thoroughly test the strategy and exercise sound risk management practices when trading in real markets.)
Trendreversal

Above/Below Average Index US Top 40 [Pt]█ Introduction
Introducing the "Above/Below Average Index US Top 40 ", a comprehensive market sentiment visualization tool. This powerful and easy-to-use indicator allows users to get a direct measure of market sentiment by analyzing the status of a chosen group of stocks (Top 10, Top 20, Top 30, or Top 40) in relation to their chosen moving average. The sum of stocks either above or below their respective moving averages can be an insightful indicator of the market's overall trend and bias.
The power of this tool lies in its ability to measure the net number of these top stocks either above or below their respective moving averages. A positive value, represented by green histogram bars, signifies a bullish bias among the Top 40 stocks, while a negative value, displayed as red histogram bars, suggests a bearish sentiment.
The indicator can be applied to both the NYSE and NASDAQ markets, offering users the flexibility to select their preferred stock exchange. The Top 40 stocks within these markets are customizable, ensuring you have full control over which companies are included in your market sentiment analysis.
The indicator also includes dual moving average lines representing the fast and slow moving averages of the sum of stocks above or below their chosen moving average. These lines serve as an invaluable trend analysis resource, providing a visual representation of short-term and long-term market trends, as well as potential trend reversals
█ Potential Uses
The indicator presents numerous application possibilities. Here are a few ways this tool can be utilized:
► Market Sentiment Gauge: Depending on the number of stocks chosen (Top 10, 20, 30, or 40), this tool can offer a broad or more focused gauge of overall market sentiment. A high positive value suggests strong bullish sentiment, while a high negative value can indicate bearish sentiment.
► Identification of Market Trends: By looking at the colors of the histogram bars and their corresponding values, users can identify whether the overall market trend is bullish (green) or bearish (red).
► Trend Confirmation and Reversal Identification: The dual moving average lines offer a powerful way to confirm market trends and identify potential trend reversals. For instance, a crossover of these lines (when the fast moving average line crosses the slow line) can signal a shift in market momentum, often indicating a possible trend reversal. Also, to confirm a bullish trend, for example, the fast moving average should be above the slow moving average line.
► Comparison of Different Markets: By switching between NYSE and NASDAQ, users can compare market sentiments across the two major stock exchanges. This could potentially highlight divergences or confirm similarities in market behavior.
► Customized Analysis: With the ability to customize the Top 40 stocks used in the calculation, users can refine their analysis to focus on the sectors or industries they are most interested in.
Remember, while this tool provides a visual representation of market sentiment, it is important to use it in conjunction with other forms of analysis to make informed trading decisions.
=====================================================================================================
█ Setting Highlights
Moving Average Type options:
◊ Simple Moving Average (SMA): The SMA is the average stock price over a certain period and gives equal weight to all price points, providing a clear view of overall trends but responding slower to recent price changes.
◊ Exponential Moving Average (EMA): The EMA gives more weight to recent prices and responds quicker to price changes than the SMA, making it more suitable for traders looking to capture short-term trends.
◊ Smoothed Moving Average (SMMA/RMA): The SMMA or RMA minimizes the impact of random price spikes and smoothens out the data, offering a balanced view of long-term and short-term trends.
◊ Weighted Moving Average (WMA): The WMA assigns more weight to recent data points, offering a faster response to recent price changes than SMA but slower than EMA.
◊ Volume Weighted Moving Average (VWMA): The VWMA takes into account both the closing price and volume of the stocks, offering insights into both price movement and trading activity.
◊ Hull Moving Average (HMA): The HMA is designed to reduce lag and improve smoothness, providing faster signals for trend changes, which is ideal for traders looking for quick entry and exit points.

Master Trend ReversalThe 'Master Trend Reversal' strategy is an innovative approach to detecting trend reversals in the market. This strategy harnesses the power of 'Pin Bars', a specific type of candlestick, to pinpoint potential trading opportunities.
Based on the properties of Pin Bars, this strategy identifies scenarios where the market is likely to reverse its trend. In particular, it seeks out Pin Bars that are significantly longer than their surrounding candles, a length determined by the 'Pin Bar Size (%)' parameter.
When a bullish Pin Bar is detected (i.e., the closing price is lower than the opening price, and the gap between the opening and low prices exceeds the specified Pin Bar size), the strategy goes long. Conversely, upon identifying a bearish Pin Bar (the closing price is higher than the opening price, and the difference between the high and opening prices is greater than the specified Pin Bar size), the strategy goes short.
Furthermore, 'Master Trend Reversal' incorporates an efficient risk management mechanism via stop-loss orders. The stop-loss level is calculated based on the average price of the position and the 'Stop Loss Percentage (%)' as specified by the user.
Hence, the 'Master Trend Reversal' strategy offers a unique approach to capitalize on market trend reversals while limiting potential losses through the use of stop-loss orders. This combination of precise trend reversal detection and robust risk management makes this strategy particularly useful for traders seeking to maximize their profits while effectively controlling their risk exposure.
Please remember that, like any trading strategy, 'Master Trend Reversal' does not guarantee success and should be used as part of a holistic risk management approach in the markets.

Standardized MACD Heikin-Ashi TransformedThe Standardized MACD Heikin-Ashi Transformed (St. MACD) is an advanced indicator designed to overcome the limitations of the traditional MACD. It offers a more robust and standardized measure of momentum, making it comparable across different timeframes and securities. By incorporating the Heikin-Ashi transformation, the St. MACD provides a smoother visualization of trends and potential reversals, enhancing its utility for traders seeking a clearer view of the underlying market direction.
Methodology:
The calculation of St. MACD begins with the traditional MACD, which computes the difference between two exponential moving averages (EMAs) of the price. To address the issue of non-comparability across assets, the St. MACD normalizes its values using the exponential average of the price's height. This normalization process ensures that the indicator's readings are not influenced by the absolute price levels, allowing for objective and quantitatively defined comparisons of momentum strength.
Furthermore, St. MACD utilizes the Heikin-Ashi transformation, which involves deriving candles from the price data. These Heikin-Ashi candles provide a smoother representation of trends and help filter out noise in the market. A predictive curve of Heikin-Ashi candles within the St. MACD turns blue or red, indicating the prevailing trend direction. This feature enables traders to easily identify trend shifts and make better informed trading decisions.
Advantages:
St. MACD offers several key advantages over the traditional MACD-
Standardization: By normalizing the indicator's values, St. MACD becomes comparable across different assets and timeframes. This makes it a valuable tool for traders analyzing various markets and seeking consistent momentum measurements.
Heikin-Ashi Transformation: The integration of the Heikin-Ashi transformation smoothes out the indicator's fluctuations and enhances trend visibility. Traders can more easily identify trends and potential reversal points, improving their market analysis.
Quantifiable Momentum: St. MACD's key levels represent the strength of momentum, providing traders with a quantifiable framework to gauge the intensity of market movements. This feature helps identify periods of increased or decreased momentum.
Utility:
The St. MACD indicator offers versatile utility for traders-
Trend Identification: Traders can use the color-coded predictive curve of Heikin-Ashi candles to swiftly determine the prevailing trend direction. This aids in identifying potential entry and exit points in the market.
Reversal Signals: Colored extremes within the St. MACD signal potential price reversals, alerting traders to potential turning points in the market. This assists in making timely decisions during market inflection points.
Overbought/Oversold Conditions: The histogram version of St. MACD can be used in conjunction with the bands to detect short-term overbought or oversold market conditions, allowing traders to adjust their strategies accordingly.
In conclusion, this tool addresses the limitations of the traditional MACD by providing a standardized and comparable momentum indicator. Its incorporation of the Heikin-Ashi transformation enhances trend visibility and assists traders in making more informed decisions. With its quantifiable momentum measurements and various utility features, the St. MACD is a valuable tool for traders seeking a clearer and more objective view of market trends and reversals.
Key Features:
Display Modes: MACD, Histogram or Hybrid
Reversion Triangles by adjustable thresholds
Bar Coloring Methods: MidLine, Candles, Signal Cross, Extremities, Reversions
Example Charts:
-Traditional limitations-
-Comparisons across time and securities-
-Showcase-
See Also:
-Other Heikin-Ashi Transforms-

Days Higher Than Current PriceThe "Days Higher Than Current Price" indicator is a color-coded tool that provides insights into the historical price performance of an underlying asset. By analyzing the number of bars prior to the selected day that had higher closing prices, this indicator visually represents the comparative strength or weakness of the current price level.
The "Days Higher" indicator utilizes a color-coded scheme to indicate the number of days in the asset's price history where the closing prices were higher than the current day's price. The color spectrum ranges from red to blue, representing varying levels of historical price strength.
Color Coding:
The color coding scheme of the indicator offers a quick and intuitive understanding of the price performance:
Red: Represents a higher number of days in the asset's price history where the closing prices were higher than the current day's price. This suggests a weaker price trend or a potential reversal and indicates relative price weakness.
Blue: Represents a lower number of days in the asset's price history where the closing prices were higher than the current day's price. This indicates a strong trend of higher prices and suggests relative price strength.
Orange & Green: Correspond to different numbers of days where the closing prices were higher than the current day's price. The specific color gradations between red and blue reflect increasing or decreasing historical price strength.
Methodology:
The "Days Higher" indicator examines each bar in the asset's price history leading up to the selected day. It counts the number of bars where the closing prices were higher than the current day's price.
The indicator then assigns a specific color to the price chart based on the count of such days, providing a visual representation of historical price strength relative to the current price level.
Utility:
The "Days Higher" indicator offers traders and investors a unique perspective on the historical price performance of an asset. By assessing the color-coded chart, market participants can quickly gauge the presence of strong or weak historical price trends.
This information can be used to identify potential support or resistance levels, assess the overall strength of a trend, or evaluate the likelihood of a price reversal. Traders may incorporate this indicator into their analysis to make more informed trading decisions based on the historical price strength indicated by the color-coded chart.
It is important to note that this tool should be used in conjunction with other technical analysis tools and indicators to validate signals and make well-rounded trading decisions.
Example Charts:
-Indices-
-Stocks-
-Cryptos-
-Multi-Timeframe-

Z-Score Heikin-Ashi TransformedThe Z-Score Heikin-Ashi Transformed (𝘡 𝘏-𝘈) indicator is a powerful technical tool that combines the principles of Z-Score and Heikin Ashi to provide traders with a smoothed representation of price movements and a standardized measure of market volatility.
The 𝘡 𝘏-𝘈 indicator applies the Z-Score calculation to price data and then transforms the resulting Z-Scores using the Heikin Ashi technique. Understanding the individual components of Z-Score and Heikin Ashi will provide a foundation for comprehending the methodology and unique features of this indicator.
Z-Score:
Z-Score is a statistical measure that quantifies the distance between a data point and the mean, relative to the standard deviation. It provides a standardized value that allows traders to compare different data points on a common scale. In the context of the 𝘡 𝘏-𝘈 indicator, Z-Score is calculated based on price data, enabling the identification of extreme price movements and the assessment of their significance.
Heikin Ashi:
Heikin Ashi is a popular charting technique that aims to filter out market noise and provide a smoother representation of price trends. It involves calculating each candlestick based on the average of the previous candle's open, close, high, and low prices. This approach results in a chart that reduces the impact of short-term price fluctuations and reveals the underlying trend more clearly.
Methodology:
The 𝘡 𝘏-𝘈 indicator starts by calculating the Z-Score of the price data, which provides a standardized measure of how far each price point deviates from the mean. Next, the resulting Z-Scores are transformed using the Heikin Ashi technique. Each Z-Score value is modified according to the Heikin Ashi formula, which incorporates the average of the previous Heikin Ashi candle's open and close prices. This transformation smooths out the Z-Score values and reduces the impact of short-term price fluctuations, providing a clearer view of market trends.
This tool enables traders to identify significant price movements and assess their relative strength compared to historical data. Positive transformed Z-Scores indicate that prices are above the average, suggesting potential overbought conditions, while negative transformed Z-Scores indicate prices below the average, suggesting potential oversold conditions. Traders can utilize this information to identify potential reversals, confirm trend strength, and generate trading signals.
Utility:
The indicator offers valuable insights into price volatility and trend analysis. By combining the standardized measure of Z-Score with the smoothing effect of Heikin Ashi, traders can make more informed trading decisions and improve their understanding of market dynamics. 𝘡 𝘏-𝘈 can be used in various trading strategies, including identifying overbought or oversold conditions, confirming trend reversals, and establishing entry and exit points.
Note that the 𝘡 𝘏-𝘈 should be used in conjunction with other technical indicators and analysis tools to validate signals and avoid false positives. Additionally, traders are encouraged to conduct thorough backtesting and experimentation with different parameter settings to optimize the effectiveness of the indicator for their specific trading approach.
Key Features:
Optional Reversion Doritos
Adjustable Reversion Threshold
2 Adjustable EMAs
Example Charts:
See Also:
On Balance Volume Heikin-Ashi Transformed
Trendline Pivots [QuantVue]Trendline Pivots
The Trend Line Pivot Indicator works by automatically drawing and recognizing downward trendlines originating from and connecting pivot highs or upward trendlines originating from and connecting pivot lows.
These trendlines serve as reference points of potential resistance and support within the market.
Once identified, the trend line will continue to be drawn and progress with price until one of two conditions is met: either the price closes(default setting) above or below the trend line, or the line reaches a user-defined maximum length.
If the price closes(default setting) above a down trend line or below an up trend line, an "x" is displayed, indicating the resistance or support has been broken. At the same time, the trend line transforms into a dashed format, enabling clear differentiation from active non-breached trend lines.
This indicator is fully customizable from line colors, pivot length, the number lines you wish to see on your chart and works on any time frame and any market.
Don't hesitate to reach out with any questions or concerns.
We hope you enjoy!
Cheers.

Dynamic Trendlines Multi-TimeframeThe Dynamic Trendlines indicator is a useful tool for traders to identify potential support and resistance levels in the market. By analyzing price volatility and drawing trendlines based on high volatility candles, it helps traders visualize key price levels that may influence future price action. This indicator uses the Average True Range (ATR) as a measure of price volatility to determine the threshold for high volatility candles. This indicator can be used on multiple time frames, so just choose which one works best for you!
The underlying concept of this indicator revolves around the calculation of the True Range and Average True Range. The True Range is the maximum value among the difference between the current high and low, the absolute value of the difference between the current high and previous close, and the absolute value of the difference between the current low and previous close. The ATR is then calculated as the simple moving average of the True Range over a user-defined period (default is 14). The threshold for high volatility candles is determined by multiplying the ATR by a user-defined multiplier (default is 1.5).
The indicator identifies high volatility candles when the closing price is greater than the previous closing price plus the threshold. Based on the price action, trendlines are drawn connecting the high or low of high volatility candles. The initial color and style of the trendline are determined by whether the price is moving up or down. Green solid lines represent upward price movement, while red solid lines represent downward price movement.
As the price crosses the trendlines, the indicator tracks the number of crosses and updates the line's style accordingly. If the price crosses a trendline twice, the line style is changed to dashed, indicating the potential weakening of the support or resistance level.
This indicator works best with trading methods that focus on capturing price breakouts or reversals. Traders can use the trendlines to identify potential entry or exit points, stop-loss levels, or take-profit targets. It's important to note that this indicator should be used in conjunction with other technical analysis tools and an understanding of the overall market context to make informed trading decisions.
When using the Dynamic Trendlines indicator on TradingView, users can customize the ATR length, threshold multiplier, and the number of recent trendlines displayed on the chart. Additionally, small triangles are plotted below high volatility candles, with their color based on the trendline it starts, providing a quick visual reference for traders.
In summary, the Dynamic Trendlines indicator is a valuable tool for identifying potential support and resistance levels in the market by analyzing price volatility and drawing trendlines based on high volatility candles. It is best suited for breakout and reversal trading strategies and should be used in conjunction with other technical analysis tools for optimal results.

Risk-Adjusted Return OscillatorThe Risk-Adjusted Return Oscillator (RAR) is designed to aid traders in predicting future price action by analysing the risk-adjusted performance of an asset. This oscillator is displayed directly on the price chart, unlike other oscillators.
By considering the risk-return relationship, the indicator helps identify periods of overvaluation or undervaluation, allowing traders to anticipate potential price reversals or trend accelerations.
HOW TO USE
The Risk-Adjusted Return Oscillator analyses the risk-adjusted performance of an asset to detect price reversals and accelerations. Here's how to interpret its signals:
Ranging Market:
Overbought Signal: When the RAR curve reaches the overbought level (upper red line), it suggests a potential reversal signal. It indicates that the asset may be overvalued, and a price correction or trend reversal could occur.
Oversold Signal: When the RAR curve reaches the oversold level (lower red line), it indicates a potential reversal signal. It suggests that the asset may be undervalued, and a price correction or trend reversal could take place.
Trending Market:
Overbought Signal: In a trending market, an overbought signal (RAR curve reaching upper red line) suggests trend acceleration. It indicates that the existing trend is gaining strength, and buying pressure is increasing.
Oversold Signal: In a trending market, an oversold signal (RAR curve reaching lower red line) also signifies trend acceleration. It suggests that the prevailing trend is intensifying, and selling pressure is increasing.
Thus, it's important to consider the market context when interpreting overbought and oversold signals. In ranging markets, these signals act as potential reversal points. However, in trending markets, they indicate trend acceleration, reinforcing the current price direction.
SETTINGS
Period Length: Adjust the number of bars used to calculate returns and standard deviation.
Smoothing: Define the smoothing period for the RAR curve.
Show Overbought/Oversold Signals: Choose whether to display triangular shapes for overbought and oversold conditions.

The HoneyChai RSI by CoffeeShopCryptoHere is a fun new way to view the RSI. A new TradingView Indicator for you RSI enthusiasts. This is the Honey Chai RSI Indicator.
This indicator combines the RSI oscillator with additional features to enhance its functionality and visual study.
The purpose of this indicator is to provide a more comprehensive view of the RSI and aid in identifying trends, potential entry / exit points, and ranging conditions.
How it's Built.
The RSI:
The RSI is represented by its common line which you can turn on and off, as usual.
Japanese candlesticks:
In this indicator, are also Japanese candlesticks giving you their representation of the RSI. This provides a clearer visualization of the RSI movements across its Open, High, Low, and Close, unlike the OHLC of the Heiken Ashi candles in the Heiken Ashi Algo.
In addition to the RSI line and Japanese candles, there are two moving averages applied to the RSI value. For the purpose of keeping with my CoffeeShop theme, the High average line is the Honey Line and the Low average line is the Chai Line. The user can choose between Exponential Moving Average or Simple Moving average. These moving averages are calculated based on the high vs low values of the past RSI readings, with the high average acting as the leading line.
When the Honey line is above the Chai Line, it indicates an uptrend, whereas when the Honey Line is below the Chai Line, it suggests a downtrend.
If the price is moving up but the Honey line is still below the Chai line, you're technically still in a downtrend and you should trade this like a pullback.
Identifying Trends.
To identify short entries, you need to wait for the Japanese candles to open and close below the Honey line while the Honey line is below the Chai Line. Conversely, you wait for the Japanese candles to open and close above the Honey line while the Honey line is above the Chai Line. This confirmation helps in identifying potential reversal points.
Range Bound Market.
The indicator also incorporates a visual representation of a ranging area. The 60 and 40 levels of the RSI are visually differentiated to indicate this range. When the Japanese candles are opening and closing within this range and the RSI remains contained within these levels, it suggests that the price is likely in a ranging phase, and traders should wait for a breakout from this range before taking action.
In summary, this custom indicator provides a comprehensive view of the RSI oscillator by incorporating Japanese candlestick visuals, moving averages, and a visual representation of the ranging area. By analyzing these elements, traders can gain insights into trends, potential entry points, and ranging conditions in the market.
---------HOW TO TRADE-----------
LONGS AND SHORTS
An example on how to use this in a long trade is to wait for your moving averages to be high (yellow) over low (orange). For the purpose of the description in this indicator you're looking for the honey to be over the chai.
Even if the RSI and Japanese candles in the oscillator are falling, however the honey is above the Chai, you are still in an uptrend.
The positioning of the moving averages will always determine the direction of the overall price trend so in this position you're looking for long entries.
take a long position as an entry when the open and the close of the Japanese candle in the oscillator is above your honey line.
when you notice a bearish candle closing below the honey line in an uptrend position you can exit your trade.
Confluence for short trades would be just the opposite and using the moving averages in an upside down pattern. In other words the honey needs to be below the chai and your Japanese candle needs to be closing bearish however they open and the close of that candle needs to be below both of your moving averages. exit when you get a bullish candle closing in between the averages.
TRADING RANGES
Wait for your moving average to enter into the range bound 60/40 area as well as your Japanese candles to Wick above and below this area but not close above and below the area.
At this point you can mark off the high and the low of the range as it pertains to your price chart and start using your range trading strategy.

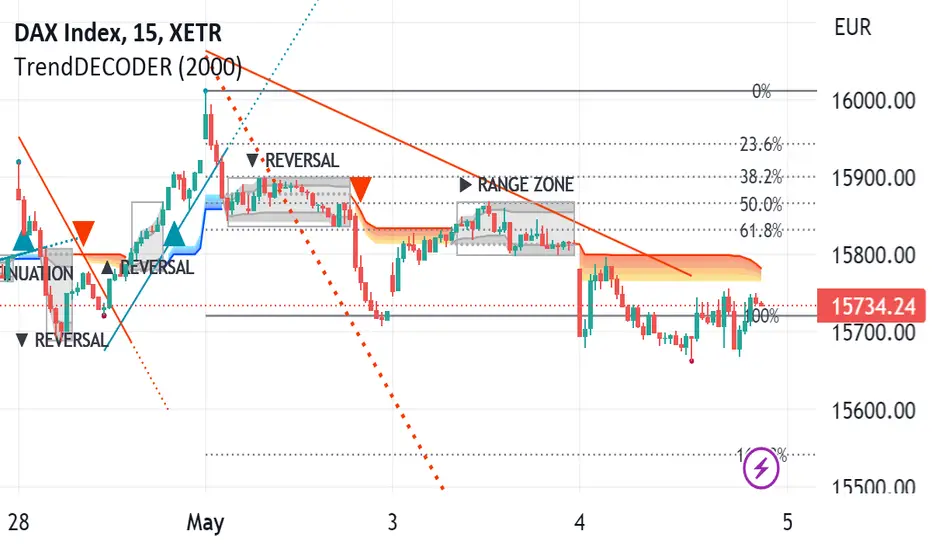
TrendDECODER by MetaSignalsProTrendDECODER
The fastest indicator to detect trends and price ranges
-------------------------------------------------------------------
✔️ Identify ranges and the next probable direction
✔️ Get the earliest signals and the strength of Trends
✔️ Get clear exits signals before reversal
✔️ Spot the Fibo levels the price will test
-------------------------------------------------------------------
📌 What is it about ?
--------------------------
TrendDECODER is a concentrate of multiple innovations to make Trend following simple and easy.
Please see in the 🛠️ Calculation & Precisions section at the end of this page to know more how they work.
👉 With the GreyBox - identify when the market gets out of the Trend with a new sequence of transition. Check if the market is in Range, Continuation or Reversal (Up or Down) and wait for the closing of the box to get the Trend signal.
👉 With the DecoderSignals & Blue/Orange Clouds - once the GreyBox has delivered its message, get the new direction of the Trend and see the probable zones of pull backs during the current direction.
👉 With the Projective TrendLine - see before it happens the direction and the possible angle of the Trend with its probable range.
👉 With the RealTime TrendLine vs the Projective TrendLine - adjust immediately if the market accelerates North or South.
👉 With the RealTime TrendLine Crossing - detect at the earliest the moment the Trend gets out of track, to get out of the train.
👉 With the FiboLevels - spot immediately which price levels the market will test.
📌 For which asset?
-----------------------
TrendDECODER is universal : it works fine on all assets and all time-frames;
☝️ always work on a multi-timeframe environment to minimize risk;
📌Why we made these innovations?
---------------------------------------------
Because the trend indicators that we know, lag a lot and do not clearly identify ranges!
We need much more powerful tools than Supertrend or a couple of moving averages crossings to get this done.
📌 How to trade with TrendDECODER?
----------------------------------------------
🔹 Strategy #1: Trend Following : DecoderSignals & Blue/Orange Clouds
----------------------------------------------------------------------------------------
The GreyBOX has given the next probable movement and the Signal of a Trend in on.
The RealTime TrendLine guides us on the pace of this movement and the Blue/ Orange/Cloud figures the support/resistance of this movement.
It will be wise not to jump immediately in the Trend as the signal appears as the price will very probably make a pullback in direction of the cloud first.
🔹 Strategy #1: Checklist
📍 Set a Multi Time Frame environment
📍 Main Time Frame and the Upper Time Frame are moving in the same direction (Up or Down)
📍 Main Time Frame: appearance of the « TrendUp Signal » or the « TrendDown Signal »
📍 Entry:
☝️ buying « at Market » immediately on a « Trend Signal » is quite risky as many times the price will pull back near the Clouds
👉 a good option is to buy 1/2 the position at market on signal
👉 and 1/2 after the first pull back
📍 First Stop Loss: place your SL under the lower border of the GreyBox for an expected TrendUp or the higher border for an expected TrendDown
📍 BreakEven: when the price reaches your Risk/Reward ratio of 1 = Distance StopLoss vs Entry = Distance Current Price vs Entry
📍 Trailing Stop: just under the lowest border of the Blue Cloud (TrendUp) or the highest border of the Orange Cloud (TrendDown)
📍 TakeProfits: in a TrendUP, place your take profits just under the FibosLevels in order not to get exited (and above in a TrendDOWN)
📍 Exits:
👉 Early option : Crossing of the RealTime TrendLine
👉 Late option : Crossing of the Blue/Orange cloud
🔹 Strategy #2: Early Trend following : RealTime TrendLine Crossing
-------------------------------------------------------------------------------------
With this simple tool, get a very early signal of a probable inversion of the current Trend, way before the Decoder Signal is shown, once confirmed by the GreyBOX.
🔹 Strategy #2: Checklist
📍 Set a Multi Time Frame environment
📍 Main Time Frame and the Upper Time Frame are moving in the same direction (Up or Down)
📍 Entry (Main Time Frame): wait for the Close crossing over the ReaTime TrendLine in an expected TrendUp (under for a TrendDown )
📍 First Stop Loss (Main Time Frame):
👉 place your SL under the lower low of the GreyBOX (for an expected TrendUp) or the higher high (for an expected TrendDown)
📍 BreakEven: move your SL to Entry price when the price reaches your Risk/Reward ratio of 1 = Distance StopLoss vs Entry = Distance Current Price vs Entry
📍 Trailing Stop: just under the lowest border of the Blue Cloud (TrendUp) or the highest border of the Orange Cloud (TrendDown)
📍 TakeProfits: in a TrendUP, place your take profits just under the FibosLevels in order not to get exited (and above in a TrendDOWN)
📍 Exits:
👉 Early option : Crossing of the RealTime TrendLine
👉 Late option : Crossing of the Blue/Orange cloud
🎛️ Configuration
---------------------
Well, basically you do not have to do anything !
But you can make TrendDECODER perfectly yours with a few switches in the configuration panel to make appear or disappear each one of the elements composing TrendDECODER.
🛠️ Calculation & Precisions
------------------------------------
🔹 Blue/Orange Clouds
The Blue/Orange Clouds are a proprietary synthesis of Price Action and Volume Exchange in real time.
🔹 Projective TrendLine
As soon as a new high or a new low has been reached during the last move, TrendDECODER traces a possible angle of the future movement based on the pace of the last one in the same direction.
The distance between the Projective TrendLine and the Last Lowest (resp. Highest) gives you a possible bottom (resp. top) of the price range.
🔹 RealTime TrendLine
As soon as the Decoder GreyBox has delivered its information i.e Range/Continuation/ReversalUp/ReversalDown and that a New High (resp. New Low) has been reached, the RealTime TrendLine starts to show the pace and the angle of the new movement based on a linear regression adanced concept.
The angles of the Projective and the RealTime TrendLine can be identical, telling you that the market moves smoothly in a global consensus. It can be a smart Trailing Stop Loss.
Or these angles can be very different and it will call your maximum attention. You might want to switch to a superior timeframe to get the bigger picture.
🔹 FiboLevels
Once a new Trend is signaled, the levels of Fibonnaci are automatically placed.
They are calculated on the last Highest and Lowest of the former movement.
Wyckoff Wave Chart
What Is Wyckoff Wave Chart and How Does It Work?
It is the cumulative sum of exchanged (sold/bought) shares or contracts on a given wave (downward or upward) in a given time plotted on the chart.
Wyckoff Wave Chart for TradingView
Wyckoff Wave Chart is the best tool to identify turning points in all markets. Money plays in the market, not set ups. Therefore, in order to earn money, you must play in the same direction as the professionals! It is thanks to the observation of the volume that you can know which side the professionals (Smart Money) are on and trade in accordance with their direction. You can also "look" inside the chart and see on the numbers or graphical histogram who controls the market at a given moment - Buyer or the Seller.
Let's Start From The Beginning!
Wyckoff Wave Chart created by Richard Wyckoff in early 1930' were a breakthrough in technical analysis. In his famous technical analysis course, he told his students to "think like waves". Volume analysis was an integral part of his way of investing. During the period when Wyckoff was active in the financial markets wave volume was calculated manually, we now have a fully automated version for TradingView. Using Wyckoff Cumulative Volume you will be surprised how well it identifies turning points in all markets and on any time frame. This tool is very helpful in predicting trend changes in all markets like forex, crypto, futures and stocks.
In order for the indicator to work well on all charts, it is necessary to set the appropriate step in its settings.
"Step" is the wave setting to be taken into account when counting the volume on a given swing. The standard setting for each round is 30. This is the measure of pips on which the next upward or downward wave is to be counted. However, for individual assets, these settings can be adjusted individually.
Another important setting is the "Volume Divider" - the cumulative volume numbers on a given swing displayed on the chart will be different for different assets. In the case of penny stocks, it can be even millions of listed assets. In order for the chart not to display too long numbers, you can divide it by 1000 / 10000 / 100000. In the case of small intervals such as 1 or 5 minute charts, "O" may appear at the ends of swings. You should then reduce the "Volume Divider" to 1 or 10.
Accumulation example:

NOMMO AUTOMATE🖖 Hi all!
Check out my NOMMO AUTOMATE indicator for trend detection, trend change points, hedging opposite trend impulses.
What the script do:
☑️ Detecting local and global trends and trend change points, detecting opposite to current trend impulses.
How the script do it:
☑️ The indicator compares RSI indicators on chosen by user Trend TF1 and Trend TF2 and marks trend change points.
☑️ The indicator compares different length HMA indicators on chosen by user Hedge TF to detect opposite to current trend impulses.
How to use it:
☑️ There are 4 states in the indicator: Long, Short, Flat, Hedge, marked by corresponding (adjustable) color zones, where Long = uptrend, Short = downtrend, Flat = sideways movement, Hedge = possible impulse in the opposite trend direction.
☑️ Select Trend TF1 and Trend TF2 and RSI length to determine the trend, depending on how a big picture you want to see, the more major TF you choose the more global picture of the trend change you get.
☑️ Select Hedge TF to determine the possible impulses opposite to the current trend (does not work in detected Flat movement).
☑️ For each trading pair you need to try individual settings, the default settings I use for BTC swing trading, to reduce the noise level of hedging put Hedge TF the same as the smaller Trend TF.
☑️ Try different settings, experiment and you will find the most suitable settings for your trading pair.
How magic works:
☑️ RSI Trend TF1 > 50 + RSI Trend TF2 > 50 = Long
☑️ RSI Trend TF1 > 50 + RSI Trend TF2 < 50 = Flat
☑️ RSI Trend TF1 < 50 + RSI Trend TF2 > 50 = Flat
☑️ RSI Trend TF1 < 50 + RSI Trend TF2 < 50 = Short
☑️ Long + Hedge TF (HMA 10 < HMA 70 < HMA 200) = Hedge
☑️ Short + Hedge TF (HMA 10 > HMA 70 > HMA 200) = Hedge
For example:
☑️ Try Trend TF1 = 1D, Trend TF2 = 1D and Hedge TF = 1D, with RSI period = 21, to check mid-term trend on BTCUSD
May the trade force be with you.

Trend Reversal System with SR levelsHello All,
This is the Trend Reversal System with Support/Resistance levels script. long time ago I published it as closed source but now I upgraded it and and published as open-source with a different name. I hope it would be useful for you all while trading/analyzing.
The script has some parts in it: Setup, Count, SR levels, Risk levels & Targets . Now lets check them:
Setup Part: it has two part, Buy or Sell Setup. one of them can be active only. Buy setup: if current close checks if current is lower/equal than the close of the 5. bar. if yes then the script increases number of buy setup. and if it reaches 9 then the script checks if current low is lower/equal than the lows of last 3. and 4. bars, or if the low of the last bar is lower/equal than the lows of last 3. and 4. bars. if yes then the script increases the buy setup by 1. if these conditions met then it puts the label 'S' , same for Sell setup. S labels on both setup are potential reversals.
Count Part: If buy or sell setup reaches the 9 then Count part starts from 1. lets see buy count: If current close is lower/equal than the low of the 3. bar and buy count is lower than 12 or low of the bar 13 is less than or equal to the close of bar 8 then buy count increase or it's completed. if it's completed then the script puts C label, and it's potential reversal. of course there are some conditions that can cancel the count buy/sell or recycle/restart.
By using Setup and Count levels the script can show Support/Resistance Levels, Risk levels & Targets. SR levels are potential reversal levels.
Lets see some example screenshots:
Support/Resistance levels:
Potential Reversal levels and how setup/counts are shown:
Count part can recycle and the script shows it as 'R' , ( you can see the conditions for Recycle in the script ):
Count can be cancelled and and it's shown as 'x'
If the scripts find 9 on Setup or 13 on Count then it checks if it's a good level to buy/sell and if it decides it's good level then it shows TRSSetup Buy/Sell or TRSCount Buy/Sell and also shows the target. in following example the script checks and decide it's a good level to take long position. it can be aggressive or conservative, Conservative is recommended.
Enjoy!

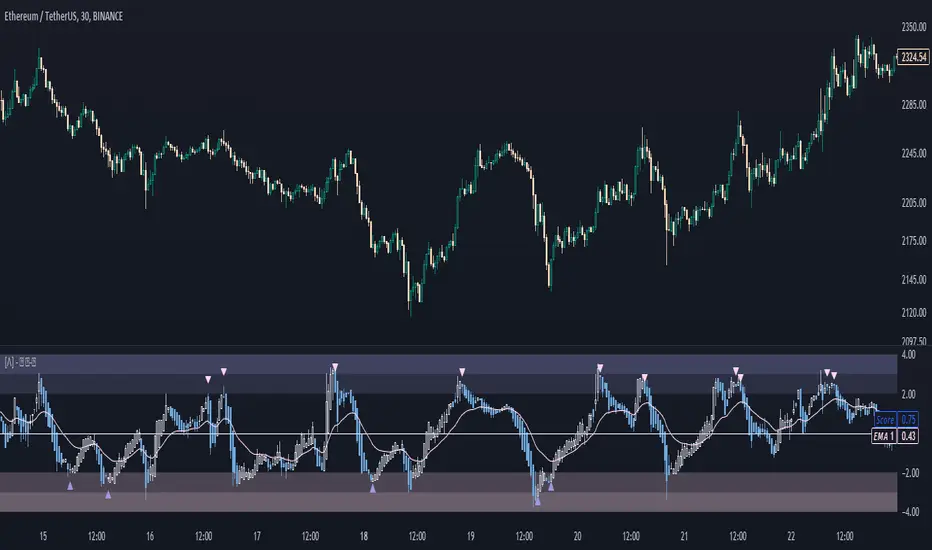
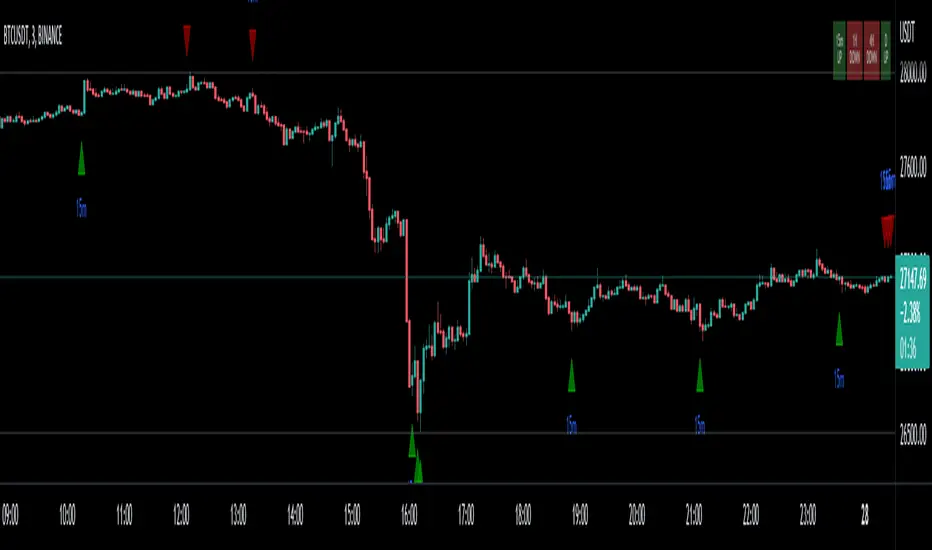
Steel Step Assistant: Trend Visualizer + Market Flow 1.0This is a market flow signal indicator. Flow with the market and you will find yourself in good hands.
This indicator simply gives you a signal of the RIGHT time to follow a market trend/direction. The indicator is designed with Steel Step strategy rules for determining directions.
It calculates and provides the most market direction signals within a particular period of time.
It also gives a relatively accurate signal of trend reversals. Being an indicator, it is prone to a certain extent of inaccuracy. It is programmed to provide an accurate market direction/flow to the best of its abilities.
Always remember that the Steel Step strategy does not rely on indicators to trade.
The trend visualizer is an ordinary table that shows you trends in different time frames.
This indicator can be used on all charts and markets; crypto, commodities, forex, stock, indices, etc.
It is suitable for intra-day traders.
One way of using this is to enhance your information gathering on trends in order to understand the market structure or direction better.
This indicator helps educate users on the market structure. Users can quickly break down the market into layers, analyze the layers and connect them all to understand the market as a whole. After users understand the market, users need to decide and choose a specific trend they want to trade. The basic idea is to flow with the market.
This indicator can be combined with EW theory to understand the market structure easily.
When I understand the whole market structure, it boosts my trading performance to the maximum.
According to the Steel Step strategy, this indicator is designed to show the trend "one layer" above "the current TF layer". This method has been tested to enhance accuracy. This may sound confusing to some of you. You can find educational materials about the layer logic from my Steel Step strategy.
Find the instructions on how to view signals below.
***SIGNAL GUIDE***
To view signals/set signal alerts:
- To view 15min signals, use 3min chart
- To view 1H signals, use 15min chart
A second version to include more time frame layers and trends will be published soon. Look forward to it!
Please comment below or message me if you have any questions. Enjoy!
*Nobody should use this indicator as a confirmation signal for entry/exit for your trades. Please message me on how to use this indicator correctly. This indicator was designed to be used in conjunction with my Steel Step strategy, hence the name.

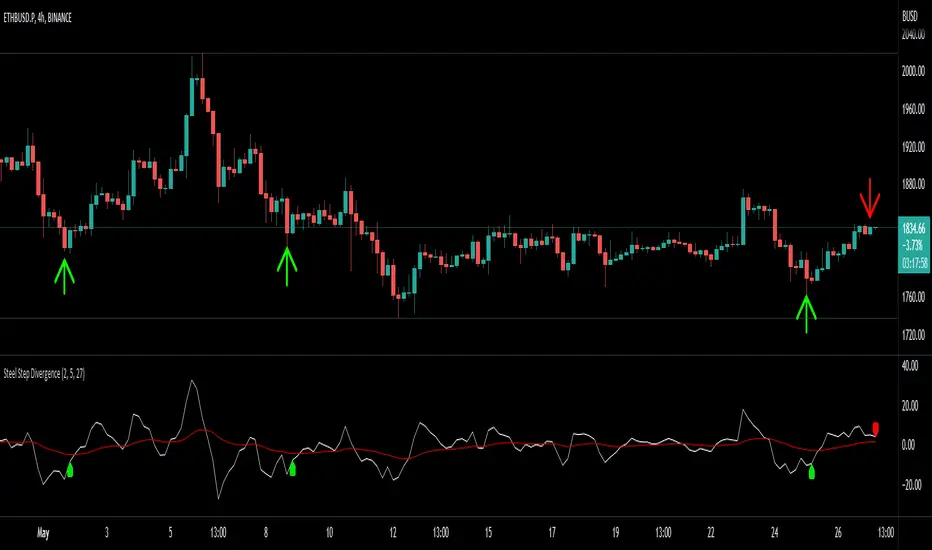
Steel Step Assistant: Trend Visualizer + Divergence Signal 1.0Disclaimer: Nobody should use this indicator as a confirmation signal for entry/exit for your trades. Please message me on how to use this indicator correctly. This indicator was designed to be used in conjunction with my Steel Step strategy, hence the name.
This indicator simply gives you a signal of trend reversals.
The trend visualizer is an ordinary table that shows you the trends of different time frames.
The signal is designed with the Steel Step strategy for determining the more important reversals/pivots.
Being an indicator, it is prone to a certain extent of inaccuracy. It is programmed to provide an accurate market trend reversal to the best of its abilities.
Always remember that the Steel Step strategy does not rely on indicators to trade.
This indicator can be used on all charts and markets; crypto, commodities, forex, stock, indices, etc.
It is suitable for intra-day traders. Another version with all time frames is being made as I publish this.
One way of using this is to enhance your information gathering on trends in order to understand the market structure or direction better.
This indicator helps educate users on the market structure. Users can quickly break down the market into layers, analyze the layers and connect them all to understand the market as a whole. After users understand the market, users need to decide and choose a specific trend they want to trade. The basic idea is to flow with the market.
This indicator can be combined with EW theory to understand the market structure easily.
When I understand the whole market structure, it boosts my trading performance to the maximum.
The user inputs (settings) should be very straightforward. The default settings produce directions that are very similar to what I use for my strategy. You can change the settings as desired.
The default settings are configured to show you the trend reversal or market direction of "one layer" above "the current time frame layer". You can find educational materials about the layer logic from my Steel Step strategy.
Find the instructions on how to view signals below.
***SIGNAL GUIDE***
To view signals/set signal alerts:
- To view 15min signals, use 3min chart
- To view 1H signals, use 15min chart
A second version to include more time frames and trends will be published soon. Look forward to it!
Please comment below or message me if you have any questions. Enjoy!
Steel Step Assistant: Divergence IndicatorDisclaimer: Nobody should use this indicator as a confirmation signal for entry/exit for your trades. Please message me on how to use this indicator correctly. This indicator was designed to be used in conjunction with my Steel Step strategy, hence the name.
This indicator simply gives you a signal of a trend reversal.
The default settings produce directions that are very similar to what I use for my strategy. You can change the settings as desired.
The user inputs (settings) should be very straightforward. Length is the distance you want to compare the price.
This indicator can be used on all charts and markets; crypto, commodities, forex, stock, indices, etc.
It is suitable for intra-day traders, as well as HTF traders.
The default settings are configured to show you the trend reversal or market direction of "one layer" above "the current time frame layer". You can find educational materials about the layer logic from my Steel Step strategy.
One way of using this is to enhance your information gathering on trends in order to understand the market structure or direction better.
This indicator educates users on the market structure. Users can quickly break down the market into layers, analyze the layers and connect them all to understand the market as a whole. After users understand the market, users need to decide and choose a specific trend they want to trade. The basic idea is to flow with the market.
This indicator can be combined with EW theory to understand the market structure easily.
When I understand the whole market structure, it boosts my trading performance to the maximum.
Please comment below or message me if you have any questions. Enjoy!
Rainbow Collection - VioletMoving averages come in all shapes and types. The most basic type is the simple moving average which is simply the sum divided by the quantity. Therefore, the simple moving average is the sum of the values divided by their number.
In technical analysis, you generally use moving averages to understand the underlying trend and to find trading signals. In the case of the Violet indicator, we are using a Hull moving average which is a special variation based on different weights to minimize lag.
The Violet indicator is therefore used as follows:
* A bullish signal is generated whenever the close price surpasses the 20-period Hull moving average while the previous close prices from periods were all below their respective Hull moving average of the period.
*A bearish signal is generated whenever the close price breaks the 20-period Hull moving average while the previous close prices from periods were all above their respective Hull moving average of the period.
The aim of the Violet indicator is to capture reversals as early as possible through a combination of lagged conditions based on the Fibonacci sequence.

Steel Step Assistant: Trend VisualizerSpecial thanks to Turicumo and Psychil for helping me write the code, both from my group.
Disclaimer: Nobody should use this indicator as a confirmation signal for entry/exit for your trades. Please message me on how to use this indicator correctly. This indicator was designed to be used in conjunction with my Steel Step strategy, hence the name.
This indicator simply gives a quick outlook of the market.
This indicator is an ordinary table that shows you the trends.
The default settings produce directions that are very similar to what I use for my strategy. You can change the settings as desired.
This indicator can be used on all charts and markets; crypto, commodities, forex, stock, indices, etc.
It is suitable for intra-day traders, as well as HTF traders.
One way of using this is to enhance your information gathering on trends in order to understand the market structure or direction better.
This indicator educates users on the market structure. Users can quickly break down the market into layers, analyze the layers and connect them all to understand the market as a whole. After users understand the market, users need to decide and choose a specific trend they want to trade. The basic idea is to flow with the market.
This indicator can be combined with EW theory to understand the market structure easily.
When I understand the whole market structure, it boosts my trading performance to the maximum.
Please comment below or message me if you have any questions. Enjoy!

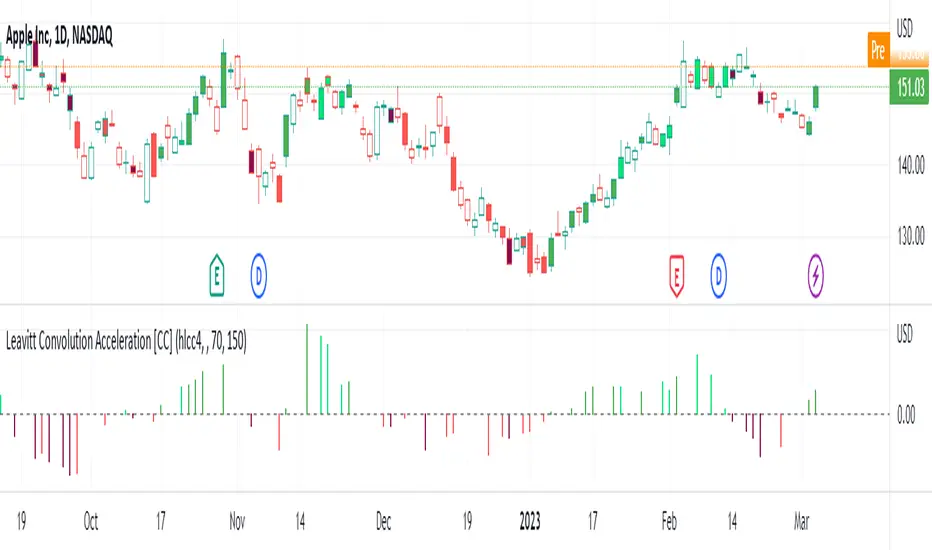
Leavitt Convolution Acceleration [CC]The Leavitt Convolution Slope indicator was created by Jay Leavitt (Stocks and Commodities Oct 2019, page 11), who is most well-known for creating the Volume-Weighted Average Price indicator. This indicator didn't have a good explanation or description so I custom-coded most of it. The way it works is it will give trend spikes in the direction of the underlying trend. If you don't see a spike then it means that the stock isn't trending at the moment. One possible avenue to explore with this indicator is judging the size of the trend spike before you open a position in that direction (or the opposite direction if you are shorting). I added a normalization function using code from a good friend @loxx that I recommend leaving on but feel free to experiment with it. I have color coded the lines to turn light green for a standard buy signal or dark green for a strong buy signal and light red for a standard sell signal, and dark red for a strong sell signal.
This is another indicator in a series that I'm publishing to fulfill a special request from @ashok1961 so let me know if you ever have any special requests for me.
Detect BOS in Five Candles with MTF - Alert [MsF]Japanese below / 日本語説明は英文の後にあります。
-------------------------
*This indicator is based on azmathshah's "Last Three Candles each of Two HTF".
It's a very cool indicator. thank you.
You can detect trend reversal with candlesticks.
It's MTF compatible and can display up to 2 sets of 5 candles of any time frame on the right side of the chart.
By displaying the candles of the upper time frame bars, you can check the trend change and measure the entry timing with the lower time frame bars.
There are two types of alerts.
"Liquidity Sweep": This is an alert when the upper beard (high) of ③ is touched with the next foot.
"Candle Close": An alert when the upper whisker (high) of ③ is exceeded by the closing price of the next bar (generally a strong signal)
-------------------------
ローソク足でトレンド転換を検知するインジケーターです。
MTF対応となっておりチャートの右側に任意タイムフレームのローソク5本を最大2セット表示できます。
上位足のローソクを表示することにより、トレンド転換確認しながら、下位足でエントリータイミングを計ることができます。
アラートは2種類あります。
"Liquidity Sweep":③の上ヒゲ(high)を次の足でタッチした場合のアラートです
"Candle Close":③の上ヒゲ(high)を次の足の終値で上回った場合のアラートです(一般的には強力なシグナルとなります)

Multi indicators tableThis is a comprehensive trading tool that presents an overview of the market in a tabular format. It consists of five distinct categories of trading indicators : Volatility, Trend, Momentum, Reversal, and Volume. Each category includes a series of indicators that are widely used in the trading communauty.
The Volatility category includes the Average True Range (ATR) and Bollinger Bands indicators. The Trend category comprises the Average Directional Index (ADX), four Exponential Moving Averages (EMAs), Aroon, Parabolic SAR, and the Supertrend. The Momentum category includes the Stochastic Relative Strength Index (StochRSI), Money Flow Index (MFI), Williams %R, Relative Strength Index (RSI), and Commodity Channel Index (CCI). The Reversal category includes Parabolic SAR, Moving Average Convergence Divergence (MACD), and PP Supertrend. Finally, the Volume category includes the Volume Exponential Moving Average (EMA) indicator.
The indicators states are easily readable, the indicator case is colored based on his actual state. A bullish color (green by default), a bearish color (red by default),
a very bullish color (dark green by default), a very bearish color (dark red by default) and a neutral color (gray by default) displayed when the indicator doesn't give us a clear signal. Some indicators do not have a very bullish or very bearish state. Concerning volatility indicators, the bullish color indicates high volatility, the bearish color indicates low volatility, and the neutral color indicates normal volatility.
Most of the indicators displayed in the table are customizable, and traders can choose to hide the categories they don't want to use. The Indicator provides a quick and easily readable view on the market and allows traders to reduce the number of indicators on their chart making it lighter and more readable.

Dynamic Reactor [CHE]This simple Pine script is an implementation of the Dynamic Reactor indicator. The indicator is designed to dynamically adjust to market conditions and identify trend reversals.
The indicator takes one input parameter: the length of the Dynamic Reactor. The script calculates the high, low, and midpoint values of the Dynamic Reactor using a simple moving average (SMA) function. The plot colors are determined by the current price in relation to the high and low values. If the price is above the high value, the plot is colored green. If the price is below the low value, the plot is colored red. Otherwise, the plot is colored gray. The area between the high and low values is filled with a transparent color to help visualize the range of the indicator.
