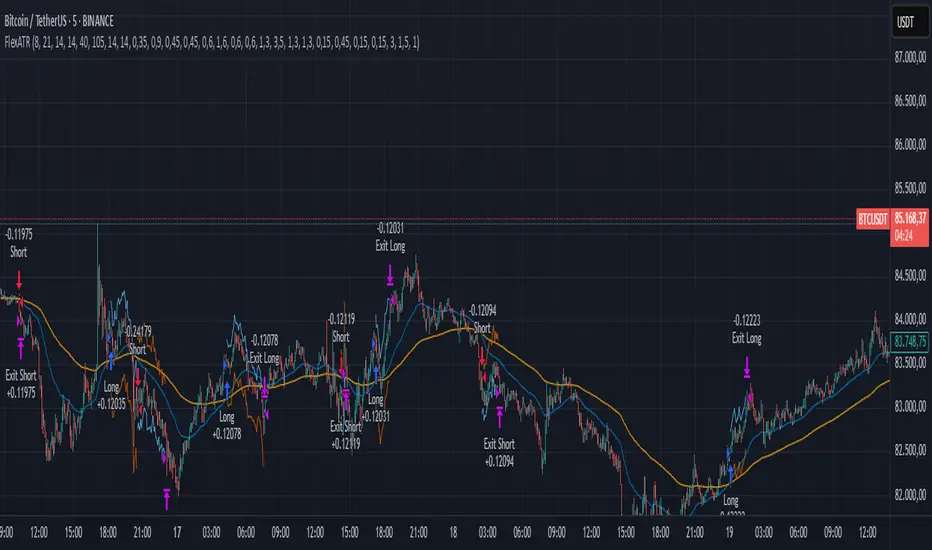
FlexATRFlexATR: A Dynamic Multi-Timeframe Trading Strategy
Overview: FlexATR is a versatile trading strategy that dynamically adapts its key parameters based on the timeframe being used. It combines technical signals from exponential moving averages (EMAs) and the Relative Strength Index (RSI) with volatility-based risk management via the Average True Range (ATR). This approach helps filter out false signals while adjusting to varying market conditions — whether you’re trading on a daily chart, intraday charts (30m, 60m, or 5m), or even on higher timeframes like the 4-hour or weekly charts.
How It Works:
Multi-Timeframe Parameter Adaptation: FlexATR is designed to automatically adjust its indicator settings depending on the timeframe:
Daily and Weekly: On higher timeframes, the strategy uses longer periods for the fast and slow EMAs and standard periods for RSI and ATR to capture more meaningful trend confirmations while minimizing noise.
Intraday (e.g., 30m, 60m, 5m, 4h): The parameters are converted from “days” into the corresponding number of bars. For instance, on a 30-minute chart, a “day” might equal 48 bars. The preset values for a 30-minute chart have been slightly reduced (e.g., a fast EMA is set at 0.35 days instead of 0.4) to improve reactivity while maintaining robust filtering.
Signal Generation:
Entry Signals: The strategy enters long positions when the fast EMA crosses above the slow EMA and the RSI is above 50, and it enters short positions when the fast EMA crosses below the slow EMA with the RSI below 50. This dual confirmation helps ensure that signals are reliable.
Risk Management: The ATR is used to compute dynamic levels for stop loss and profit target:
Stop Loss: For a long position, the stop loss is placed at Price - (ATR × Stop Loss Multiplier). For a short position, it is at Price + (ATR × Stop Loss Multiplier).
Profit Target: The profit target is similarly set using the ATR multiplied by a designated profit multiplier.
Dynamic Trailing Stop: FlexATR further incorporates a dynamic trailing stop (if enabled) that adjusts according to the ATR. This trailing stop follows favorable price movements at a distance defined by a multiplier, locking in gains as the trend develops. The use of a trailing stop helps protect profits without requiring a fixed exit point.
Capital Allocation: Each trade is sized at 10% of the total equity. This percentage-based position sizing allows the strategy to scale with your account size. While the current setup assumes no leverage (a 1:1 exposure), the inherent design of the strategy means you can adjust the leverage externally if desired, with risk metrics scaling accordingly.
Visual Representation: For clarity and accessibility (especially for those with color vision deficiencies), FlexATR employs a color-blind friendly palette (the Okabe-Ito palette):
EMA Fast: Displayed in blue.
EMA Slow: Displayed in orange.
Stop Loss Levels: Rendered in vermilion.
Profit Target Levels: Shown in a distinct azzurro (light blue).
Benefits and Considerations:
Reliability: By requiring both EMA crossovers and an RSI confirmation, FlexATR filters out a significant amount of market noise, which reduces false signals at the expense of some delayed entries.
Adaptability: The automatic conversion of “day-based” parameters into bar counts for intraday charts means the strategy remains consistent across different timeframes.
Risk Management: Using the ATR for both fixed and trailing stops allows the strategy to adapt to changing market volatility, helping to protect your capital.
Flexibility: The strategy’s inputs are customizable via the input panel, allowing traders to fine-tune the parameters for different assets or market conditions.
Conclusion: FlexATR is designed as a balanced, adaptive strategy that emphasizes reliability and robust risk management across a variety of timeframes. While it may sometimes enter trades slightly later due to its filtering mechanism, its focus on confirming trends helps reduce the likelihood of false signals. This makes it particularly attractive for traders who prioritize a disciplined, multi-timeframe approach to capturing market trends.
Volatilità
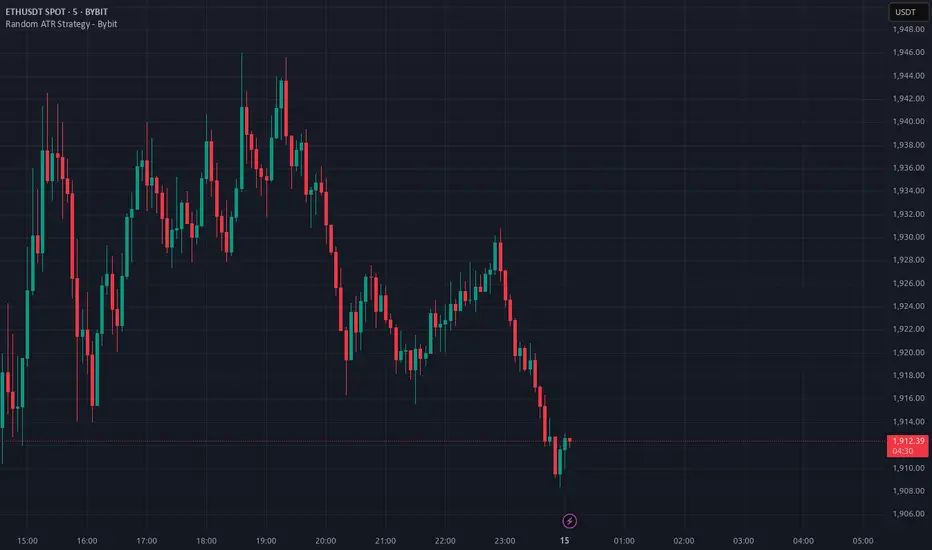
ETH/USDT EMA Crossover Strategy - OptimizedStrategy Name: EMA Crossover Strategy for ETH/USDT
Description:
This trading strategy is designed for the ETH/USDT pair and is based on exponential moving average (EMA) crossovers combined with momentum and volatility indicators. The strategy uses multiple filters to identify high-probability signals in both bullish and bearish trends, making it suitable for traders looking to trade in trending markets.
Strategy Components
EMAs (Exponential Moving Averages):
EMA 200: Used to identify the primary trend. If the price is above the EMA 200, it is considered a bullish trend; if below, a bearish trend.
EMA 50: Acts as an additional filter to confirm the trend.
EMA 20 and EMA 50 Short: These short-term EMAs generate entry signals through crossovers. A bullish crossover (EMA 20 crosses above EMA 50 Short) is a buy signal, while a bearish crossover (EMA 20 crosses below EMA 50 Short) is a sell signal.
RSI (Relative Strength Index):
The RSI is used to avoid overbought or oversold conditions. Long trades are only taken when the RSI is above 30, and short trades when the RSI is below 70.
ATR (Average True Range):
The ATR is used as a volatility filter. Trades are only taken when there is sufficient volatility, helping to avoid false signals in quiet markets.
Volume:
A volume filter is used to confirm sufficient market participation in the price movement. Trades are only taken when volume is above average.
Strategy Logic
Long Trades:
The price must be above the EMA 200 (bullish trend).
The EMA 20 must cross above the EMA 50 Short.
The RSI must be above 30.
The ATR must indicate sufficient volatility.
Volume must be above average.
Short Trades:
The price must be below the EMA 200 (bearish trend).
The EMA 20 must cross below the EMA 50 Short.
The RSI must be below 70.
The ATR must indicate sufficient volatility.
Volume must be above average.
How to Use the Strategy
Setup:
Add the script to your ETH/USDT chart on TradingView.
Adjust the parameters according to your preferences (e.g., EMA periods, RSI, ATR, etc.).
Signals:
Buy and sell signals will be displayed directly on the chart.
Long trades are indicated with an upward arrow, and short trades with a downward arrow.
Risk Management:
Use stop-loss and take-profit orders in all trades.
Consider a risk-reward ratio of at least 1:2.
Backtesting:
Test the strategy on historical data to evaluate its performance before using it live.
Advantages of the Strategy
Trend-focused: The strategy is designed to trade in trending markets, increasing the probability of success.
Multiple filters: The use of RSI, ATR, and volume reduces false signals.
Adaptability: It can be adjusted for different timeframes, although it is recommended to test it on 5-minute and 15-minute charts for ETH/USDT.
Warnings
Sideways markets: The strategy may generate false signals in markets without a clear trend. It is recommended to avoid trading in such conditions.
Optimization: Make sure to optimize the parameters according to the market and timeframe you are using.
Risk management: Never trade without stop-loss and take-profit orders.
Author
Jose J. Sanchez Cuevas
Version
v1.0

iD EMARSI on ChartSCRIPT OVERVIEW
The EMARSI indicator is an advanced technical analysis tool that maps RSI values directly onto price charts. With adaptive scaling capabilities, it provides a unique visualization of momentum that flows naturally with price action, making it particularly valuable for FOREX and low-priced securities trading.
KEY FEATURES
1 PRICE MAPPED RSI VISUALIZATION
Unlike traditional RSI that displays in a separate window, EMARSI plots the RSI directly on the price chart, creating a flowing line that identifies momentum shifts within the context of price action:
// Map RSI to price chart with better scaling
mappedRsi = useAdaptiveScaling ?
median + ((rsi - 50) / 50 * (pQH - pQL) / 2 * math.min(1.0, 1/scalingFactor)) :
down == pQL ? pQH : up == pQL ? pQL : median - (median / (1 + up / down))
2 ADAPTIVE SCALING SYSTEM
The script features an intelligent scaling system that automatically adjusts to different market conditions and price levels:
// Calculate adaptive scaling factor based on selected method
scalingFactor = if scalingMethod == "ATR-Based"
math.min(maxScalingFactor, math.max(1.0, minTickSize / (atrValue/avgPrice)))
else if scalingMethod == "Price-Based"
math.min(maxScalingFactor, math.max(1.0, math.sqrt(100 / math.max(avgPrice, 0.01))))
else // Volume-Based
math.min(maxScalingFactor, math.max(1.0, math.sqrt(1000000 / math.max(volume, 100))))
3 MODIFIED RSI CALCULATION
EMARSI uses a specially formulated RSI calculation that works with an adaptive base value to maintain consistency across different price ranges:
// Adaptive RSI Base based on price levels to improve flow
adaptiveRsiBase = useAdaptiveScaling ? rsiBase * scalingFactor : rsiBase
// Calculate RSI components with adaptivity
up = ta.rma(math.max(ta.change(rsiSourceInput), adaptiveRsiBase), emaSlowLength)
down = ta.rma(-math.min(ta.change(rsiSourceInput), adaptiveRsiBase), rsiLengthInput)
// Improved RSI calculation with value constraint
rsi = down == 0 ? 100 : up == 0 ? 0 : 100 - (100 / (1 + up / down))
4 MOVING AVERAGE CROSSOVER SYSTEM
The indicator creates a smooth moving average of the RSI line, enabling a crossover system that generates trading signals:
// Calculate MA of mapped RSI
rsiMA = ma(mappedRsi, emaSlowLength, maTypeInput)
// Strategy entries
if ta.crossover(mappedRsi, rsiMA)
strategy.entry("RSI Long", strategy.long)
if ta.crossunder(mappedRsi, rsiMA)
strategy.entry("RSI Short", strategy.short)
5 VISUAL REFERENCE FRAMEWORK
The script includes visual guides that help interpret the RSI movement within the context of recent price action:
// Calculate pivot high and low
pQH = ta.highest(high, hlLen)
pQL = ta.lowest(low, hlLen)
median = (pQH + pQL) / 2
// Plotting
plot(pQH, "Pivot High", color=color.rgb(82, 228, 102, 90))
plot(pQL, "Pivot Low", color=color.rgb(231, 65, 65, 90))
med = plot(median, style=plot.style_steplinebr, linewidth=1, color=color.rgb(238, 101, 59, 90))
6 DYNAMIC COLOR SYSTEM
The indicator uses color fills to clearly visualize the relationship between the RSI and its moving average:
// Color fills based on RSI vs MA
colUp = mappedRsi > rsiMA ? input.color(color.rgb(128, 255, 0), '', group= 'RSI > EMA', inline= 'up') :
input.color(color.rgb(240, 9, 9, 95), '', group= 'RSI < EMA', inline= 'dn')
colDn = mappedRsi > rsiMA ? input.color(color.rgb(0, 230, 35, 95), '', group= 'RSI > EMA', inline= 'up') :
input.color(color.rgb(255, 47, 0), '', group= 'RSI < EMA', inline= 'dn')
fill(rsiPlot, emarsi, mappedRsi > rsiMA ? pQH : rsiMA, mappedRsi > rsiMA ? rsiMA : pQL, colUp, colDn)
7 REAL TIME PARAMETER MONITORING
A transparent information panel provides real-time feedback on the adaptive parameters being applied:
// Information display
var table infoPanel = table.new(position.top_right, 2, 3, bgcolor=color.rgb(0, 0, 0, 80))
if barstate.islast
table.cell(infoPanel, 0, 0, "Current Scaling Factor", text_color=color.white)
table.cell(infoPanel, 1, 0, str.tostring(scalingFactor, "#.###"), text_color=color.white)
table.cell(infoPanel, 0, 1, "Adaptive RSI Base", text_color=color.white)
table.cell(infoPanel, 1, 1, str.tostring(adaptiveRsiBase, "#.####"), text_color=color.white)
BENEFITS FOR TRADERS
INTUITIVE MOMENTUM VISUALIZATION
By mapping RSI directly onto the price chart, traders can immediately see the relationship between momentum and price without switching between different indicator windows.
ADAPTIVE TO ANY MARKET CONDITION
The three scaling methods (ATR-Based, Price-Based, and Volume-Based) ensure the indicator performs consistently across different market conditions, volatility regimes, and price levels.
PREVENTS EXTREME VALUES
The adaptive scaling system prevents the RSI from generating extreme values that exceed chart boundaries when trading low-priced securities or during high volatility periods.
CLEAR TRADING SIGNALS
The RSI and moving average crossover system provides clear entry signals that are visually reinforced through color changes, making it easy to identify potential trading opportunities.
SUITABLE FOR MULTIPLE TIMEFRAMES
The indicator works effectively across multiple timeframes, from intraday to daily charts, making it versatile for different trading styles and strategies.
TRANSPARENT PARAMETER ADJUSTMENT
The information panel provides real-time feedback on how the adaptive system is adjusting to current market conditions, helping traders understand why the indicator is behaving as it is.
CUSTOMIZABLE VISUALIZATION
Multiple visualization options including Bollinger Bands, different moving average types, and customizable colors allow traders to adapt the indicator to their personal preferences.
CONCLUSION
The EMARSI indicator represents a significant advancement in RSI visualization by directly mapping momentum onto price charts with adaptive scaling. This approach makes momentum shifts more intuitive to identify and helps prevent the scaling issues that commonly affect RSI-based indicators when applied to low-priced securities or volatile markets.

Volume Block Order AnalyzerCore Concept
The Volume Block Order Analyzer is a sophisticated Pine Script strategy designed to detect and analyze institutional money flow through large block trades. It identifies unusually high volume candles and evaluates their directional bias to provide clear visual signals of potential market movements.
How It Works: The Mathematical Model
1. Volume Anomaly Detection
The strategy first identifies "block trades" using a statistical approach:
```
avgVolume = ta.sma(volume, lookbackPeriod)
isHighVolume = volume > avgVolume * volumeThreshold
```
This means a candle must have volume exceeding the recent average by a user-defined multiplier (default 2.0x) to be considered a significant block trade.
2. Directional Impact Calculation
For each block trade identified, its price action determines direction:
- Bullish candle (close > open): Positive impact
- Bearish candle (close < open): Negative impact
The magnitude of impact is proportional to the volume size:
```
volumeWeight = volume / avgVolume // How many times larger than average
blockImpact = (isBullish ? 1.0 : -1.0) * (volumeWeight / 10)
```
This creates a normalized impact score typically ranging from -1.0 to 1.0, scaled by dividing by 10 to prevent excessive values.
3. Cumulative Impact with Time Decay
The key innovation is the cumulative impact calculation with decay:
```
cumulativeImpact := cumulativeImpact * impactDecay + blockImpact
```
This mathematical model has important properties:
- Recent block trades have stronger influence than older ones
- Impact gradually "fades" at rate determined by decay factor (default 0.95)
- Sustained directional pressure accumulates over time
- Opposing pressure gradually counteracts previous momentum
Trading Logic
Signal Generation
The strategy generates trading signals based on momentum shifts in institutional order flow:
1. Long Entry Signal: When cumulative impact crosses from negative to positive
```
if ta.crossover(cumulativeImpact, 0)
strategy.entry("Long", strategy.long)
```
*Logic: Institutional buying pressure has overcome selling pressure, indicating potential upward movement*
2. Short Entry Signal: When cumulative impact crosses from positive to negative
```
if ta.crossunder(cumulativeImpact, 0)
strategy.entry("Short", strategy.short)
```
*Logic: Institutional selling pressure has overcome buying pressure, indicating potential downward movement*
3. Exit Logic: Positions are closed when the cumulative impact moves against the position
```
if cumulativeImpact < 0
strategy.close("Long")
```
*Logic: The original signal is no longer valid as institutional flow has reversed*
Visual Interpretation System
The strategy employs multiple visualization techniques:
1. Color Gradient Bar System:
- Deep green: Strong buying pressure (impact > 0.5)
- Light green: Moderate buying pressure (0.1 < impact ≤ 0.5)
- Yellow-green: Mild buying pressure (0 < impact ≤ 0.1)
- Yellow: Neutral (impact = 0)
- Yellow-orange: Mild selling pressure (-0.1 < impact ≤ 0)
- Orange: Moderate selling pressure (-0.5 < impact ≤ -0.1)
- Red: Strong selling pressure (impact ≤ -0.5)
2. Dynamic Impact Line:
- Plots the cumulative impact as a line
- Line color shifts with impact value
- Line movement shows momentum and trend strength
3. Block Trade Labels:
- Marks significant block trades directly on the chart
- Shows direction and volume amount
- Helps identify key moments of institutional activity
4. Information Dashboard:
- Current impact value and signal direction
- Average volume benchmark
- Count of significant block trades
- Min/Max impact range
Benefits and Use Cases
This strategy provides several advantages:
1. Institutional Flow Detection: Identifies where large players are positioning themselves
2. Early Trend Identification: Often detects institutional accumulation/distribution before major price movements
3. Market Context Enhancement: Provides deeper insight than simple price action alone
4. Objective Decision Framework: Quantifies what might otherwise be subjective observations
5. Adaptive to Market Conditions: Works across different timeframes and instruments by using relative volume rather than absolute thresholds
Customization Options
The strategy allows users to fine-tune its behavior:
- Volume Threshold: How unusual a volume spike must be to qualify
- Lookback Period: How far back to measure average volume
- Impact Decay Factor: How quickly older trades lose influence
- Visual Settings: Labels and line width customization
This sophisticated yet intuitive strategy provides traders with a window into institutional activity, helping identify potential trend changes before they become obvious in price action alone.

Advanced Adaptive Grid Trading StrategyThis strategy employs an advanced grid trading approach that dynamically adapts to market conditions, including trend, volatility, and risk management considerations. The strategy aims to capitalize on price fluctuations in both rising (long) and falling (short) markets, as well as during sideways movements. It combines multiple indicators to determine the trend and automatically adjusts grid parameters for more efficient trading.
How it Works:
Trend Analysis:
Short, long, and super long Moving Averages (MA) to determine the trend direction.
RSI (Relative Strength Index) to identify overbought and oversold levels, and to confirm the trend.
MACD (Moving Average Convergence Divergence) to confirm momentum and trend direction.
Momentum indicator.
The strategy uses a weighted scoring system to assess trend strength (strong bullish, moderate bullish, strong bearish, moderate bearish, sideways).
Grid System:
The grid size (the distance between buy and sell levels) changes dynamically based on market volatility, using the ATR (Average True Range) indicator.
Grid density also adapts to the trend: in a strong trend, the grid is denser in the direction of the trend.
Grid levels are shifted depending on the trend direction (upwards in a bear market, downwards in a bull market).
Trading Logic:
The strategy opens long positions if the trend is bullish and the price reaches one of the lower grid levels.
It opens short positions if the trend is bearish and the price reaches one of the upper grid levels.
In a sideways market, it can open positions in both directions.
Risk Management:
Stop Loss for every position.
Take Profit for every position.
Trailing Stop Loss to protect profits.
Maximum daily loss limit.
Maximum number of positions limit.
Time-based exit (if the position is open for too long).
Risk-based position sizing (optional).
Input Options:
The strategy offers numerous settings that allow users to customize its operation:
Timeframe: The chart's timeframe (e.g., 1 minute, 5 minutes, 1 hour, 4 hours, 1 day, 1 week).
Base Grid Size (%): The base size of the grid, expressed as a percentage.
Max Positions: The maximum number of open positions allowed.
Use Volatility Grid: If enabled, the grid size changes dynamically based on the ATR indicator.
ATR Length: The period of the ATR indicator.
ATR Multiplier: The multiplier for the ATR to fine-tune the grid size.
RSI Length: The period of the RSI indicator.
RSI Overbought: The overbought level for the RSI.
RSI Oversold: The oversold level for the RSI.
Short MA Length: The period of the short moving average.
Long MA Length: The period of the long moving average.
Super Long MA Length: The period of the super long moving average.
MACD Fast Length: The fast period of the MACD.
MACD Slow Length: The slow period of the MACD.
MACD Signal Length: The period of the MACD signal line.
Stop Loss (%): The stop loss level, expressed as a percentage.
Take Profit (%): The take profit level, expressed as a percentage.
Use Trailing Stop: If enabled, the strategy uses a trailing stop loss.
Trailing Stop (%): The trailing stop loss level, expressed as a percentage.
Max Loss Per Day (%): The maximum daily loss, expressed as a percentage.
Time Based Exit: If enabled, the strategy exits the position after a certain amount of time.
Max Holding Period (hours): The maximum holding time in hours.
Use Risk Based Position: If enabled, the strategy calculates position size based on risk.
Risk Per Trade (%): The risk per trade, expressed as a percentage.
Max Leverage: The maximum leverage.
Important Notes:
This strategy does not guarantee profits. Cryptocurrency markets are volatile, and trading involves risk.
The strategy's effectiveness depends on market conditions and settings.
It is recommended to thoroughly backtest the strategy under various market conditions before using it live.
Past performance is not indicative of future results.

IU BBB(Big Body Bar) StrategyDESCRIPTION
The IU BBB (Big Body Bar) Strategy is a price action-based trading strategy that identifies high-momentum candles with significantly larger body sizes compared to the average. It enters trades when a strong bullish or bearish move occurs and manages risk using an ATR-based trailing stop-loss system.
USER INPUTS:
- Big Body Threshold – Defines how many times larger the candle body should be compared to the average body ( default is 4 ).
- ATR Length – The period for the Average True Range (ATR) used in the trailing stop-loss calculation ( default is 14 ).
- ATR Factor – Multiplier for ATR to determine the trailing stop distance ( default is 2 ).
LONG CONDITION:
- The current candle’s body is greater than the average body size multiplied by the Big Body Threshold.
- The closing price is higher than the opening price (bullish candle).
SHORT CONDITION:
- The current candle’s body is greater than the average body size multiplied by the Big Body Threshold.
- The closing price is lower than the opening price (bearish candle).
LONG EXIT:
- ATR-based trailing stop-loss dynamically adjusts, locking in profits as the price moves higher.
SHORT EXIT:
- ATR-based trailing stop-loss dynamically adjusts, securing profits as the price moves lower.
WHY IT IS UNIQUE:
- Unlike traditional momentum strategies, this system adapts to volatility by filtering trades based on relative candle size.
- It incorporates an ATR-based trailing stop-loss, ensuring risk management and profit protection.
- The strategy avoids choppy market conditions by only trading when significant momentum is present.
HOW USERS CAN BENEFIT FROM IT:
- Catch Strong Price Moves – The strategy helps traders enter trades when the market shows decisive momentum.
- Effective Risk Management – The ATR-based trailing stop ensures that winning trades remain profitable.
- Works Across Markets – Can be applied to stocks, forex, crypto, and indices with proper optimization.
- Fully Customizable – Users can adjust sensitivity settings to match their trading style and time frame.

IU Gap Fill StrategyThe IU Gap Fill Strategy is designed to capitalize on price gaps that occur between trading sessions. It identifies gaps based on a user-defined percentage threshold and executes trades when the price fills the gap within a day. This strategy is ideal for traders looking to take advantage of market inefficiencies that arise due to overnight or session-based price movements. An ATR-based trailing stop-loss is incorporated to dynamically manage risk and lock in profits.
USER INPUTS
Percentage Difference for Valid Gap - Defines the minimum gap size in percentage terms for a valid trade setup. ( Default is 0.2 )
ATR Length - Sets the lookback period for the Average True Range (ATR) calculation. (default is 14 )
ATR Factor - Determines the multiplier for the trailing stop-loss, helping in risk management. ( Default is 2.00 )
LONG CONDITION
A gap-up occurs, meaning the current session opens above the previous session’s close.
The price initially dips below the previous session's close but then recovers and closes above it.
The gap meets the valid percentage threshold set by the user.
The bar is not the first or last bar of the session to avoid false signals.
SHORT CONDITION
A gap-down occurs, meaning the current session opens below the previous session’s close.
The price initially moves above the previous session’s close but then closes below it.
The gap meets the valid percentage threshold set by the user.
The bar is not the first or last bar of the session to avoid false signals.
LONG EXIT
An ATR-based trailing stop-loss is set below the entry price and dynamically adjusts upwards as the price moves in favor of the trade.
The position is closed when the trailing stop-loss is hit.
SHORT EXIT
An ATR-based trailing stop-loss is set above the entry price and dynamically adjusts downwards as the price moves in favor of the trade.
The position is closed when the trailing stop-loss is hit.
WHY IT IS UNIQUE
Precision in Identifying Gaps - The strategy focuses on real price gaps rather than minor fluctuations.
Dynamic Risk Management - Uses ATR-based trailing stop-loss to secure profits while allowing the trade to run.
Versatility - Works on stocks, indices, forex, and any market that experiences session-based gaps.
Optimized Entry Conditions - Ensures entries are taken only when the price attempts to fill the gap, reducing false signals.
HOW USERS CAN BENEFIT FROM IT
Enhance Trade Timing - Captures high-probability trade setups based on market inefficiencies caused by gaps.
Minimize Risk - The ATR trailing stop-loss helps protect gains and limit losses.
Works in Different Market Conditions - Whether markets are trending or consolidating, the strategy adapts to potential gap fill opportunities.
Fully Customizable - Users can fine-tune gap percentage, ATR settings, and stop-loss parameters to match their trading style.

Dual SuperTrend w VIX Filter - Strategy [presentTrading]Hey everyone! Haven't been here for a long time. Been so busy again in the past 2 months. I recently started working on analyzing the combination of trend strategy and VIX, but didn't get outstanding results after a few tries. Sharing this tool with all of you in case you have better insights.
█ Introduction and How it is Different
The Dual SuperTrend with VIX Filter Strategy combines traditional trend following with market volatility analysis. Unlike conventional SuperTrend strategies that focus solely on price action, this experimental system incorporates VIX (Volatility Index) as an adaptive filter to create a more context-aware trading approach. By analyzing where current volatility stands relative to historical norms, the strategy adjusts to different market environments rather than applying uniform logic across all conditions.
BTCUSD 6hr Long Short Performance
█ Strategy, How it Works: Detailed Explanation
🔶 Dual SuperTrend Core
The strategy uses two SuperTrend indicators with different sensitivity settings:
- SuperTrend 1: Length = 13, Multiplier = 3.5
- SuperTrend 2: Length = 8, Multiplier = 5.0
The SuperTrend calculation follows this process:
1. ATR = Average of max(High-Low, |High-PreviousClose|, |Low-PreviousClose|) over 'length' periods
2. UpperBand = (High+Low)/2 - (Multiplier * ATR)
3. LowerBand = (High+Low)/2 + (Multiplier * ATR)
Trend direction is determined by:
- If Close > previous LowerBand, Trend = Bullish (1)
- If Close < previous UpperBand, Trend = Bearish (-1)
- Otherwise, Trend = previous Trend
🔶 VIX Analysis Framework
The core innovation lies in the VIX analysis system:
1. Statistical Analysis:
- VIX Mean = SMA(VIX, 252)
- VIX Standard Deviation = StdDev(VIX, 252)
- VIX Z-Score = (Current VIX - VIX Mean) / VIX StdDev
2. **Volatility Bands:
- Upper Band 1 = VIX Mean + (2 * VIX StdDev)
- Upper Band 2 = VIX Mean + (3 * VIX StdDev)
- Lower Band 1 = VIX Mean - (2 * VIX StdDev)
- Lower Band 2 = VIX Mean - (3 * VIX StdDev)
3. Volatility Regimes:
- "Very Low Volatility": VIX < Lower Band 1
- "Low Volatility": Lower Band 1 ≤ VIX < Mean
- "Normal Volatility": Mean ≤ VIX < Upper Band 1
- "High Volatility": Upper Band 1 ≤ VIX < Upper Band 2
- "Extreme Volatility": VIX ≥ Upper Band 2
4. VIX Trend Detection:
- VIX EMA = EMA(VIX, 10)
- VIX Rising = VIX > VIX EMA
- VIX Falling = VIX < VIX EMA
Local performance:
🔶 Entry Logic Integration
The strategy combines trend signals with volatility filtering:
Long Entry Condition:
- Both SuperTrend 1 AND SuperTrend 2 must be bullish (trend = 1)
- AND selected VIX filter condition must be satisfied
Short Entry Condition:
- Both SuperTrend 1 AND SuperTrend 2 must be bearish (trend = -1)
- AND selected VIX filter condition must be satisfied
Available VIX filter rules include:
- "Below Mean + SD": VIX < Lower Band 1
- "Below Mean": VIX < VIX Mean
- "Above Mean": VIX > VIX Mean
- "Above Mean + SD": VIX > Upper Band 1
- "Falling VIX": VIX < VIX EMA
- "Rising VIX": VIX > VIX EMA
- "Any": No VIX filtering
█ Trade Direction
The strategy allows testing in three modes:
1. **Long Only:** Test volatility effects on uptrends only
2. **Short Only:** Examine volatility's impact on downtrends only
3. **Both (Default):** Compare how volatility affects both trend directions
This enables comparative analysis of how volatility regimes impact bullish versus bearish markets differently.
█ Usage
Use this strategy as an experimental framework:
1. Form a hypothesis about how volatility affects trend reliability
2. Configure VIX filters to test your specific hypothesis
3. Analyze performance across different volatility regimes
4. Compare results between uptrends and downtrends
5. Refine your volatility filtering approach based on results
6. Share your findings with the trading community
This framework allows you to investigate questions like:
- Are uptrends more reliable during rising or falling volatility?
- Do downtrends perform better when volatility is above or below its historical average?
- Should different volatility filters be applied to long vs. short positions?
█ Default Settings
The default settings serve as a starting point for exploration:
SuperTrend Parameters:
- SuperTrend 1 (Length=13, Multiplier=3.5): More responsive to trend changes
- SuperTrend 2 (Length=8, Multiplier=5.0): More selective filter requiring stronger trends
VIX Analysis Settings:
- Lookback Period = 252: Establishes a full market cycle for volatility context
- Standard Deviation Bands = 2 and 3 SD: Creates statistically significant regime boundaries
- VIX Trend Period = 10: Balances responsiveness with noise reduction
Default VIX Filter Selection:
- Long Entry: "Above Mean" - Tests if uptrends perform better during above-average volatility
- Short Entry: "Rising VIX" - Tests if downtrends accelerate when volatility is increasing
Feel Free to share your insight below!!!

[3Commas] Turtle StrategyTurtle Strategy
🔷 What it does: This indicator implements a modernized version of the Turtle Trading Strategy, designed for trend-following and automated trading with webhook integration. It identifies breakout opportunities using Donchian channels, providing entry and exit signals.
Channel 1: Detects short-term breakouts using the highest highs and lowest lows over a set period (default 20).
Channel 2: Acts as a confirmation filter by applying an offset to the same period, reducing false signals.
Exit Channel: Functions as a dynamic stop-loss (wait for candle close), adjusting based on market structure (default 10 periods).
Additionally, traders can enable a fixed Take Profit level, ensuring a systematic approach to profit-taking.
🔷 Who is it for:
Trend Traders: Those looking to capture long-term market moves.
Bot Users: Traders seeking to automate entries and exits with bot integration.
Rule-Based Traders: Operators who prefer a structured, systematic trading approach.
🔷 How does it work: The strategy generates buy and sell signals using a dual-channel confirmation system.
Long Entry: A buy signal is generated when the close price crosses above the previous high of Channel 1 and is confirmed by Channel 2.
Short Entry: A sell signal occurs when the close price falls below the previous low of Channel 1, with confirmation from Channel 2.
Exit Management: The Exit Channel acts as a trailing stop, dynamically adjusting to price movements. To exit the trade, wait for a full bar close.
Optional Take Profit (%): Closes trades at a predefined %.
🔷 Why it’s unique:
Modern Adaptation: Updates the classic Turtle Trading Strategy, with the possibility of using a second channel with an offset to filter the signals.
Dynamic Risk Management: Utilizes a trailing Exit Channel to help protect gains as trades move favorably.
Bot Integration: Automates trade execution through direct JSON signal communication with your DCA Bots.
🔷 Considerations Before Using the Indicator:
Market & Timeframe: Best suited for trending markets; higher timeframes (e.g., H4, D1) are recommended to minimize noise.
Sideways Markets: In choppy conditions, breakouts may lead to false signals—consider using additional filters.
Backtesting & Demo Testing: It is crucial to thoroughly backtest the strategy and run it on a demo account before risking real capital.
Parameter Adjustments: Ensure that commissions, slippage, and position sizes are set accurately to reflect real trading conditions.
🔷 STRATEGY PROPERTIES
Symbol: BINANCE:ETHUSDT (Spot).
Timeframe: 4h.
Test Period: All historical data available.
Initial Capital: 10000 USDT.
Order Size per Trade: 1% of Capital, you can use a higher value e.g. 5%, be cautious that the Max Drawdown does not exceed 10%, as it would indicate a very risky trading approach.
Commission: Binance commission 0.1%, adjust according to the exchange being used, lower numbers will generate unrealistic results. By using low values e.g. 5%, it allows us to adapt over time and check the functioning of the strategy.
Slippage: 5 ticks, for pairs with low liquidity or very large orders, this number should be increased as the order may not be filled at the desired level.
Margin for Long and Short Positions: 100%.
Indicator Settings: Default Configuration.
Period Channel 1: 20.
Period Channel 2: 20.
Period Channel 2 Offset: 20.
Period Exit: 10.
Take Profit %: Disable.
Strategy: Long & Short.
🔷 STRATEGY RESULTS
⚠️Remember, past results do not guarantee future performance.
Net Profit: +516.87 USDT (+5.17%).
Max Drawdown: -100.28 USDT (-0.95%).
Total Closed Trades: 281.
Percent Profitable: 40.21%.
Profit Factor: 1.704.
Average Trade: +1.84 USDT (+1.80%).
Average # Bars in Trades: 29.
🔷 How to Use It:
🔸 Adjust Settings:
Select your asset and timeframe suited for trend trading.
Adjust the periods for Channel 1, Channel 2, and the Exit Channel to align with the asset’s historical behavior. You can visualize these channels by going to the Style tab and enabling them.
For example, if you set Channel 2 to 40 with an offset of 40, signals will take longer to appear but will aim for a more defined trend.
Experiment with different values, a possible exit configuration is using 20 as well. Compare the results and adjust accordingly.
Enable the Take Profit (%) option if needed.
🔸Results Review:
It is important to check the Max Drawdown. This value should ideally not exceed 10% of your capital. Consider adjusting the trade size to ensure this threshold is not surpassed.
Remember to include the correct values for commission and slippage according to the symbol and exchange where you are conducting the tests. Otherwise, the results will not be realistic.
If you are satisfied with the results, you may consider automating your trades. However, it is strongly recommended to use a small amount of capital or a demo account to test proper execution before committing real funds.
🔸Create alerts to trigger the DCA Bot:
Verify Messages: Ensure the message matches the one specified by the DCA Bot.
Multi-Pair Configuration: For multi-pair setups, enable the option to add the symbol in the correct format.
Signal Settings: Enable the option to receive long or short signals (Entry | TP | SL), copy and paste the messages for the DCA Bots configured.
Alert Setup:
When creating an alert, set the condition to the indicator and choose "alert() function call only".
Enter any desired Alert Name.
Open the Notifications tab, enable Webhook URL, and paste the Webhook URL.
For more details, refer to the section: "How to use TradingView Custom Signals".
Finalize Alerts: Click Create, you're done! Alerts will now be sent automatically in the correct format.
🔷 INDICATOR SETTINGS
Period Channel 1: Period of highs and lows to trigger signals
Period Channel 2: Period of highs and lows to filter signals
Offset: Move Channel 2 to the right x bars to try to filter out the favorable signals.
Period Exit: It is the period of the Donchian channel that is used as trailing for the exits.
Strategy: Order Type direction in which trades are executed.
Take Profit %: When activated, the entered value will be used as the Take Profit in percentage from the entry price level.
Use Custom Test Period: When enabled signals only works in the selected time window. If disabled it will use all historical data available on the chart.
Test Start and End: Once the Custom Test Period is enabled, here you select the start and end date that you want to analyze.
Check Messages: Check Messages: Enable this option to review the messages that will be sent to the bot.
Entry | TP | SL: Enable this options to send Buy Entry, Take Profit (TP), and Stop Loss (SL) signals.
Deal Entry and Deal Exit: Copy and paste the message for the deal start signal and close order at Market Price of the DCA Bot. This is the message that will be sent with the alert to the Bot, you must verify that it is the same as the bot so that it can process properly.
DCA Bot Multi-Pair: You must activate it if you want to use the signals in a DCA Bot Multi-pair in the text box you must enter (using the correct format) the symbol in which you are creating the alert, you can check the format of each symbol when you create the bot.
👨🏻💻💭 We hope this tool helps enhance your trading. Your feedback is invaluable, so feel free to share any suggestions for improvements or new features you'd like to see implemented.
__
The information and publications within the 3Commas TradingView account are not meant to be and do not constitute financial, investment, trading, or other types of advice or recommendations supplied or endorsed by 3Commas and any of the parties acting on behalf of 3Commas, including its employees, contractors, ambassadors, etc.

Enhanced BarUpDn StrategyEnhanced BarUpDn Strategy
The Enhanced BarUpDn Strategy is a refined price action-based trading approach that identifies market trends and reversals using bar formations. It focuses on detecting bullish and bearish momentum by analyzing consecutive price bars and key support/resistance levels.
Key Features:
✅ Trend Confirmation – Uses a combination of bar patterns and indicators (e.g., moving averages, RSI) to confirm momentum shifts.
✅ Entry Signals – A buy signal is triggered when an "Up Bar" (higher high, higher low) follows a bullish setup; a sell signal when a "Down Bar" (lower high, lower low) confirms bearish momentum.
✅ Enhanced Filters – Incorporates volume analysis and additional conditions to reduce false signals.
✅ Stop-Loss & Risk Management – Uses recent swing highs/lows for stop placement and dynamic trailing stops for maximizing gains.

3 Red / 3 Green Strategy with Volatility CheckStrategy Name: 3 Red / 3 Green Strategy with Volatility Check by AlgoTradeKit
Overview
This long-only strategy is designed for daily bars on NASDAQ (or similar instruments) and combines simple price action with a volatility filter. It “tells it like it is” – enter when the market shows weakness, but only in sufficiently volatile conditions, and exit either on signs of a reversal or after a set number of days.
Entry Conditions
- Price Action :
Enter a long position when there are 3 consecutive red days (each day's close is below its open).
- Volatility Filter :
The entry is allowed only if the current ATR (Average True Range) calculated over the specified ATR Period (default 12) is greater than its 30-day simple moving average. This ensures the market has enough volatility to justify the trade.
Exit Conditions
- Reversal Signal :
Exit the long position when 3 consecutive green days occur (each day's close is above its open), signaling a potential reversal.
- Time Limit :
Regardless of market conditions, any open trade is closed if it reaches the Maximum Trade Duration (default 22 days). This helps limit exposure during stagnant or unfavorable market conditions.
- You can toggle the three-green-day exit if you want to isolate the time-based exit.
Input Parameters
- Maximum Trade Duration (days): Default is 22 days.
- ATR Period: Default is 12.
- Use 3 Green Days Exit: Toggle to enable or disable the three-green-day exit condition.
How It Works
1. Entry: The strategy monitors daily price action for 3 consecutive down days. When this occurs and if the market is volatile enough (current ATR > 30-day ATR average), it opens a long position.
2. Exit: The position is closed if the price action reverses with 3 consecutive up days or if the trade has been open for the maximum allowed duration - i.e. use it on daily chart.
Risk Management
- The built-in maximum trade duration prevents trades from lingering too long in a non-trending or consolidating market.
- The volatility filter helps ensure that trades are only taken when there is sufficient price movement, potentially increasing the odds of a meaningful move.
Disclaimer
This strategy is provided “as is” without any warranties. It is essential to backtest and validate the performance on your specific instrument and market conditions before deploying live capital. Trading involves significant risk, and you should adjust parameters to match your risk tolerance.
Test and tweak this strategy to see if it fits your trading style and market conditions. Happy trading!

Smart MA Crossover BacktesterSmart MA Crossover Backtester - Strategy Overview
Strategy Name: Smart MA Crossover Backtester
Published on: TradingView
Applicable Markets: Works well on crypto (tested profitably on ETH)
Strategy Concept
The Smart MA Crossover Backtester is an improved Moving Average (MA) crossover strategy that incorporates a trend filter and an ATR-based stop loss & take profit mechanism for better risk management. It aims to capture trends efficiently while reducing false signals by only trading in the direction of the long-term trend.
Core Components & Logic
Moving Averages (MA) for Entry Signals
Fast Moving Average (9-period SMA)
Slow Moving Average (21-period SMA)
A trade signal is generated when the fast MA crosses the slow MA.
Trend Filter (200-period SMA)
Only enters long positions if price is above the 200-period SMA (bullish trend).
Only enters short positions if price is below the 200-period SMA (bearish trend).
This helps in avoiding counter-trend trades, reducing whipsaws.
ATR-Based Stop Loss & Take Profit
Uses the Average True Range (ATR) with a multiplier of 2 to calculate stop loss.
Risk-Reward Ratio = 1:2 (Take profit is set at 2x ATR).
This ensures dynamic stop loss and take profit levels based on market volatility.
Trading Rules
✅ Long Entry (Buy Signal):
Fast MA (9) crosses above Slow MA (21)
Price is above the 200 MA (bullish trend filter active)
Stop Loss: Below entry price by 2× ATR
Take Profit: Above entry price by 4× ATR
✅ Short Entry (Sell Signal):
Fast MA (9) crosses below Slow MA (21)
Price is below the 200 MA (bearish trend filter active)
Stop Loss: Above entry price by 2× ATR
Take Profit: Below entry price by 4× ATR
Why This Strategy Works Well for Crypto (ETH)?
🔹 Crypto markets are highly volatile – ATR-based stop loss adapts dynamically to market conditions.
🔹 Long-term trend filter (200 MA) ensures trading in the dominant direction, reducing false signals.
🔹 Risk-reward ratio of 1:2 allows for profitable trades even with a lower win rate.
This strategy has been tested on Ethereum (ETH) and has shown profitable performance, making it a strong choice for crypto traders looking for trend-following setups with solid risk management. 🚀

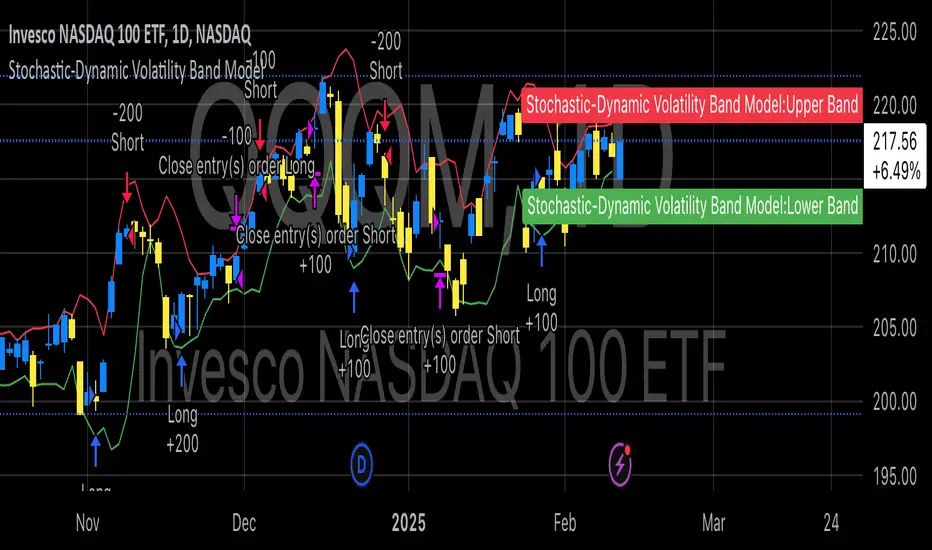
Stochastic-Dynamic Volatility Band ModelThe Stochastic-Dynamic Volatility Band Model is a quantitative trading approach that leverages statistical principles to model market volatility and generate buy and sell signals. The strategy is grounded in the concepts of volatility estimation and dynamic market regimes, where the core idea is to capture price fluctuations through stochastic models and trade around volatility bands.
Volatility Estimation and Band Construction
The volatility bands are constructed using a combination of historical price data and statistical measures, primarily the standard deviation (σ) of price returns, which quantifies the degree of variation in price movements over a specific period. This methodology is based on the classical works of Black-Scholes (1973), which laid the foundation for using volatility as a core component in financial models. Volatility is a crucial determinant of asset pricing and risk, and it plays a pivotal role in this strategy's design.
Entry and Exit Conditions
The entry conditions are based on the price’s relationship with the volatility bands. A long entry is triggered when the price crosses above the lower volatility band, indicating that the market may have been oversold or is experiencing a reversal to the upside. Conversely, a short entry is triggered when the price crosses below the upper volatility band, suggesting overbought conditions or a potential market downturn.
These entry signals are consistent with the mean reversion theory, which asserts that asset prices tend to revert to their long-term average after deviating from it. According to Poterba and Summers (1988), mean reversion occurs due to overreaction to news or temporary disturbances, leading to price corrections.
The exit condition is based on the number of bars that have elapsed since the entry signal. Specifically, positions are closed after a predefined number of bars, typically set to seven bars, reflecting a short-term trading horizon. This exit mechanism is in line with short-term momentum trading strategies discussed in literature, where traders capitalize on price movements within specific timeframes (Jegadeesh & Titman, 1993).
Market Adaptability
One of the key features of this strategy is its dynamic nature, as it adapts to the changing volatility environment. The volatility bands automatically adjust to market conditions, expanding in periods of high volatility and contracting when volatility decreases. This dynamic adjustment helps the strategy remain robust across different market regimes, as it is capable of identifying both trend-following and mean-reverting opportunities.
This dynamic adaptability is supported by the adaptive market hypothesis (Lo, 2004), which posits that market participants evolve their strategies in response to changing market conditions, akin to the adaptive nature of biological systems.
References:
Black, F., & Scholes, M. (1973). The Pricing of Options and Corporate Liabilities. Journal of Political Economy, 81(3), 637-654.
Bollinger, J. (1980). Bollinger on Bollinger Bands. Wiley.
Jegadeesh, N., & Titman, S. (1993). Returns to Buying Winners and Selling Losers: Implications for Stock Market Efficiency. Journal of Finance, 48(1), 65-91.
Lo, A. W. (2004). The Adaptive Markets Hypothesis: Market Efficiency from an Evolutionary Perspective. Journal of Portfolio Management, 30(5), 15-29.
Poterba, J. M., & Summers, L. H. (1988). Mean Reversion in Stock Prices: Evidence and Implications. Journal of Financial Economics, 22(1), 27-59.
Volatility Arbitrage Spread Oscillator Model (VASOM)The Volatility Arbitrage Spread Oscillator Model (VASOM) is a systematic approach to capitalizing on price inefficiencies in the VIX futures term structure. By analyzing the differential between front-month and second-month VIX futures contracts, we employ a momentum-based oscillator (Relative Strength Index, RSI) to signal potential market reversion opportunities. Our research builds upon existing financial literature on volatility risk premia and contango/backwardation dynamics in the volatility markets (Zhang & Zhu, 2006; Alexander & Korovilas, 2012).
Volatility derivatives have become essential tools for managing risk and engaging in speculative trades (Whaley, 2009). The Chicago Board Options Exchange (CBOE) Volatility Index (VIX) measures the market’s expectation of 30-day forward-looking volatility derived from S&P 500 option prices (CBOE, 2018). Term structures in VIX futures often exhibit contango or backwardation, depending on macroeconomic and market conditions (Alexander & Korovilas, 2012).
This strategy seeks to exploit the spread between the front-month and second-month VIX futures as a proxy for term structure dynamics. The spread’s momentum, quantified by the RSI, serves as a signal for entry and exit points, aligning with empirical findings on mean reversion in volatility markets (Zhang & Zhu, 2006).
• Entry Signal: When RSI_t falls below the user-defined threshold (e.g., 30), indicating a potential undervaluation in the spread.
• Exit Signal: When RSI_t exceeds a threshold (e.g., 70), suggesting mean reversion has occurred.
Empirical Justification
The strategy aligns with findings that suggest predictable patterns in volatility futures spreads (Alexander & Korovilas, 2012). Furthermore, the use of RSI leverages insights from momentum-based trading models, which have demonstrated efficacy in various asset classes, including commodities and derivatives (Jegadeesh & Titman, 1993).
References
• Alexander, C., & Korovilas, D. (2012). The Hazards of Volatility Investing. Journal of Alternative Investments, 15(2), 92-104.
• CBOE. (2018). The VIX White Paper. Chicago Board Options Exchange.
• Jegadeesh, N., & Titman, S. (1993). Returns to Buying Winners and Selling Losers: Implications for Stock Market Efficiency. The Journal of Finance, 48(1), 65-91.
• Zhang, C., & Zhu, Y. (2006). Exploiting Predictability in Volatility Futures Spreads. Financial Analysts Journal, 62(6), 62-72.
• Whaley, R. E. (2009). Understanding the VIX. The Journal of Portfolio Management, 35(3), 98-105.

Bollinger Bounce Reversal Strategy – Visual EditionOverview:
The Bollinger Bounce Reversal Strategy – Visual Edition is designed to capture potential reversal moves at price extremes—often termed “bounce points”—by using a combination of technical indicators. The strategy integrates Bollinger Bands, MACD, and volume analysis, and it provides rich on‑chart visual cues to help traders understand its signals and conditions. Additionally, the strategy enforces a maximum of 5 trades per day and uses fixed risk management parameters. This publication is intended for educational purposes and offers a systematic, transparent approach that you can further adjust to fit your market or risk profile.
How It Works:
Bollinger Bands:
A 20‑period simple moving average (SMA) and a user‑defined standard deviation multiplier (default 2.0) are used to calculate the Bollinger Bands.
When the price reaches or crosses these bands (i.e. falls below the lower band or rises above the upper band), it suggests that the price is in an extreme, potentially oversold or overbought, state.
MACD Filter:
The MACD (calculated with standard lengths, e.g. 12, 26, 9) provides momentum information.
For a bullish (long) signal, the MACD line should be above its signal line; for a bearish (short) signal, the MACD line should be below.
Volume Confirmation:
The strategy uses a 20‑period volume moving average to determine if current volume is strong enough to validate a signal.
A signal is confirmed only if the current volume is at or above a specified multiple (by default, 1.0×) of this moving average, ensuring that the move is supported by increased market participation.
Visual Cues:
Bollinger Bands and Fill: The basis (SMA), upper, and lower Bollinger Bands are plotted, and the area between the upper and lower bands is filled with a semi‑transparent color.
Signal Markers: When a long or short signal is generated, corresponding markers (labels) appear on the chart.
Background Coloring: The chart’s background changes color (green for long signals and red for short signals) on the bars where signals occur.
Information Table: An on‑chart table displays key indicator values (MACD, signal line, volume, average volume) and the number of trades executed that day.
Entry Conditions:
Long Entry:
A long trade is triggered when the previous bar’s close is below the lower Bollinger Band and the current bar’s close crosses above it, combined with a bullish MACD condition and strong volume.
Short Entry:
A short trade is triggered when the previous bar’s close is above the upper Bollinger Band and the current bar’s close crosses below it, with a bearish MACD condition and high volume.
Risk Management:
Daily Trade Limit: The strategy restricts trading to no more than 5 trades per day.
Stop-Loss and Take-Profit:
For each position, a stop loss is set at a fixed percentage away from the entry price (typically 2%), and a take profit is set to target a 1:2 risk-reward ratio (typically 4% from the entry price).
Backtesting Setup:
Initial Capital: $10,000
Commission: 0.1% per trade
Slippage: 1 tick per bar
These realistic parameters help ensure that backtesting results reflect the conditions of an average trader.
Disclaimer:
Past performance is not indicative of future results. This strategy is experimental and provided solely for educational purposes. It is essential to backtest extensively and paper trade before any live deployment. All risk management practices are advisory, and you should adjust parameters to suit your own trading style and risk tolerance.
Conclusion:
By combining Bollinger Bands, MACD, and volume analysis, the Bollinger Bounce Reversal Strategy – Visual Edition provides a clear, systematic method to identify potential reversal opportunities at price extremes. The added visual cues help traders quickly interpret signals and assess market conditions, while strict risk management and a daily trade cap help keep trading disciplined. Adjust and refine the settings as needed to better suit your specific market and risk profile.

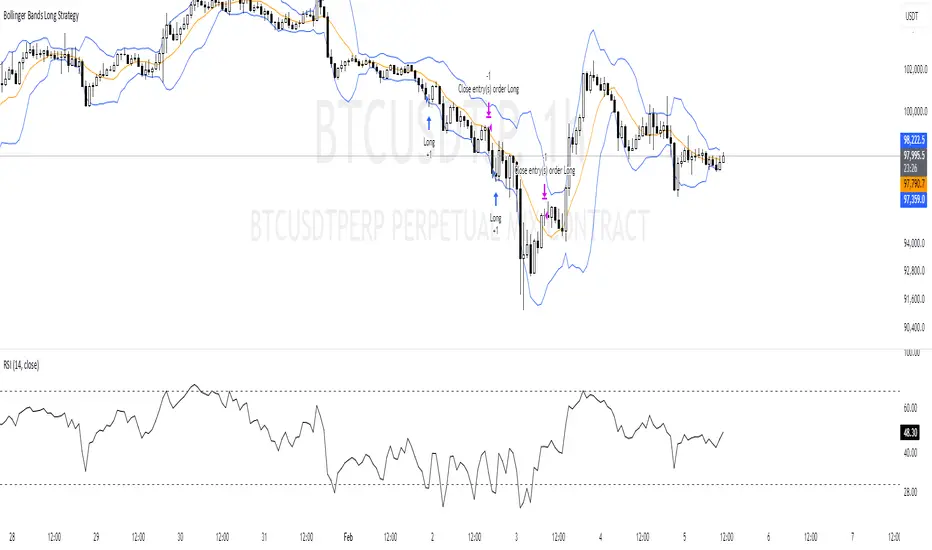
Bollinger Bands Long Strategy
This strategy is designed for identifying and executing long trades based on Bollinger Bands and RSI. It aims to capitalize on potential oversold conditions and subsequent price recovery.
Key Features:
- Bollinger Bands (10,2): The strategy uses Bollinger Bands with a 10-period moving average and a multiplier of 2 to define price volatility.
- RSI Filter: A trade is only triggered when the RSI (14-period) is below 30, ensuring entry during oversold conditions.
- Entry Condition: A long trade is entered immediately when the price crosses below the lower Bollinger Band and the RSI is under 30.
- Exit Condition: The position is exited when the price reaches or crosses above the Bollinger Band basis (20-period moving average).
Best Used For:
- Identifying oversold conditions with a strong potential for a rebound.
- Markets or assets with clear oscillations and volatility e.g., BTC.
**Disclaimer:** This strategy is for educational purposes and should be used with caution. Backtesting and risk management are essential before live trading.
GOLD Volume-Based Entry StrategyShort Description:
This script identifies potential long entries by detecting two consecutive bars with above-average volume and bullish price action. When these conditions are met, a trade is entered, and an optional profit target is set based on user input. This strategy can help highlight momentum-driven breakouts or trend continuations triggered by a surge in buying volume.
How It Works
Volume Moving Average
A simple moving average of volume (vol_ma) is calculated over a user-defined period (default: 20 bars). This helps us distinguish when volume is above or below recent averages.
Consecutive Green Volume Bars
First bar: Must be bullish (close > open) and have volume above the volume MA.
Second bar: Must also be bullish, with volume above the volume MA and higher than the first bar’s volume.
When these two bars appear in sequence, we interpret it as strong buying pressure that could drive price higher.
Entry & Profit Target
Upon detecting these two consecutive bullish bars, the script places a long entry.
A profit target is set at current price plus a user-defined fixed amount (default: 5 USD).
You can adjust this target, or you can add a stop-loss in the script to manage risk further.
Visual Cues
Buy Signal Marker appears on the chart when the second bar confirms the signal.
Green Volume Columns highlight the bars that fulfill the criteria, providing a quick visual confirmation of high-volume bullish bars.
Works fine on 1M-2M-5M-15M-30M. Do not use it on higher TF. Due the lack of historical data on lower TF, the backtest result is limited.

High-Low Breakout Strategy with ATR traling Stop LossThis script is a TradingView Pine Script strategy that implements a High-Low Breakout Strategy with ATR Trailing Stop.created by SK WEALTH GURU, Here’s a breakdown of its key components:
Features and Functionality
Custom Timeframe and High-Low Detection
Allows users to select a custom timeframe (default: 30 minutes) to detect high and low levels.
Tracks the high and low within a user-specified period (e.g., first 30 minutes of the session).
Draws horizontal lines for high and low, persisting for a specified number of days.
Trade Entry Conditions
Long Entry: If the closing price crosses above the recorded high.
Short Entry: If the closing price crosses below the recorded low.
The user can choose to trade Long, Short, or Both.
ATR-Based Trailing Stop & Risk Management
Uses Average True Range (ATR) with a multiplier (default: 3.5) to determine a dynamic trailing stop-loss.
Trades reset daily, ensuring a fresh start each day.
Trade Execution and Partial Profit Taking
Stop-loss: Default at 1% of entry price.
Partial profit: Books 50% of the position at 3% profit.
Max 2 trades per day: If the first trade hits stop-loss, the strategy allows one re-entry.
Intraday Exit Condition
All positions close at 3:15 PM to ensure no overnight risk.

IU Range Trading StrategyIU Range Trading Strategy
The IU Range Trading Strategy is designed to identify range-bound markets and take trades based on defined price ranges. This strategy uses a combination of price ranges and ATR (Average True Range) to filter entry conditions and incorporates a trailing stop-loss mechanism for better trade management.
User Inputs:
- Range Length: Defines the number of bars to calculate the highest and lowest price range (default: 10).
- ATR Length: Sets the length of the ATR calculation (default: 14).
- ATR Stop-Loss Factor: Determines the multiplier for the ATR-based stop-loss (default: 2.00).
Entry Conditions:
1. A range is identified when the difference between the highest and lowest prices over the selected range is less than or equal to 1.75 times the ATR.
2. Once a valid range is formed:
- A long trade is triggered at the range high.
- A short trade is triggered at the range low.
Exit Conditions:
1. Trailing Stop-Loss:
- The stop-loss adjusts dynamically using ATR targets.
- The strategy locks in profits as the trade moves in your favor.
2. The stop-loss and take-profit levels are visually plotted for transparency and easier decision-making.
Features:
- Automated box creation to visualize the trading range.
- Supports one position at a time, canceling opposite-side entries.
- ATR-based trailing stop-loss for effective risk management.
- Clear visual representation of stop-loss and take-profit levels with colored bands.
This strategy works best in markets with defined ranges and can help traders identify breakout opportunities when the price exits the range.

Dynamic Ticks Oscillator Model (DTOM)The Dynamic Ticks Oscillator Model (DTOM) is a systematic trading approach grounded in momentum and volatility analysis, designed to exploit behavioral inefficiencies in the equity markets. It focuses on the NYSE Down Ticks, a metric reflecting the cumulative number of stocks trading at a lower price than their previous trade. As a proxy for market sentiment and selling pressure, this indicator is particularly useful in identifying shifts in investor behavior during periods of heightened uncertainty or volatility (Jegadeesh & Titman, 1993).
Theoretical Basis
The DTOM builds on established principles of momentum and mean reversion in financial markets. Momentum strategies, which seek to capitalize on the persistence of price trends, have been shown to deliver significant returns in various asset classes (Carhart, 1997). However, these strategies are also susceptible to periods of drawdown due to sudden reversals. By incorporating volatility as a dynamic component, DTOM adapts to changing market conditions, addressing one of the primary challenges of traditional momentum models (Barroso & Santa-Clara, 2015).
Sentiment and Volatility as Core Drivers
The NYSE Down Ticks serve as a proxy for short-term negative sentiment. Sudden increases in Down Ticks often signal panic-driven selling, creating potential opportunities for mean reversion. Behavioral finance studies suggest that investor overreaction to negative news can lead to temporary mispricings, which systematic strategies can exploit (De Bondt & Thaler, 1985). By incorporating a rate-of-change (ROC) oscillator into the model, DTOM tracks the momentum of Down Ticks over a specified lookback period, identifying periods of extreme sentiment.
In addition, the strategy dynamically adjusts entry and exit thresholds based on recent volatility. Research indicates that incorporating volatility into momentum strategies can enhance risk-adjusted returns by improving adaptability to market conditions (Moskowitz, Ooi, & Pedersen, 2012). DTOM uses standard deviations of the ROC as a measure of volatility, allowing thresholds to contract during calm markets and expand during turbulent ones. This approach helps mitigate false signals and aligns with findings that volatility scaling can improve strategy robustness (Barroso & Santa-Clara, 2015).
Practical Implications
The DTOM framework is particularly well-suited for systematic traders seeking to exploit behavioral inefficiencies while maintaining adaptability to varying market environments. By leveraging sentiment metrics such as the NYSE Down Ticks and combining them with a volatility-adjusted momentum oscillator, the strategy addresses key limitations of traditional trend-following models, such as their lagging nature and susceptibility to reversals in volatile conditions.
References
• Barroso, P., & Santa-Clara, P. (2015). Momentum Has Its Moments. Journal of Financial Economics, 116(1), 111–120.
• Carhart, M. M. (1997). On Persistence in Mutual Fund Performance. The Journal of Finance, 52(1), 57–82.
• De Bondt, W. F., & Thaler, R. (1985). Does the Stock Market Overreact? The Journal of Finance, 40(3), 793–805.
• Jegadeesh, N., & Titman, S. (1993). Returns to Buying Winners and Selling Losers: Implications for Stock Market Efficiency. The Journal of Finance, 48(1), 65–91.
• Moskowitz, T. J., Ooi, Y. H., & Pedersen, L. H. (2012). Time Series Momentum. Journal of Financial Economics, 104(2), 228–250.

Sunil BB Blast Heikin Ashi StrategySunil BB Blast Heikin Ashi Strategy
The Sunil BB Blast Heikin Ashi Strategy is a trend-following trading strategy that combines Bollinger Bands with Heikin-Ashi candles for precise market entries and exits. It aims to capitalize on price volatility while ensuring controlled risk through dynamic stop-loss and take-profit levels based on a user-defined Risk-to-Reward Ratio (RRR).
Key Features:
Trading Window:
The strategy operates within a user-defined time window (e.g., from 09:20 to 15:00) to align with market hours or other preferred trading sessions.
Trade Direction:
Users can select between Long Only, Short Only, or Long/Short trade directions, allowing flexibility depending on market conditions.
Bollinger Bands:
Bollinger Bands are used to identify potential breakout or breakdown zones. The strategy enters trades when price breaks through the upper or lower Bollinger Band, indicating a possible trend continuation.
Heikin-Ashi Candles:
Heikin-Ashi candles help smooth price action and filter out market noise. The strategy uses these candles to confirm trend direction and improve entry accuracy.
Risk Management (Risk-to-Reward Ratio):
The strategy automatically adjusts the take-profit (TP) level and stop-loss (SL) based on the selected Risk-to-Reward Ratio (RRR). This ensures that trades are risk-managed effectively.
Automated Alerts and Webhooks:
The strategy includes automated alerts for trade entries and exits. Users can set up JSON webhooks for external execution or trading automation.
Active Position Tracking:
The strategy tracks whether there is an active position (long or short) and only exits when price hits the pre-defined SL or TP levels.
Exit Conditions:
The strategy exits positions when either the take-profit (TP) or stop-loss (SL) levels are hit, ensuring risk management is adhered to.
Default Settings:
Trading Window:
09:20-15:00
This setting confines the strategy to the specified hours, ensuring trading only occurs during active market hours.
Strategy Direction:
Default: Long/Short
This allows for both long and short trades depending on market conditions. You can select "Long Only" or "Short Only" if you prefer to trade in one direction.
Bollinger Band Length (bbLength):
Default: 19
Length of the moving average used to calculate the Bollinger Bands.
Bollinger Band Multiplier (bbMultiplier):
Default: 2.0
Multiplier used to calculate the upper and lower bands. A higher multiplier increases the width of the bands, leading to fewer but more significant trades.
Take Profit Multiplier (tpMultiplier):
Default: 2.0
Multiplier used to determine the take-profit level based on the calculated stop-loss. This ensures that the profit target aligns with the selected Risk-to-Reward Ratio.
Risk-to-Reward Ratio (RRR):
Default: 1.0
The ratio used to calculate the take-profit relative to the stop-loss. A higher RRR means larger profit targets.
Trade Automation (JSON Webhooks):
Allows for integration with external systems for automated execution:
Long Entry JSON: Customizable entry condition for long positions.
Long Exit JSON: Customizable exit condition for long positions.
Short Entry JSON: Customizable entry condition for short positions.
Short Exit JSON: Customizable exit condition for short positions.
Entry Logic:
Long Entry:
The strategy enters a long position when:
The Heikin-Ashi candle shows a bullish trend (green close > open).
The price is above the upper Bollinger Band, signaling a breakout.
The previous candle also closed higher than it opened.
Short Entry:
The strategy enters a short position when:
The Heikin-Ashi candle shows a bearish trend (red close < open).
The price is below the lower Bollinger Band, signaling a breakdown.
The previous candle also closed lower than it opened.
Exit Logic:
Take-Profit (TP):
The take-profit level is calculated as a multiple of the distance between the entry price and the stop-loss level, determined by the selected Risk-to-Reward Ratio (RRR).
Stop-Loss (SL):
The stop-loss is placed at the opposite Bollinger Band level (lower for long positions, upper for short positions).
Exit Trigger:
The strategy exits a trade when either the take-profit or stop-loss level is hit.
Plotting and Visuals:
The Heikin-Ashi candles are displayed on the chart, with green candles for uptrends and red candles for downtrends.
Bollinger Bands (upper, lower, and basis) are plotted for visual reference.
Entry points for long and short trades are marked with green and red labels below and above bars, respectively.
Strategy Alerts:
Alerts are triggered when:
A long entry condition is met.
A short entry condition is met.
A trade exits (either via take-profit or stop-loss).
These alerts can be used to trigger notifications or webhook events for automated trading systems.
Notes:
The strategy is designed for use on intraday charts but can be applied to any timeframe.
It is highly customizable, allowing for tailored risk management and trading windows.
The Sunil BB Blast Heikin Ashi Strategy combines two powerful technical analysis tools (Bollinger Bands and Heikin-Ashi candles) with strong risk management, making it suitable for both beginners and experienced traders.
Feebacks are welcome from the users.

Dynamic Volatility Differential Model (DVDM)The Dynamic Volatility Differential Model (DVDM) is a quantitative trading strategy designed to exploit the spread between implied volatility (IV) and historical (realized) volatility (HV). This strategy identifies trading opportunities by dynamically adjusting thresholds based on the standard deviation of the volatility spread. The DVDM is versatile and applicable across various markets, including equity indices, commodities, and derivatives such as the FDAX (DAX Futures).
Key Components of the DVDM:
1. Implied Volatility (IV):
The IV is derived from options markets and reflects the market’s expectation of future price volatility. For instance, the strategy uses volatility indices such as the VIX (S&P 500), VXN (Nasdaq 100), or RVX (Russell 2000), depending on the target market. These indices serve as proxies for market sentiment and risk perception (Whaley, 2000).
2. Historical Volatility (HV):
The HV is computed from the log returns of the underlying asset’s price. It represents the actual volatility observed in the market over a defined lookback period, adjusted to annualized levels using a multiplier of \sqrt{252} for daily data (Hull, 2012).
3. Volatility Spread:
The difference between IV and HV forms the volatility spread, which is a measure of divergence between market expectations and actual market behavior.
4. Dynamic Thresholds:
Unlike static thresholds, the DVDM employs dynamic thresholds derived from the standard deviation of the volatility spread. The thresholds are scaled by a user-defined multiplier, ensuring adaptability to market conditions and volatility regimes (Christoffersen & Jacobs, 2004).
Trading Logic:
1. Long Entry:
A long position is initiated when the volatility spread exceeds the upper dynamic threshold, signaling that implied volatility is significantly higher than realized volatility. This condition suggests potential mean reversion, as markets may correct inflated risk premiums.
2. Short Entry:
A short position is initiated when the volatility spread falls below the lower dynamic threshold, indicating that implied volatility is significantly undervalued relative to realized volatility. This signals the possibility of increased market uncertainty.
3. Exit Conditions:
Positions are closed when the volatility spread crosses the zero line, signifying a normalization of the divergence.
Advantages of the DVDM:
1. Adaptability:
Dynamic thresholds allow the strategy to adjust to changing market conditions, making it suitable for both low-volatility and high-volatility environments.
2. Quantitative Precision:
The use of standard deviation-based thresholds enhances statistical reliability and reduces subjectivity in decision-making.
3. Market Versatility:
The strategy’s reliance on volatility metrics makes it universally applicable across asset classes and markets, ensuring robust performance.
Scientific Relevance:
The strategy builds on empirical research into the predictive power of implied volatility over realized volatility (Poon & Granger, 2003). By leveraging the divergence between these measures, the DVDM aligns with findings that IV often overestimates future volatility, creating opportunities for mean-reversion trades. Furthermore, the inclusion of dynamic thresholds aligns with risk management best practices by adapting to volatility clustering, a well-documented phenomenon in financial markets (Engle, 1982).
References:
1. Christoffersen, P., & Jacobs, K. (2004). The importance of the volatility risk premium for volatility forecasting. Journal of Financial and Quantitative Analysis, 39(2), 375-397.
2. Engle, R. F. (1982). Autoregressive conditional heteroskedasticity with estimates of the variance of United Kingdom inflation. Econometrica, 50(4), 987-1007.
3. Hull, J. C. (2012). Options, Futures, and Other Derivatives. Pearson Education.
4. Poon, S. H., & Granger, C. W. J. (2003). Forecasting volatility in financial markets: A review. Journal of Economic Literature, 41(2), 478-539.
5. Whaley, R. E. (2000). The investor fear gauge. Journal of Portfolio Management, 26(3), 12-17.
This strategy leverages quantitative techniques and statistical rigor to provide a systematic approach to volatility trading, making it a valuable tool for professional traders and quantitative analysts.
