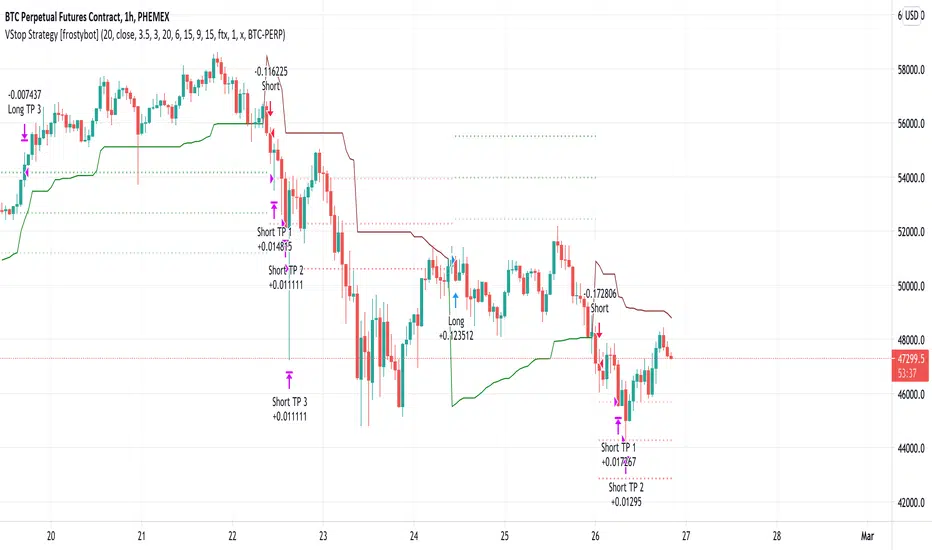
Trailing SL Strategy [QuantNomad]I'm a big fan of simple strategies.
This one is a very simple one. So it consists only from one Trailing SL. When SL is hit, the position is reversed and SL is tracked for a new position.
You can choose one of 3 types of SL:
% of your price
ATR - it is calculated as current ATR * multiplier
Absolute
As you can see even this simple strategy can show pretty good results.
Volatility stop
ATR Stoploss Lines - Minimize Risk | Maximize ProfitThe ATR Stoploss is best used as a trailing stop. While actively managing your trades, move your stops up as price increases/decreases.
There is an offset of 1 candle, so the ATR will only be based on closed candles. This prevents you from moving your stop's when you really shouldn't.
The top lines are used for short positions and the bottom lines are used for long positions.
You can adjust the distance of the ATR lines from your candles by changing the multiplier in the settings.
You may want to increase the multiplier to 2-3 on less volatile assets, and keep it ~1.75 for volatile assets like BTC.
Feel free to reach out if you need any tips or more help with using these. Just remember, this indicator should only be used to manage your trades, not enter them.
Volatility Stop MTFThis is a multi-timeframe version of our Volatility Stop , an ATR-based trend detector that can be used as a stop.
► Timeframe selection
The higher timeframe can be selected using 3 different ways:
• By steps (60 min., 1D, 3D, 1W, 1M, 1Y).
• As a multiple of the current chart's resolution, which can be fractional, so 3.5 will work.
• Fixed.
Note that you can also use this indicator without the higher timeframe functionality. It will then behave as our normal Volatility Stop would.
► Stop breaches
Two modes of stop-breaching logic can be selected.
• In the default, Early Breach mode, the stop is considered breached when a bar at the chart's current resolution breaches the higher timeframe stop.
• You may also choose to calculate breaches on the higher timeframe information only.
Choosing the Early Breach mode has the advantage of generating faster exits. It will create a state of limbo where the stop has been breached but the Volatility Stop trend has not yet reversed. The impact of detecting earlier exits to minimize losses comes, as is usually the case, at the cost of a compromise: if the stop is breached early in a long trend, the indicator will then spend most of that trend in limbo. Sizeable portions of a trend can thus be missed.
A few options are provided when you use Early Breach mode:
• A red triangle can identify early breaches (default).
• You can color bars or the background to identify limbo states.
When in limbo, the color used to plot the indicator's line or shapes will always be darker.
► Alerts
Five pre-defined alerts are supplied:
• #1: On any trend change.
• #2: On changes into an uptrend.
• #3: On changes into a downtrend.
• #4: Only on breaches of the uptrend by the chart's bars (Early Breach mode). Will not trigger on a trend change.
• #5: Only on breaches of the downtrend by the chart's bars (Early Breach mode). Will not trigger on a trend change.
As usual, alerts should be configured to trigger Once Per Bar Close . When creating alerts, you will see a warning to the effect that potentially repainting code is used, even if the indicator's default non-repainting mode is active. The warning is normal.
► Other features
• You can color bars using the indicator's up/down state. When bars are colored, up bars are more brightly colored.
• The HTF line is non-repainting by default, but you can allow it to repaint.
• You can confirm the higher timeframe used by displaying it at a selectable distance from the last bar on the chart.
• Choice of 2 color themes.
• Choice of display as a line, circles, diamonds or arrows. The line can be used with the other shapes. If no line is required, set its thickness to zero.
Enjoy!
Look first. Then leap.
Ori Double-Sided Trailing Stoploss SystemGenerally trailing stoplosses are one sided. Trailing uptrend or downtrend. Also there are continuous trailing indicators that uses same settings for both uptrend and downtrend. It is good for improving the original approach to complete the system but not enough. Seperating values for uptrend and downtrend opening much more possibilities. It is better for sticking to trend and also better for showing your bias towards one side with different stoplevels. There are different options to build the system. You can calculate the stoploss from a moving average. Aka reference ma. Also calculating stoploss method can differ. You can use percentage, atr, standart deviation and ori. Ori is calculating highest and lowest level in a period and dividing it to the period. Others are classic. There is options for their settings. Also there is gap between uptrend stoploss and downtrend stoploss at switch areas, there is an option to decrease this gap in settings. Also you can use reference ma for switching between trends but it is also being used in calculating stoploss level so you may want a different switch mechanism. Aka seperate signal line. Other options are for visual settings such as candle colors. There is an indicator that i wrote "Ori Double-Sided MOST". That one is using reference ma also for signal line. There is no gap reducing and using percentage for calculating. It is easier to use but with less option. You can also improve that indicator in this indicator with more indicators.
Volatility StopThis is a new version of the classic Volatility Stop originally published in 2014 by admin and written in Pine v1. While the code has evolved, its logic is identical. It is an ATR-based trend detector that can also be used as a stop. It belongs to the same family of indicators as:
• Charles Le Beau's Chandelier Exit ,
• Olivier Seban's Super Trend , and
• Sylvain Vervoort's Average True Range Trailing Stop .
Unlike the Chandelier Exit , Volatility Stop will not move against the trend.
This new version is written in Pine v4. The indicator can be used as a chart overlay, like the original. The calculations have been functionalized for easier reuse, so it is now easier to lift the logic out of the script and use it in others.
Features
• Choice of 2 color themes.
• Choice of display as a line, circles, diamonds or arrows. The line can be used with the other shapes. If no line is required, set its thickness to zero.
• Same default of length=20 and ATR factor=2 used in the original Volatility Stop.
• 3 alerts: on any trend change, or on changes into up or downtrends only. Alerts should be configured to trigger Once Per Bar Close .
Original version:
Look first. Then leap.
Relativity Adaptive Stop-LossRelativity Adaptive Stop-Loss is a stop-loss technique that uses the Relativity Autonomous Distribution Blocks algorithm.
For detailed info about Relativity Autonomous Distribution Blocks :
*** Features
This structure is different from standard stop-losses.
The base frame is based on "Market Adaptive Stop-Loss" script.
For detailed information about Market Adaptive Stop-Loss:
This script uses the Relativity Autonomous Distribution Blocks as cross method.
Tradeable / Non Tradeable Region Detector :
This script separates tradeable and non-tradeable regions with a coloring method.
Plotting Rules :
* Maroon : Uncorfirmed Short Positions
* Teal : Unconfirmed Long Positions
* Green : Confirmed Long Positions
* Red : Confirmed Short Positions
This script can be used in only 1W time frame. (TF = 1W )
Does not repaint on 1W and larger time frames. ( Source = close )
*** Settings :
The only option here is the ATR multiplier.
The default use value of this ATR multiplier, which is of the standard of stop-loss, is 2.You can set it from the menu.
No alert is set.
Because the positive and negative regions are the same as Relativity Autonomous Distribution Blocks.
Since the traders can trade according to the support and resistance outside the definite regions, the unnecessary signal was confused and the alerts were removed.
*** USAGE
The Stop-Loss indicator can slide on the chart.
So you have to make sure you put it in right place.
Using this script in a new pane below will radically solve slip problems.
Stop-Loss values do not slip definitely.The values can select from the alignment.
NOTE :
Some structures (Market Adaptive Stop-Loss) and design in this script are inspired by everget's Chandelier Exit script :
Best regards.
Autonomous LSTM Stop-LossStructure
Autonomous LSTM Stop-Loss is a stop-loss technique that uses the Autonomous LSTM algorithm.
For detailed info about Autonomous LSTM :
*** Features
This structure is different from standard stop-losses.
The base frame is based on "Market Adaptive Stop-Loss" script.
For detailed information about Market Adaptive Stop-Loss:
This script uses the Autonomous LSTM as cross method.
Tradeable / Non Tradeable Region Detector :
This script separates tradeable and non-tradeable regions with a coloring method.
Plotting Rules :
* Maroon : Uncorfirmed Short Positions
* Teal : Unconfirmed Long Positions
* Green : Confirmed Long Positions
* Red : Confirmed Short Positions
This script can be used in all time frames.
Does not repaint. ( Source = close )
*** Settings :
The only option here is the ATR multiplier.
The default use value of this ATR multiplier, which is of the standard of stop-loss, is 2.You can set it from the menu.
No alert is set.
Because the positive and negative regions are the same as Autonomous LSTM.
Since the traders can trade according to the support and resistance outside the definite regions, the unnecessary signal was confused and the alerts were removed.
*** Usage
The Stop-Loss indicator can slide on the chart.
So you have to make sure you put it in place.
Since this is a region scan from the OHLC levels, indicator contains small blue dots to the ohlc levels and made it serve as a guide.
However, since we cannot know the OHLC values precisely, it is best to use them as follows:
Because it is often forgotten to put it in place:
(OHLC : Average of Open, High, Low, and Closing prices for each period)
Using this script in a new pane below will radically solve slip problems.
Stop-Loss values do not slip definitely.The values are selected from the alignment.
NOTE :
Some structures (Market Adaptive Stop-Loss) and design in this script are inspired by everget's Chandelier Exit script :
Best regards.
BEST Trailing Stop StrategyHello traders
Here we go again.... with the second strategy snippet.
Reminder: the first snipper was a Trailing Profit strategy script
What's on the menu?
A trailing stop is designed to protect gains by enabling a trade to remain open and continue to profit as long as the price is moving in the investor's favor.
The order closes the trade if the price changes direction by a specified percentage or dollar amount.
Trigger me I'm famous
I developed many trading strategies in my career and often I've been asked to trigger a trailing-stop once a certain % move has been made.
On the screenshot below, the SL trigger is plotted in maroon.
Once the price goes past that level for the first time, I'll start trailing the trailing stop level.
In other words, when we see a price makes an interesting move in percentage value - we decide to trail the stop for at least not losing any more
All the BEST
Dave
Stop ATRStop based on price volatitlty.
It uses ATR indicator multiplied by a factor as a reference for protective stop.
Guppy CBLThis is the Count Back Line script from the book Guppy Trading by Daryl Guppy.
It is usually used as a stop loss line, but can also be used to find entries.
Hope someone finds it usefull, if you find anything that is wrong with it, please let me know and I will try to fix it.
This is my first PineScript, hope it is working as intended.
Trailing % StopTrailing % Stop is a simple Stop Loss indicator which users have to define a % percent rate to trail the price like MOVING STOP LOSS "MOST" Indicator.
The main difference is MOST refers to exponential moving averages although Trail % Stop refers to source price.
Default price of source is CLOSE price which can be optimized by the user.
"What is a Trailing Stop-Loss?
A trailing stop-loss order is a special type of trade order where the stop-loss price is not set at a single, absolute dollar amount, but instead is set at a certain percentage or a certain dollar amount below the market price. A trailing stop-loss is sometime referred to simply as a trailing stop.
How a Trailing Stop-Loss Works
When the price goes up, it drags the trailing stop-loss along with it, but when the price stops going up, the stop-loss price remains at the level it was dragged to.
A trailing stop-loss is a way to automatically protect yourself from an investment's downside while locking in the upside.
For example, you buy Company XYZ for $10. You decide that you don't want to lose more than 5% on your investment, but you want to be able to take advantage of any price increases. You also don't want to have to constantly monitor your trades to lock in gains.
You set a trailing stop on XYZ that orders your broker to automatically sell if the price dips more than 5% below the market price.
The benefits of the trailing stop are two-fold. First, if the stock moves against you, the trailing stop will trigger when XYZ hits $9.50, protecting you from futher downside.
But if the stock goes up to $20, the trigger price for the trailing stop comes up along with it. At a price of $20, the trailing stop will only trigger a sale if the stock drops below $19. This helps you lock in most of the gains from the stock's rally.
In the example, you could also decide you don't want to lose more than $2 on your $10 investment. If the stock goes up to $20, the trailing stop-loss would drag along behind the price and only trigger a sale if the stock falls to $18.
Why a Trailing Stop-Loss Matters
A trailing stop-loss can be good for investors who may not have enough discipline to lock-in gains or cut losses. It removes some of the emotion from the trading process and offers some capital protection automatically.
There are some drawbacks to consider. First, you need to consider your trailing stop percentage or amount very carefully. If you're investing in a particularly volatile stock, you could find the stop level triggered fairly frequently."
Long Short signals and alarms are also included.
TAILSThis script confirms how to manage the trade. We use this alongside our other trading tools in Level 3.
Market Adaptive Stop-LossI realized that the zone changes in the stoploss remained slow, so I couldn't make enough use of the characteristics of technical indicators when opening positions.
This pushed me to keep stop-loss under the influence of a dependent variable.
This script helped me a lot (everget) :
I've redesigned the stop-loss to be affected by intersections.
Therefore, this script is also suitable for adaptive moving averages, fractional periods.
Script features:
1.You can select calculation methods created by using various technical analysis methods from the scripts' settings:
-Moving Average Convergence Divergence ( Macd )
-Stochastic Oscillator ( Stoch )
-Stochastic Relative Strength Index (StochRSI)
-Stochastic Money Flow Index (StochMFI ) (More info : )
-Know Sure Thing ( KST )
-OBV ( On Balance Volume )
-SMA ( Simple Moving Average )
-EMA ( Exponential Moving Average )
-FISHERTRANSFORM ( Fisher Transform )
-AWESOMEOSCILLATOR( Awesome Oscillator )
-PSAR ( Parabolic Stop and Reverse - Parabolic SAR )
-HULLMA( Hull Moving Average )
-VWMA ( Volume Weighted Moving Average )
-RMA (Moving Average using in Relative Strength Index calculations.)
-COG (Center of Gravity )
-ACC-DIST ( Accumulation / Distribution Index )
2 - The region is determined according to the above calculation methods and if it is larger or smaller than the previous stop loss level.
And if the price in the negative zone is lower than the stoploss, it is the exact signal and is shown with more highlighted colors.
And, in the positive zone, where the price is greater than the stoploss, the trade zones are certain.
Shown with more highlighted colors.
If the zones are correct but stop-loss is not suitable for opening positions:
In other words, if the stop-loss is above/under the highest-lowest levels in the positive zone or if the stop loss is located in the lower zone in the negative zone, these zones are shown to be darker and dimmed so that they do not cause false movements.
*** SUMMARY : As a result, you can use this script with support and resistances,and trend lines to get good results.
I hope it helps in your analyzes. Best regards.
Hendo's Volatillity Stop HelperA simple indicator helping you with stop loss placement. It uses the recent volatility in the market to generate a band above and below price.
If you struggle with stop loss placement but already understand entries, exits and direction this indicator might be one for you.
Pairs extremely well with certain oscillators, price action trading and pivot point trading.
Comes with 8 settings to facilitate both types of traders:
High acuraccy, low risk/reward ratio
Low acuraccy, high risk/reward ratio
Colours & Transparancy are fully customizable. Access is free, source code is protected and will remain to be so.
In order to achieve the best results I highly suggest you to place stop losses below the lower band (in longs) and above the upper band (in shorts).
Stay tuned for more!
Breakout Notifier LONGLong trades based on our breakout logic, params you can configure are Stop Loss and breakout % to track
Lancelot vstop intraday trending strategyDear all,
Free strategy again.
I found using 3 volatility stop with different settings could be very helpful when trading an intraday trending market.
With the ATR setting or 5, 10, 15, we can weed out many false break.
Vstop setting is OHLC4.
On the other hand, this strategy also utilize Renko as part of the strategy, so you could say this strategy is mainly an intraday break out trend following strategy.
Works well on BTCUSD XBTUSD, as well as other major liquid alt Pairs.
And lastly,
Save Hong Kong, the revolution of our times.
Silicone Re-calibrate ATRInspired by @bitmexstorm study Volatility-calibrated ATR
This study features two different ATR trail derivative concepts-Default one is called- "Silicone", and the alternative is called- "Mercurial. To decrease confusion during backtesting, trails plots with distinct color palette.
Options include the ability to apply a smoothening filter that affects both modes as well as an adaptive/fixed mode for the "Silicone" trail.
Parameters for trail dynamics/behavior is unlocked(!Parameters in publish version is far from optimized! Need serious testing! )
Candle Coloring reflects trail direction.
Feedback on optimal periods and multipliers is needed and appreciated
ATR Trailing Stop Indicator [Chart]I rely on this script for both my live trading and my backtesting process. I couldn’t live without it. It’s extremely simple – all it does is calculate your trailing stop price.
How It Works
The first number in blue is the current ATR (pips). The second number in green is your trailing stop loss price for Long trades, and the third number in red is your trailing stop loss price for Short trades.
For short trades, the stop loss price is calculated by adding the current ATR value to the highest-high of the given lookback period.
For long trades, the stop loss price is calculated by subtracting the current ATR value from the lowest-low of the given lookback period.
Settings
ATR Length:
ATR period (how many candles to include in the calculation).
Use Structure?
If set to true, the script will use swing lows and highs in its calculation. If set to false, the script will ignore swing lows and highs and give you the distance of the ATR from the current candle close instead.
How Far To Look Back For High/Lows:
Candle lookback period for swing high/lows.
ATR X ?:
This controls your ATR multiplier. For example, if you want to use a 2x ATR stop, set this to 2.
Tool Companion:
Here is the tool companion script for this indicator:
Source Code:
Go to zenandtheartoftrading.com for the source code – it’s free!
ATR Trailing Stop Loss IndicatorI rely on this script for both my live trading and my backtesting process. I couldn’t live without it. It’s extremely simple – all it does is calculate your trailing stop price.
How It Works
The first number in blue is the current ATR (pips). The second number in green is your trailing stop loss price for Long trades, and the third number in red is your trailing stop loss price for Short trades.
For short trades, the stop loss price is calculated by adding the current ATR value to the highest-high of the given lookback period.
For long trades, the stop loss price is calculated by subtracting the current ATR value from the lowest-low of the given lookback period.
Settings
ATR Length:
ATR period (how many candles to include in the calculation).
Use Structure?
If set to true, the script will use swing lows and highs in its calculation. If set to false, the script will ignore swing lows and highs and give you the distance of the ATR from the current candle close instead.
How Far To Look Back For High/Lows:
Candle lookback period for swing high/lows.
ATR X ?:
This controls your ATR multiplier. For example, if you want to use a 2x ATR stop, set this to 2.
Chart Companion:
Here is the chart companion script for this indicator:
Source Code:
Go to zenandtheartoftrading.com for the source code – it’s free!
ATR (Average True Range) By TimeWhat is ATR By Time?
This premium indicator was inspired by my RVOL By Time indicator . It works on Stocks, Forex, Crypto and most Futures markets. Instead of calculating the ATR by recent price data, it calculates an ATR value for each candle based on that candle’s time of day.
For example, if you set the Lookback setting on this indicator to 14, then instead of calculating the ATR based on the past 14 candles, it will calculate an ATR value based on the past 14 trading sessions for each candle.
This is extremely useful for day traders in particular as it allows you to gauge the average range of candles during certain times of day instead of only by the most recent price action.
It also draws a regular ATR (optional) – so this is essentially an enhanced ATR script that gives you multiple readings on price volatility.
If you are interested, you can purchase access to the script or register for a free trial on my website: ATR By Time Feature Page .
Why Does It Cost Money?
The reason why this is a premium script that requires payment to access is because it took a lot of time, research and development in order to create. The other advantage of charging for it is that it retains exclusivity to only a select few dedicated traders.
By paying the yearly fee you get access to ALL of my premium indicators including lifetime updates and technical support.
If you don’t want to pay for this script then I completely understand and I have plenty of other free indicators and scripts that you might be interested in!
Free Trial
I am a trader myself and so I know how skeptical you might be that this indicator is worth your time and money. That is why I am offering a free trial of this indicator.
All you need to do to initiate your trial is Join My Mailing List/ on my website: zenandtheartoftrading.com
How It Works
This script uses a complex formula to calculate ATR values across distant historical bars.
Depending on the timeframe you select it will skip through historical bars to find previous bars from the same time of day. It collects these values then applies the traditional ATR formula to them.
The ATR value is determined by the maximum result of the following three calculations:
- Current high minus the current low
- The absolute value of the current high minus the previous close
- The absolute value of the current low minus the previous close
- Whichever of these three calculations comes out highest, that is your ATR for the given candle.
Once this value is calculated for historical bars the ATR indicator’s reading is typically determined by a 14-period moving average of these individual ATR values. So the ATR reading you see on your screen is an average of the past 14 ATR values.
This means that as markets expand and contract this volatility reading will adapt to the change in candle price ranges.
The difference with the ATR By Time indicator’s calculation formula is that rather than referencing recent bars it references bars based on their time of day.
For example, if you are on the 1-Hour chart and you check the ATR By Time value at 9:00AM with a Lookback period of 14, then the value you see will be the result of the ATR calculation of every 9:00AM 1-Hour candle over the past 14 trading sessions.
You can also choose to enable the ATR moving average in the settings menu if you wish. This will give you a smoothed ATR reading by averaging the current session’s ATR value with previous sessions.
This versatility gives you a sophisticated reading on price volatility which is particularly helpful for day trade setups based around market opens or market closes when volatility tends to spike.
The regular ATR indicator will not account for this on the lower timeframes, but this indicator will!
Examples
Stocks - Heatmap Scheme with regular ATR
Stocks - Price Scheme - No ATR
Stocks - Traffic Scheme - Session Average Line RMA
Stocks - Trigger Scheme - 10 sessions
Forex - RMA
Forex - No RMA
Forex - Normal ATR Stop
Forex - Session ATR Stop
Alert-QuarryLake Indicator Map - ATR Trend Following Strategy A lot of times I don't like my chart crowding with indicators, thus the reason for creating this script for my strategy QuarryLake.
This script also comes with alert.
Below is the explanation for QuarryLake
I have also updated the script in version 4.
This strategy consists of 3 indicators that I found works quite well together.
Keltner Channel, Waddah Attah Explosion, and Volatility Stop.
You can find WAE here
KC Period = 200
KCATR = 5
Vstop Period = 3
Vstop Mult = 1.5
Long when close > KC, close > Vstop, WAE trendUp
Short when close < KC, close < Vstop, WAE trendDown
Works well on BTCUSD XBTUSD, as well as other major liquid Pair.
Feel free to follow me on Twitter @Lancelot_Auger for more free Alpha.
Please acknowledge my effort by like and follow.
And lastly,
Save Hong Kong, the revolution of our times.
CloudRest ATR based cloudThis is an indicator I have been working on for the past 2 years, developed specifically for cryptocurrency.
It is primarily a trend following indicator with great success and it performs the best in 4hrs to the weekly chart.
There are two components of this indicator.
The baseline from Ichimoku cloud and volatility stop .
baseline period = 26
volatility stop = 1.5ATR, 3
You can view this as the main component of a trend following system but you will need other confirmation indicators to confirm your entry.
Feel free to modify the script for your own system.
Feel free to follow me on twitter @Lancelot_Auger
I will be posting more content in the future, stay tuned.
And lastly,
Free hong kong, the revolution of our time!