Volatility-Volume Index (VVI)Volatility-Volume Index (VVI) – Indicator Description
The Volatility-Volume Index (VVI) is a custom trading indicator designed to identify market consolidation and anticipate breakouts by combining volatility (ATR) and trading volume into a single metric.
How It Works
Measures Volatility : Uses a 14-period Average True Range (ATR) to gauge price movement intensity.
Tracks Volume : Monitors trading activity to identify accumulation or distribution phases.
Normalization : ATR and volume are normalized using their respective 20-period Simple Moving Averages (SMA) for a balanced comparison.
Interpretation
VVI < 1: Low volatility and volume → Consolidation phase (range-bound market).
VVI > 1: Increased volatility and/or volume → Potential breakout or trend continuation.
How to Use VVI
Detect Consolidation:
Look for extended periods where VVI remains below 1.
Confirm with sideways price movement in a narrow range.
Anticipate Breakouts:
A spike above 1 signals a possible trend shift or breakout.
Why Use VVI?
Unlike traditional volatility indicators (ATR, Bollinger Bands) or volume-based tools (VWAP), VVI combines both elements to provide a clearer picture of consolidation zones and breakout potential.
Indicatore volume

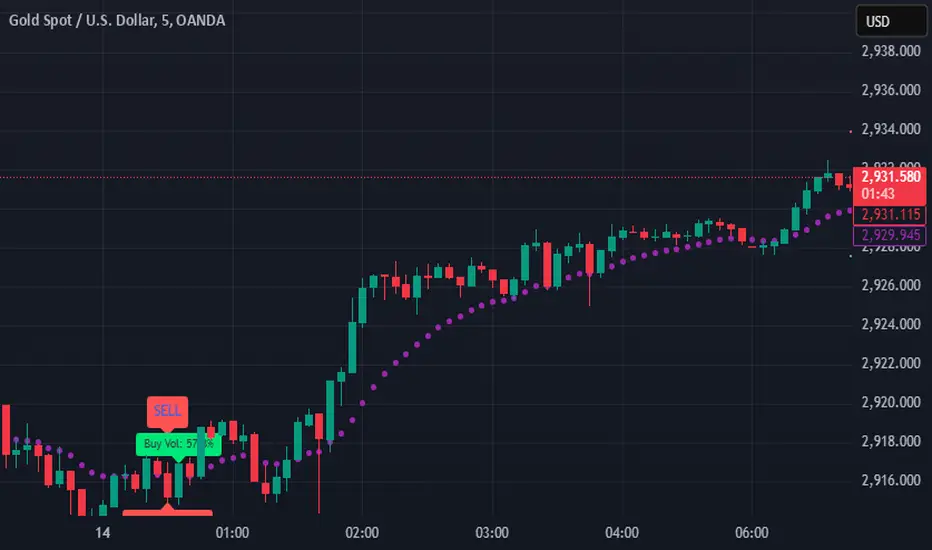
SIOVERSE EMA 15 with Buy/Sell Signals, Support & ResistanceThis Pine Script indicator is designed for TradingView and combines Exponential Moving Averages (EMAs), support and resistance levels, buy/sell signals, and volume percentage labels filtered by buy/sell conditions. It is a comprehensive tool for traders who want to analyze price trends, identify key levels, and make informed decisions based on volume and EMA crossovers.
Key Features of the Indicator
EMA 15 (Purple Dashed Line):
A 15-period Exponential Moving Average (EMA) is plotted on the chart as a dashed purple line.
This EMA helps traders identify short-term trends and potential entry/exit points.
Hidden EMA 21 and EMA 34:
The 21-period and 34-period EMAs are calculated but not displayed on the chart.
These EMAs are used to generate buy and sell signals based on crossovers.
Buy/Sell Signals:
Buy Signal: Occurs when the EMA 21 crosses above the EMA 34. A green "BUY" label is displayed below the candle.
Sell Signal: Occurs when the EMA 21 crosses below the EMA 34. A red "SELL" label is displayed above the candle.
These signals help traders identify potential trend reversals or continuations.
Support and Resistance Levels:
Support: The lowest price level over the last lookback_period candles, plotted as a green dashed horizontal line.
Resistance: The highest price level over the last lookback_period candles, plotted as a red dashed horizontal line.
These levels help traders identify key price zones for potential breakouts or reversals.
Volume Percentage Labels (Filtered by Buy/Sell Signals):
The volume percentage is calculated relative to the average volume over the last volume_lookback candles.
Buy Volume Label: When a buy signal occurs, a green label is displayed above the candle with the text "Buy Vol: X.XX%", where X.XX is the volume percentage.
Sell Volume Label: When a sell signal occurs, a red label is displayed below the candle with the text "Sell Vol: X.XX%", where X.XX is the volume percentage.
These labels help traders assess the strength of the buy/sell signals based on volume.
Alerts:
Alerts are triggered when buy or sell signals occur, notifying traders of potential trading opportunities.
RELATIVE VOLThis script, titled "Relative Vol," is designed to visualize and analyze volume data on TradingView. It calculates and displays the relative volume based on the average volume over a set lookback period, with volume expressed as a percentage of the average. Key features include:
Volume Percentage Calculation: The script calculates the volume percentage relative to the average volume over a specified lookback period (default of 20). It compares the current volume to the historical average and plots it as a percentage on the chart.
Volume Color Coding: The bars are color-coded based on the relationship between price action and volume:
Bullish volume above average: Green
Bearish volume above average: Red
Bullish volume below average: Light gray
Bearish volume below average: Dark gray
Daily Data Integration: It pulls in daily average volume and daily Average True Range (ATR) data:
Displays the daily average volume and ATR values in a table on the top-right of the chart.
Colors in the table reflect whether the daily average volume is high (greater than 1,000,000) and if the daily ATR is above 2.
Custom Timeframe Calculation: The script adjusts the lookback period and volume calculation based on the timeframe of the chart (1-minute, 5-minute, 15-minute, 30-minute, 60-minute, or daily).
This script provides traders with a visual representation of relative volume, helping them identify whether current trading activity is above or below average and how it correlates with price movement. Additionally, the integration of daily volume and ATR data helps assess overall market volatility and liquidity trends.

Volume Delta with PVSRAVolume Delta with PVSRA
Volume Delta with PVSRA is an advanced volume indicator that dissects each bar’s volume into its directional components using higher resolution data. It visually distinguishes between buying and selling volume, so that for a bullish candle the bottom portion represents buying volume and for a bearish candle it represents selling volume. A dot is plotted at the 50% mark of the candle’s total volume, serving as a clear reference point.
Key Features:
Directional Volume Breakdown:
The indicator calculates the delta volume by analyzing lower timeframe data. The bottom portion of a bullish candle (displayed in green) represents buying volume, while that of a bearish candle (displayed in red) represents selling volume.
PVSRA Analysis:
Using Price-Volume Spread Range Analysis, the indicator compares the current volume to the 10-bar average. When volume is significantly higher (using thresholds of 150% and 200%), the candle borders are highlighted in custom colors, indicating medium or strong volume conditions.
Volume Moving Averages:
Three moving averages are plotted:
Total Volume MA (yellow): Tracks overall volume.
Buying Volume MA (green) and Selling Volume MA (red): These are re-centered around the total volume MA. A crossover of the green over the red typically signals rising buying pressure, while the opposite indicates increasing selling pressure.
Scalable Volume Bars:
The indicator scales the volume bars to provide optimal visualization on your chart.
Setup Instructions:
For best results, open your chart settings, navigate to the Canvas tab, and set the bottom margin to 0%. This ensures the indicator displays like a standard volume indicator without any unwanted gaps at the bottom.
Customize the various settings—including colors, border opacity, and moving average parameters—to suit your trading style.

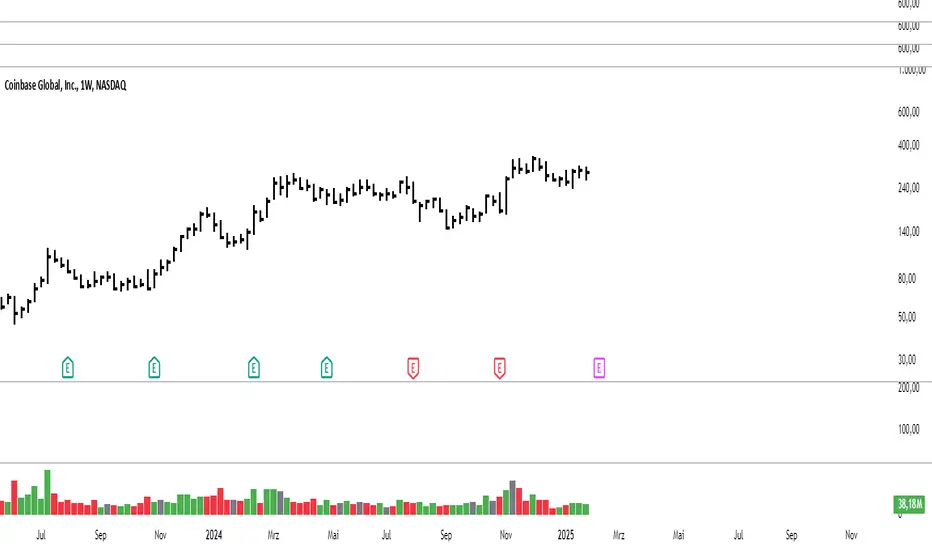
Valorous VolumesIndicator to mark the significant Volumes:
HVE: Checks if the current volume sets a new overall record.
HVY: Checks if the current volume equals the highest volume over the past one year.
HVQ: Checks if the current volume equals the highest volume over the past three months.

Zanger Volume Ratio (ZVR)Zanger Volume Ratio (ZVR)
Credits:
Most of the underlying code and logic in this script have been adapted from the work originally published by The_Peaceful_Lizard
Overview
The Zanger Volume Ratio (ZVR) is a powerful indicator designed to reveal market dynamics by comparing current cumulative volume to an average determined over a historical look-back period. It uses the concept of relative volume to not only highlight unusual volume spikes, but also uses color to illustrate how today's trading compares to typical levels. This unique method of volume analysis was popularized by Dan Zanger - a trader known for turning $10,775 into $18,000,000 in less than two years - by identifying key shifts in market interest and volume behavior.
Key Features
Volume Pacing Analysis:
The script calculates a volume delta by comparing the cumulative volume at any given moment to an average derived over a user-defined lookback period (Default 20-day). The resulting percentage difference offers a clear visualization and insight into unusual volume activity.
Dynamic Visual Representation:
Choose between either “Columns” or “Area” plot styles to display the percent difference. Additionally, you have the option to switch between a standard plot or a background color display, with customizable transparency, ensuring the indicator fits seamlessly with your chart’s aesthetics.
Dashboard Integration:
A simple dashboard table is displayed on the chart, showcasing the current ZVR value in real-time. With user-configurable position, text size, alignment, and color options, this feature ensures that the key metric is always visible and easy to interpret.
Why Use the Zanger Volume Ratio?
The ZVR is more than just a volume indicator. It acts as a window into market sentiment by highlighting days when trading interest intensifies. Many traders believe that an unusually high volume ratio may confirm trend strength or signal a reversal, making the indicator a valuable tool when used in conjunction with other technical analysis methods.
Whether you’re monitoring stocks, commodities, or forex markets, the Zanger Volume Ratio offers an accessible yet sophisticated method to decode volume dynamics. Its practical design and real-time visual feedback provide traders of all experience levels with critical data to spot high-potential setups.
Chart Description
First Pane: normal Volume Indicator on the foreground, ZVR as Background colors
Second Pane: ZVR Indicator with Column Style (default)
First panel: normal volume indicator in foreground, ZVR as background colors
Second panel: ZVR indicator with column style (default)
Note: This indicator is intended for use on intraday charts only!

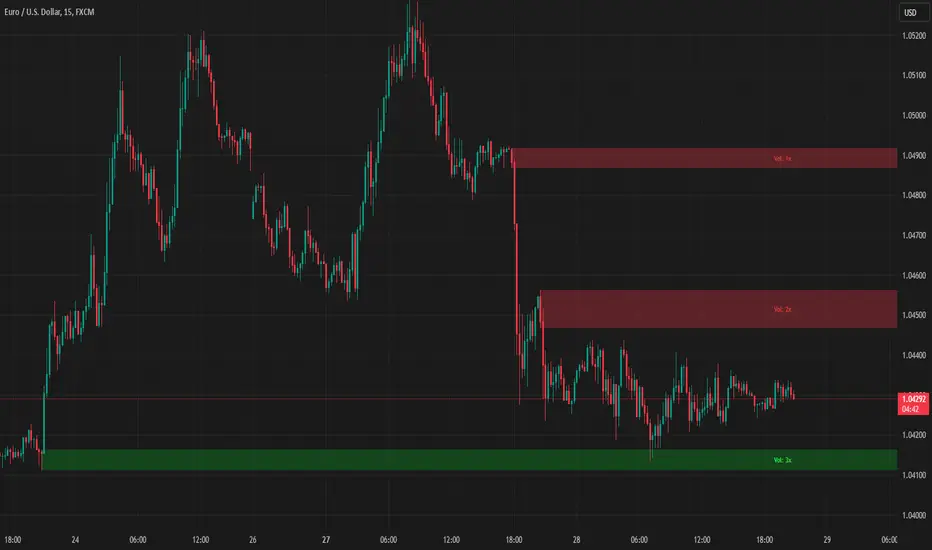
Liquidity ZonesLiquidity Zones Indicator
The Liquidity Zones indicator is a custom Pine Script™ tool designed to identify significant price levels where high trading volume has occurred. These zones often act as support or resistance levels, providing valuable insights for traders.
Key Features:
Window Size: The number of bars to consider for calculating the moving averages and identifying peaks.
Tolerance: The allowable percentage difference to consider peaks as unique.
Number of Peaks: The maximum number of significant peaks to identify.
Minimum Volume: The minimum volume threshold relative to the average volume to consider a peak.
Minimum Range: The minimum price range to consider a peak.
How It Works:
Input Parameters: The user can customize the window size, tolerance, number of peaks, minimum volume, and minimum range.
Moving Averages: The script calculates the simple moving average (SMA) of the volume and closing prices over the specified window.
Peak Identification:
For each bar, the script identifies the bar with the highest volume within the window.
It checks if the volume exceeds the minimum volume threshold.
It determines the peak price based on whether the bar closed higher or lower than it opened.
It ensures the price range of the bar exceeds the minimum range.
It checks if the peak is above the SMA of the closing prices.
It verifies the peak is unique within the specified tolerance.
Plotting Peaks: The identified peaks are plotted on the chart with lines and labels, color-coded based on whether the bar closed higher (green) or lower (red).
This indicator helps traders visualize key liquidity zones, aiding in making informed trading decisions.

Volume Zones Internal Visualizer [LuxAlgo]The Volume Zones Internal Visualizer is an alternate candle type intended to reveal lower timeframe volume activity while on a higher timeframe chart.
It displays the candle's range, the highest and lowest zones of accumulated volume throughout the candle, and the Lower Timeframe (LTF) candle close, which contained the most volume in the session (Candle Session).
🔶 USAGE
The indicator is intended to be used as its own independent candle type. It is not a replacement for traditional candlesticks; however, it is recommended that you hide the chart's display when using this indicator. Another option is to display this indicator in an additional pane alongside the normal chart, as displayed above.
The display consists of candle ranges represented by outlined boxes, within the ranges you will notice a transparent-colored zone, a solid-colored zone, and a line.
Each of these displays different points of volume-related information from an analysis of LTF data.
In addition to this analysis, the indicator also locates the LTF candle with the highest volume, and displays its close represented by the line. This line is considered as the "Peak Activity Level" (PAL), since throughout the (HTF) candle session, this candle's close is the outcome of the most volume transacted at the time.
We are further tracking these PALs by continuing to extend them into the future, looking towards them for potential further interaction. Once a PAL is crossed, we are removing it from display as it has been mitigated.
🔶 DETAILS
The indicator aggregates the volume data from each LTF candle and creates a volume profile from it; the number of rows in the profile is determined by the "Row Size" setting.
With this profile, it locates and displays the highest (solid area) and lowest (transparent area) volume zones from the profile created.
🔶 SETTINGS
Row Size: Sets the number of rows used for the calculation of the volume profile based on LTF data.
Intrabar Timeframe: Sets the Lower Timeframe to use for calculations.
Show Last Unmitigated PALs: Choose how many Unmitigated PALs to extend.
Style: Toggle on and off features, as well as adjust colors for each.

Modified Volume IndicatorThis indicator colors volume bars based on price and range conditions for a given period:
Green Bars:
The close is at least 70% of the way up the daily range (from the low).
The close is also 1% or more above the low.
Red Bars:
The close is at least 70% of the way down the daily range (from the high).
The close is also 1% or more below the high.
Gray Bars:
Volume bars that don’t meet the above conditions are neutral.
Purpose
Green Bars highlight strong upward closes.
Red Bars indicate weak downward closes.
Gray Bars show neutral or inconclusive price movement.
This indicator helps traders identify momentum shifts and trend strength in real-time.
Advanced Order Blocks with VolumeAdvanced Order Blocks with Volume Indicator
This professional-grade indicator combines order block detection with sophisticated volume analysis to identify high-probability trading opportunities. It automatically detects and displays bullish and bearish order blocks formed during consolidation periods, enhanced by three distinct volume calculation methods (Simple, Relative, and Weighted).
Key Features:
- Smart consolidation detection with customizable thresholds
- Volume-filtered order blocks to avoid false signals
- Automatic order block mitigation tracking
- Clear visual presentation with volume metrics
- Flexible customization options for colors and parameters
Settings:
Core Parameters:
- Consolidation Threshold %: Sets the maximum price range (0.1-1.0%) for detecting consolidation zones
- Lookback Period: Number of bars (2-10) to analyze for consolidation patterns
Volume Analysis:
- Volume Calculation Method: Choose between Simple (basic average), Relative (compared to average), or Weighted (prioritized recent volume)
- Volume Lookback Period: Historical bars (5-100) used for volume analysis
- Volume Threshold Multiplier: Minimum volume requirement (1.0-5.0x) for valid order blocks
Visual Settings:
- Bullish/Bearish OB Color: Background colors for order blocks
- Bullish/Bearish OB Text Color: Colors for volume information display
Perfect for traders focusing on institutional price levels and volume-based trading strategies. The indicator helps identify potential reversal zones with strong institutional interest, validated by significant volume conditions.
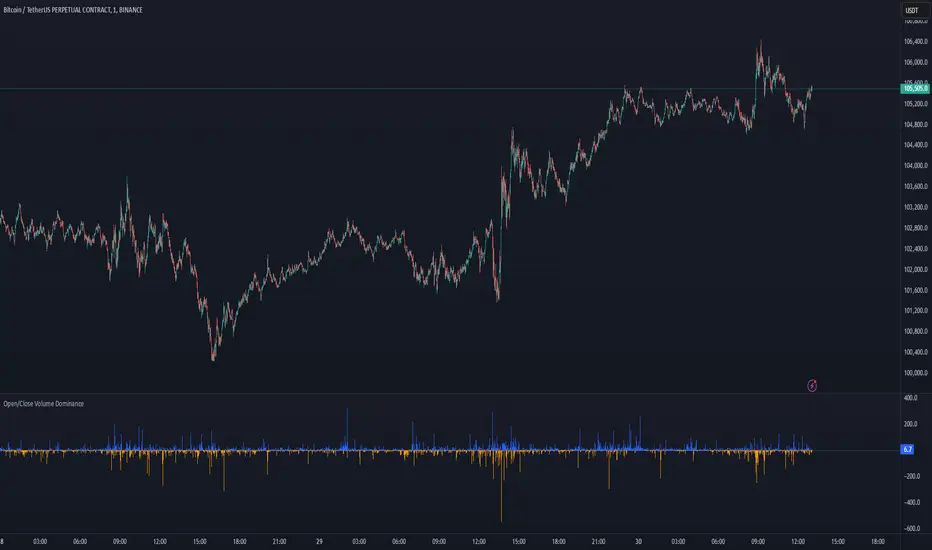
Open/Close VolumeOpen/Close Volume Indicator
The Open/Close Volume Indicator provides a breakdown of trading volume based on Open Interest (OI) changes. It helps identify whether the trading volume is driven by opening new positions (Open Volume) or closing existing positions (Close Volume).
Key Features:
Visual Breakdown of Volume:
Green bars represent Open Volume (new positions being added).
Red bars represent Close Volume (existing positions being closed).
Dynamic Open Interest Data:
Tracks changes in Open Interest to calculate the distribution of Open and Close Volumes.
Adapts automatically to the current chart's symbol or a custom user-specified symbol.
Error Handling:
Displays an alert when Open Interest data is unavailable for the selected symbol.
Zero-Line Reference:
Includes a gray dotted line at 0 for easy reference between Open and Close Volumes.
Use Case:
This indicator is ideal for futures traders who want to analyze market sentiment and understand whether market activity is being driven by the initiation of new trades or the closing of existing ones.
How It Works:
Open Interest Change:
Positive OI change → Open Volume .
Negative OI change → Close Volume .
No OI change → All trading volume is considered Close Volume.
Data Representation:
Open Volume is plotted above the zero line (positive values).
Close Volume is plotted below the zero line (negative values).
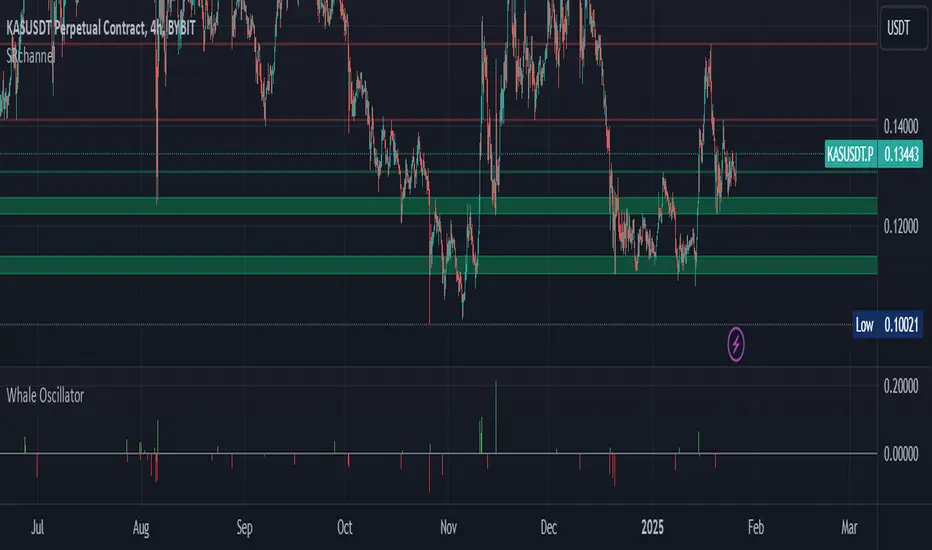
Whale Activity Impact OscillatorThe "Whale Activity Impact Oscillator" is a Pine Script v6 component designed to identify abnormal price movements caused by potential whale activity in the crypto market.
Here's how it works:
Inputs: The script allows users to configure the volume spike multiplier, price spike multiplier, lookback period, minimum volume threshold, and thresholds for strong buy and sell signals.
Data Calculations: It calculates the average volume and average percentage price change over the specified lookback period.
Whale Detection Logic: The script detects a volume spike if the current volume exceeds the average volume by the specified multiplier. It detects a price spike if the percentage price change exceeds the average by the specified multiplier.
Signals: A buy signal is generated when both a volume spike and a price increase are detected. A sell signal is generated when both a volume spike and a price decrease are detected.
Output: The oscillator is displayed as a histogram below the price chart. Green bars indicate buy signals, red bars indicate sell signals, and gray bars indicate normal activity. The height of the bars is proportional to the magnitude of the price change.
Alerts: The script includes alerts for whale buying and selling detected signals.
Edge Cases: The script avoids false signals in low-liquidity environments by setting a minimum volume threshold and filtering out signals during low market activity.
This component can be added to a TradingView chart to help traders identify potential whale activity and make informed trading decisions.
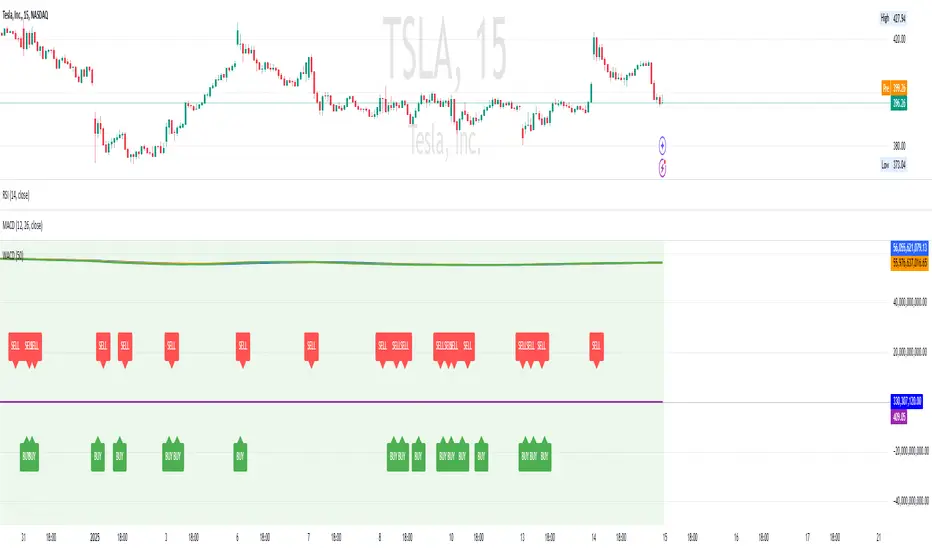
TVMC - Composite Indicator with Technical RatingsDescription:
The TVMC (Trend, Volume, Momentum, Composite) indicator is a powerful multi-component tool designed to provide traders with a comprehensive understanding of market conditions. By combining four essential technical analysis components—trend, momentum, volume, and volatility—this indicator offers clear and actionable insights to assist in decision-making.
Key Features:
1. Trend Component (TC):
* Based on MACD (Moving Average Convergence Divergence), this component analyzes the relationship between two exponential moving averages (fast and slow) to determine the prevailing market trend.
* The MACD signal is normalized to a range of -1 to +1 for consistency and clarity.
2. Momentum Component (MC):
* Utilizes RSI (Relative Strength Index) to measure the strength and speed of price movements.
* This component highlights overbought or oversold conditions, which may indicate potential market reversals.
3. Volume Confirmation (VC):
* Compares the current trading volume to its moving average over a specified period.
* High volume relative to the average confirms the validity of the current trend.
4. Volatility Filter (VF):
* Uses ATR (Average True Range) to gauge market volatility.
* Adjusts and smooths signals to reduce noise during periods of high volatility.
5. Technical Ratings Integration:
* Incorporates TradingView’s Technical Ratings, allowing users to validate signals using moving averages, oscillators, or a combination of both.
* Users can choose their preferred source of ratings for enhanced signal confirmation.
How It Works:
The TVMC indicator combines the weighted contributions of the Trend, Momentum, and Volume components, further refined by the Volatility Filter. Each component plays a specific role:
* Trend: Identifies whether the market is bullish, bearish, or neutral.
* Momentum: Highlights the strength of price action.
* Volume: Confirms whether the current price action is supported by sufficient trading activity.
* Volatility: Filters out excessive noise in volatile market conditions, providing a smoother and more reliable output.
Visualization:
1. Bullish Signals:
* The indicator line turns green and remains above the zero line, indicating upward momentum.
2. Bearish Signals:
* The indicator line turns red and falls below the zero line, signaling downward momentum.
3. Neutral Signals:
* The line is orange and stays near zero, indicating a lack of strong trend or momentum.
4. Zones:
* Horizontal lines at +30 and -30 mark strong bullish and bearish zones, respectively.
* A zero line is included for clear separation between bullish and bearish signals.
Recommended Usage:
* Best Timeframes: The indicator is optimized for higher timeframes such as 4-hour (H4) and daily (D1) charts.
* Trading Style: Suitable for swing and positional trading.
* Customization: The indicator allows users to adjust all major parameters (e.g., MACD, RSI, volume, and ATR settings) to fit their trading preferences.
Customization Options:
* Adjustable weights for Trend, Momentum, and Volume components.
* Fully configurable settings for MACD, RSI, Volume SMA, and ATR periods.
* Timeframe selection for multi-timeframe analysis.
Important Notes:
1. Originality: The TVMC indicator combines multiple analysis methods into a unique framework. It does not replicate or minimally modify existing indicators.
2. Transparency: The description is detailed enough for users to understand the methodology without requiring access to the code.
3. Clarity: The indicator is explained in a way that is accessible even to users unfamiliar with complex technical analysis tools.
Compliance with TradingView Rules:
* The indicator is written in Pine Script version 5, adhering to TradingView’s language standards.
* The description is written in English to ensure accessibility to the global community, with a clear explanation of all components and functionality.
* No promotional content, links, or unrelated references are included.
* The chart accompanying the indicator is clean and demonstrates its intended use clearly, with no additional indicators unless explicitly explained.

Enhanced Cumulative Volume Delta + MAThe Enhanced Cumulative Volume Delta (CVD) indicator is designed to help traders analyze the cumulative buying and selling pressure in the market by examining the delta between the up and down volume. By tracking this metric, traders can gain insights into the strength of a trend and potential reversals. This indicator uses advanced volume analysis combined with customizable moving averages to provide a more detailed view of market dynamics.
How to Use This Indicator:
Volume Delta Visualization:
The indicator plots the cumulative volume delta (CVD) using color-coded candles, where teal represents positive delta (buying pressure) and soft red represents negative delta (selling pressure).
Moving Averages:
Use the moving averages to smooth the CVD data and identify long-term trends. You can choose between SMA and EMA for each of the three available moving averages. The first and third moving averages are typically used for short-term and long-term trend analysis, respectively, while the second moving average can serve as a medium-term filter.
Arrow Markers:
The indicator will display arrows (green triangle up for crossing above, red triangle down for crossing below) when the CVD volume crosses the 3rd moving average. You can control the visibility of these arrows through the input parameters.
Volume Data:
The indicator provides error handling in case no volume data is available for the selected symbol, ensuring that you're not misled by incomplete data.
Practical Applications:
Trend Confirmation: Use the CVD and moving averages to confirm the overall trend direction and strength. Positive delta and a rising CVD can confirm an uptrend, while negative delta and a falling CVD indicate a downtrend.
Volume Breakouts: The arrows marking when the CVD crosses the 3rd moving average can help you spot potential volume breakouts or reversals, making them useful for entry or exit signals.
Volume Divergence: Pay attention to divergences between price and CVD, as these can often signal potential trend reversals or weakening momentum.

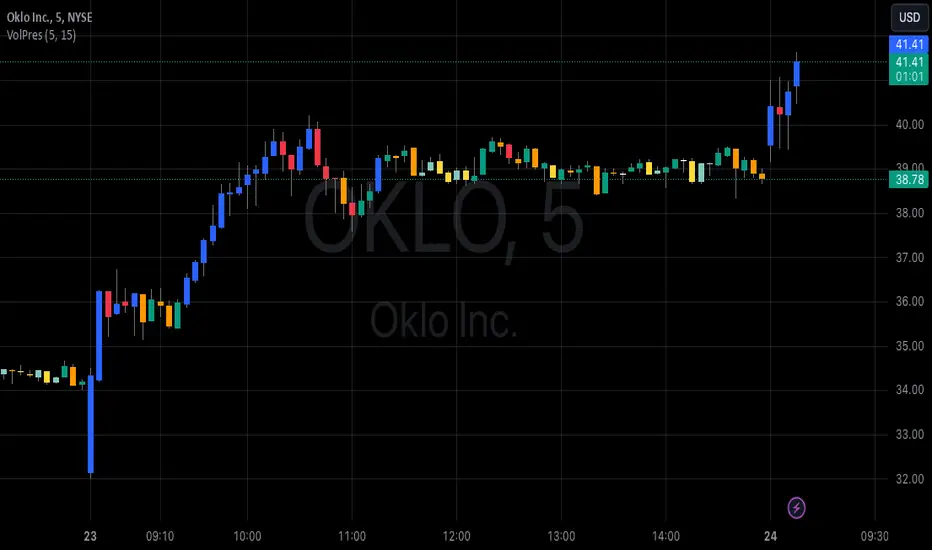
Volume PressureDraws the candle chart with colors to represent low, medium and high volumes. You get 3 colors for downward and 3 colors for upward movement. This will aid with immediately seeing the relative volume pushing the stock candle in the direction of movement.
You can control the percentage threshold for low and high volume. You also can change the colors to represent each volume level for upward and downward movement.
Dominance: USDT + USDCThis script combines the dominance of USDT and USDC, the two largest stablecoins in the market, to provide a clear and accurate view of their impact on the total cryptocurrency market cap.
Key Features:
- Individual Dominance: Displays the percentage dominance of USDT and USDC separately.
- Combined Dominance: Shows a line combining the dominance of both stablecoins to understand their total market influence.
- Real-Time Accuracy: Updates values based on the latest TradingView data.
- Visual Clarity: Unique colors for each line for easy interpretation:
- Blue: USDT Dominance.
- Green: USDC Dominance.
- Red: Total Combined Dominance.
Benefits:
- Strategic Analysis: Evaluate how stablecoins influence capital flow in the crypto market.
- Identify Trends: Understand growth or decline in dominance to detect market direction changes.
- Informed Decisions: Ideal for traders analyzing the relationship between stablecoins and overall market movements.
How to Use:
- Add the script to your chart and monitor the dominance lines.
- Use the insights to support your trading strategy.
Note: This script does not provide buy or sell signals. It is intended for informational and analytical purposes.

Smashing Pump Delta [by Oberlunar]Smashing Pump Δ by Oberlunar
This is a Crypto Δ Volumetric Pump indicator specifically designed to detect crypto pumps. Its primary goal is to highlight moments when buying volume significantly outweighs selling volume on a lower timeframe, suggesting strong upward momentum in the market.
I can't access to the data feed thus the core of its functionality lies in calculating the volume delta Δ in a simpler way... by measuring the difference between aggregated buy and sell volumes. Buy volume is recorded when a lower timeframe candle closes higher than it opened (green candles), while sell volume is recorded when a candle closes lower than it opened (red candles). By focusing exclusively on these buy and sell imbalances, the indicator naturally leans toward identifying positive surges in activity—the hallmark of a pump.
Unlike dumps, which are often accompanied by panic selling and rapid downward movement, pumps are driven by aggressive buying pressure which in crypto assets is very interesting. This indicator is designed to highlight those spikes in buying volume, helping traders pinpoint moments when a significant upward move might be unfolding. It achieves this by tracking the largest volume delta over recent candles and marking it clearly on the chart.
So, if you’re looking for a tool to spot when the bulls are charging, this indicator is your ally.
- Please as in the figure consider the progression of the local maxima before... -

Relative Volume Index [PhenLabs]Relative Volume Index (RVI)
Version: PineScript™ v6
Description
The Relative Volume Index (RVI) is a sophisticated volume analysis indicator that compares real-time trading volume against historical averages for specific time periods. By analyzing volume patterns and statistical deviations, it helps traders identify unusual market activity and potential trading opportunities. The indicator uses dynamic color visualization and statistical overlays to provide clear, actionable volume analysis.
Components
• Volume Comparison: Real-time volume relative to historical averages
• Statistical Bands: Upper and lower deviation bands showing volume volatility
• Moving Average Line: Smoothed trend of relative volume
• Color Gradient Display: Visual representation of volume strength
• Statistics Dashboard: Real-time metrics and calculations
Usage Guidelines
Volume Strength Analysis:
• Values > 1.0 indicate above-average volume
• Values < 1.0 indicate below-average volume
• Watch for readings above the threshold (default 6.5x) for exceptional volume
Trading Signals:
• Strong volume confirms price moves
• Divergences between price and volume suggest potential reversals
• Use extreme readings as potential reversal signals
Optimal Settings:
• Start with default 15-bar lookback for general analysis
• Adjust threshold (6.5x) based on market volatility
• Use with multiple timeframes for confirmation
Best Practices:
• Combine with price action and other indicators
• Monitor deviation bands for volatility expansion
• Use the statistics panel for precise readings
• Pay attention to color gradients for quick assessment
Limitations
• Requires quality volume data for accurate calculations
• May produce false signals during pre/post market hours
• Historical comparisons may be skewed during unusual market conditions
• Best suited for liquid markets with consistent volume patterns
Note: For optimal results, use in conjunction with price action analysis and other technical indicators. The indicator performs best during regular market hours on liquid instruments.

VWAP Divergence | dobofulopOverview :
This script identifies potential bullish and bearish divergence signals using the Volume Weighted Average Price (VWAP). It calculates VWAP resets based on a selected “Anchor Period” (Session, Week, Month, Quarter, Year, Decade, Century, or corporate events like Earnings, Dividends, Splits). When price action and VWAP move in opposite directions with a sufficiently large ATR-based move over a chosen lookback period, the script plots divergence dots on the chart.
Key Features:
VWAP Anchoring : Choose an anchor period for resetting VWAP. This could be daily, weekly, monthly, or based on specific corporate events (Earnings, Dividends, Splits).
Divergence Detection : Looks for instances where the price is moving up while VWAP moves down (potential bullish divergence), and vice versa for bearish divergence.
ATR Filter : Uses the ATR (Average True Range) to filter out minor or insignificant price moves, helping to reduce noise.
Gap Check : Automatically invalidates signals if large price gaps occur within the lookback range.
Visual Signals : Bullish divergences are plotted below the bar, while bearish divergences are plotted above, making it easy to spot potential reversal zones.
How to Us
Inputs:
- Anchor Period (Session, Week, Month, etc.) – determines when the VWAP calculation restarts.
- Source (Default: HLC3) – Price source for the VWAP.
- ATR Multiplier and Lookback Period – Fine-tune the threshold for detecting significant moves vs. VWAP.
Interpretation:
- Bullish Divergence Dot: Suggests potential price strength when price moves higher but VWAP moves lower.
- Bearish Divergence Dot: Suggests potential price weakness when price moves lower but VWAP moves higher.
Disclaimer:
This script is provided for educational purposes only and should not be interpreted as financial advice. Past performance does not guarantee future results. Always conduct your own analysis and consider consulting a financial professional before making trading decisions.

Order Blocks with Volume Heatmap & Clusters - VK TradingOrder Blocks with Volume Heatmap & Clusters - VK Trading
This script is designed to identify and highlight Order Blocks, a key concept in institutional trading, and combines it with powerful tools like volume heatmaps and accumulation clusters for enhanced market analysis. Suitable for traders of all experience levels, this script provides a clear and customizable visualization to help identify significant market zones effectively.
What Does This Script Do?
Order Block Identification: Highlights bullish and bearish order blocks directly on the chart, making it easier to spot key supply and demand zones.
Volume Heatmap: A dynamic heatmap adjusts colors based on relative volume, allowing you to quickly identify areas of heightened activity.
Institutional Accumulation Clusters: Zones of potential institutional accumulation are calculated using a combination of ATR (Average True Range), standardized volume, and RSI (Relative Strength Index).
Automatic Clearing: Invalidated order blocks are automatically removed, ensuring your charts remain clean and focused.
Key Features
Customizable Sensitivity: Adjust the script’s sensitivity to tailor order block detection to different market conditions and strategies.
Advanced Volume Display Options: Toggle volume visibility on or off. Customize the position, size, and color of volume labels for better integration with your chart's design.
Dynamic Heatmap Intensity: Fine-tune the heatmap’s intensity and color to highlight areas of interest based on trading volume.
Dual Order Block Detection: Uses two independent detection settings to analyze the market from multiple perspectives.
Visual Alerts: Automatically draws key level lines based on detected order blocks for better clarity.
User Benefits:
Clear Market Analysis: Helps pinpoint institutional activity and key levels with minimal effort.
Increased Efficiency: Automates plotting and analysis, allowing you to focus on decision-making.
Versatile Compatibility: Complements strategies like Smart Money Concepts, Wyckoff, and Price Action approaches.
Disclaimer
This script is intended as an analytical and educational tool. It does not guarantee specific outcomes or eliminate trading risks. Use this tool at your own discretion and always practice proper risk management.

WACD -ActivTrades-IonJauregui-Weighted Average Cumulative Delta******************ENGLISH***************
The WACD -ActivTrades- IonJauregui - Weighted Average Cumulative Delta indicator shows market sentiment by tracking the difference between buying and selling volumes, weighted by the closing price. It calculates the cumulative delta (net buy vs. sell volume) and applies a moving average to smooth the results.
Cumulative Delta shows overall buying or selling pressure.
WACD smooths the weighted cumulative delta to identify trends and reversals.
Positive values indicate buying pressure, while negative values suggest selling pressure.
It’s useful for detecting trend strength, reversals, and confirming other indicators.
******************SPANISH***************
El indicador WACD -ActivTrades- IonJauregui - Weighted Average Cumulative Delta muestra el sentimiento del mercado mediante el seguimiento de la diferencia entre los volúmenes de compra y venta, ponderados por el precio de cierre. Calcula el delta acumulativo (volumen neto de compra frente al de venta) y aplica una media móvil para suavizar los resultados.
La delta acumulada muestra la presión global de compra o venta.
El WACD suaviza la delta acumulada ponderada para identificar tendencias y retrocesos.
Los valores positivos indican presión compradora, mientras que los negativos sugieren presión vendedora.
Es útil para detectar la fuerza de la tendencia, los retrocesos y confirmar otros indicadores.
Volume Equilibrium Overlay(2 of 2)This is an overlay for a prior script I've created: Volume Equilibrium.
To sum it up in a brief manner, this script plots when there is "volume-equilibrium" aka prices that the market may see as "fair-value" relative to the specified timeframe. This script provides what my last code lacked and that is a visual representation of critical prices.
The arrows beside the indications indicate the direction that the buying/selling volume was heading towards.
UP ARROW - indicates that equilibrium was had via increasing buy volume
DOWN ARROW - indicates that equilibrium was had via decreasing buy volume
Remember, this doesn't inherently mean that a stock is supposed to go up or down. Its just a representation of 'fair-value' points using volume. Also remember... both indicators provide what the other lacks. It isn't necessary to use both but for a broad overview of volume it definitely helps to at least be aware of how this information can be represented. Perhaps... consider switching between the two to see what you may be missing.
I believe finding 'fair-value' points via volume and price action provides a more objective way to measure what prices one should look at rather then arbitrary lines plotted on a chart. For more information feel welcome to look at the script that this code is based off of.

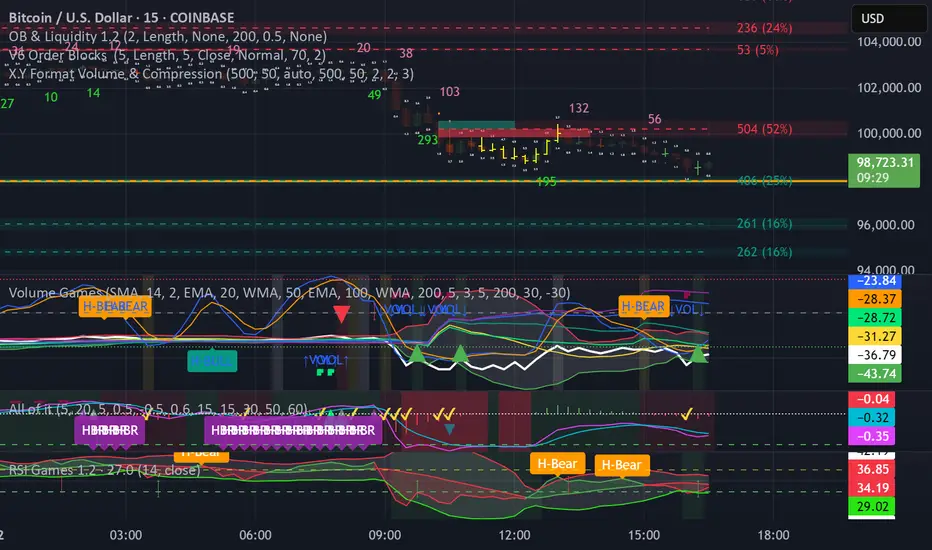
X.Y Format Candle Volume & CompressionThe Volume & Compression Indicator is designed to help traders identify significant market moves by displaying two key metrics above each candle. The top number represents the Volume Ratio, which compares the current candle's volume to the average volume of recent candles. For example, a reading of 2.5 means the current volume is 2.5 times higher than average. When volume exceeds 9.9 times the average, the indicator displays an up or down arrow instead of a number, indicating extremely high volume in that direction.
The bottom number shows the Compression Ratio, which measures the relationship between volume and price movement. This helps identify when large amounts of volume are moving price significantly (low compression) versus when high volume isn't resulting in much price movement (high compression). High compression often indicates accumulation or distribution phases, while low compression with high volume typically suggests strong directional moves.
The indicator includes visual cues to help spot patterns. Dots appear above candles when both high volume and high compression persist over several candles, potentially indicating accumulation phases. Arrows mark possible pivot points after these accumulation periods. Additionally, the candles themselves can display a gradient color that intensifies with increased compression, making it easier to spot areas of interest.
For trading purposes, watch for volume spikes (top number above 2.0) as they can signal potential reversal points or confirm breakouts. High compression readings might precede breakouts, while low compression with high volume often confirms strong trend moves. The most significant signals often come when both metrics show high readings over multiple candles, suggesting sustained institutional interest.