Swing VWAP Weekly Stock and Crypto StrategyThis is a simple yet very efficient swing strategy designed for crypto and stock market, using big timeframes.
Its main component is VWAP weekly, so for best scenarios its better to use big timeframes such as 8h+.
The rules for entry are simple:
If our close if above vwap weekly we enter long .
If our close is below vwap weekly we enter short.
We exit from the trade, when a reverse condition than the entry one is triggered.
Because this strategy has no risk management inside, I recommend to be careful with it.
If you have any questions, let me know
Volume

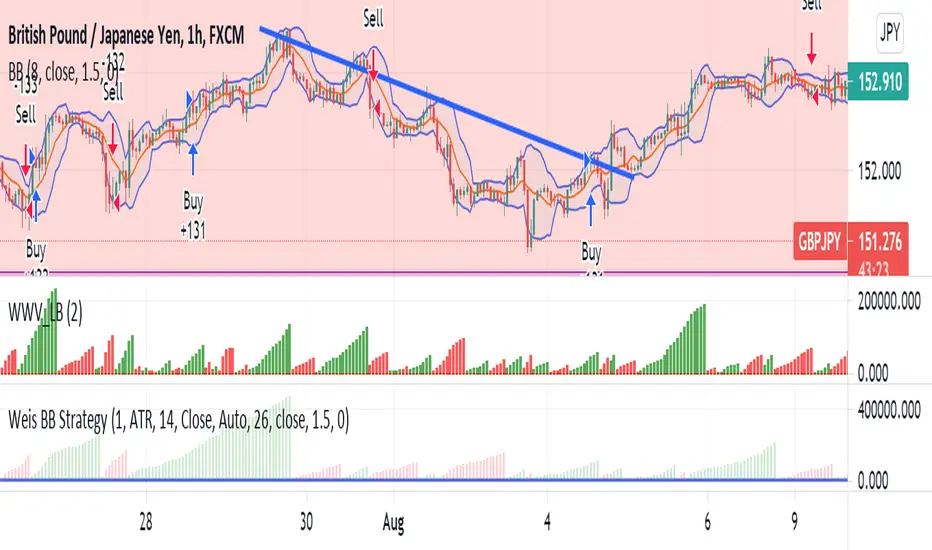
Weis BB StrategyThis is a strategy based on Weis Wave & EMA. Weis Wave Volume is used to determine the overall trend and Bollinger Band to determine the Price breaking out from resistance zones.
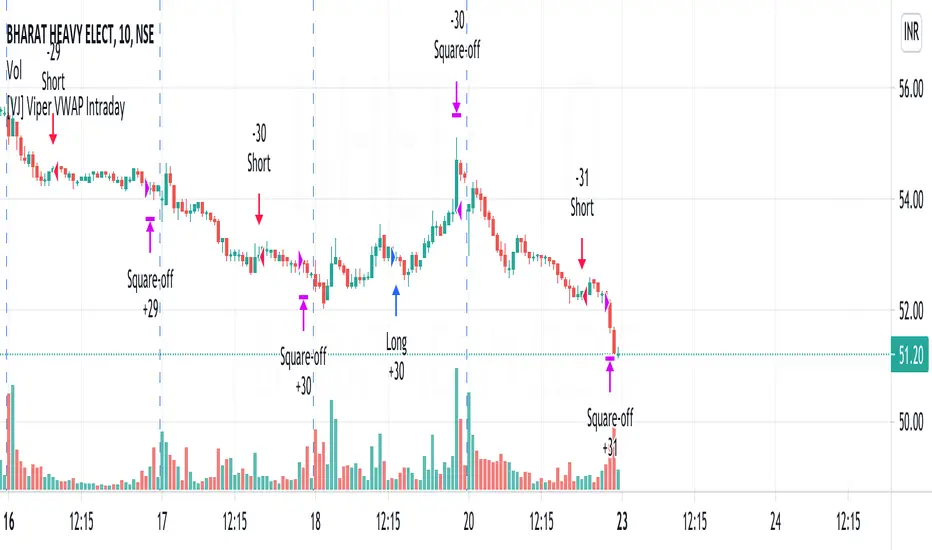
[VJ] Viper VWAP IntradayHello Traders, this is a simple intraday strategy involving the ever reliable VWAP and a chop index to add twist to the traditional style . You can modify the values on the stock and see what are your best picks. Comment below if you found something with good returns
Strategy: VWAP based strategy but uses an additional powerful indicator Chop index to help us stay out of false trades.
Indicators used :
VWAP identifies the true average price of a stock by factoring the volume of transactions at a specific price point and not based on the closing price. VWAP can add more value than your standard 10, 50, or 200 moving average indicators because VWAP reacts to price movements based on the volume during a given period.
The Choppiness Index is designed to determine whether the market is choppy or trading sideways, or not choppy and trading within a trend in either direction. Using a scale from 1 - 100, the market is considered to be choppy as values near 100 (over 61.80) and trending when values are lower than 38.20)
Buying/Selling typically happens at VWAP Breakouts which is then validated with extreme CI to ascertain the entries
Aggressive trade stop can be employed by using the % for long and shorts in the strategy.
Usage & Best setting :
Choose a good volatile stock and a time frame - 10m.
CI Index : 14
Trend Factor - anything below 38.2 is considered in trend, you can experiment from 50
There is stop loss and take profit that can be used to optimise your trade
The template also includes daily square off based on your time.
[VJ] Mega Supertrend for IntradayThis is a simple intraday strategy for working on Stocks or commodities based out on Super Trend and intraday's best friend - VWAP . You can modify the start time and end time based on your timezones. Session value should be from market start to the time you want to square-off
Important: The end time should be at least 2 minutes before the intraday square-off time set by your broker
Comment below if you get good returns
Strategy: Tweaked Super trend with VWAP
Indicators used :
Super trend is simple and easy to use indicator and gives a precise reading about an on going trend.It is built with two parameters, namely period and multiplier.The Buy and Sell signal modifies once the indicator tosses over the closing price. When the Super trend closes above the Price, a Buy signal is generated, and when the Super trend closes below the Price, a Sell signal is generated. In this case we use it only for direction .
Multiplier is a vital input for Super trend. If the multiplier value is too high, then lesser number of signals is made.
Volume is important as we don’t want to get stuck with a stock which has few takers, even if you think it is priced attractively. Thus, the VWAP was created to take into account both volume as well as Price so that the potential trader would make the trading decision or not.
In simple terms, the Volume Weighted Average price is the cumulative average price with respect to the volume
Buying/Selling
when the closing price starts moving up/down and farther from the VWAP, there is pressure among the traders to sell/buy, a general belief kicks in that it might be that the stock is overvalued/undervalued .This is the time when we couple the Super trend to take our entries
Usage & Best setting :
Choose a good volatile stock and a time frame - 5m.
ST multiplier : 3
There is stop loss and take profit that can be used to optimise your trade
The template also includes daily square off based on your time.

QuickSilver Intraday using RSIThis is a simple intraday strategy using very basic intraday super indicators - RSI & VWAP for working on Stocks . You can modify the values on the stock and see what are your best picks. Comment below if you found something with good returns
Strategy:
Indicators used :
The Relative Strength Index (RSI) is one of the most popular and widely used momentum oscillators.The values of the RSI oscillator, typically measured over a 14-day period, fluctuate between zero and 100. The Relative Strength Index indicates oversold market conditions when below 30 and overbought market conditions when above 70
VWAP identifies the true average price of a stock by factoring the volume of transactions at a specific price point and not based on the closing price. VWAP can add more value than your standard 10, 50, or 200 moving average indicators because VWAP reacts to price movements based on the volume during a given period.
Buying happens at VWAP Breakouts which is then validated with RSI to check for overbought & oversold conditions.
Aggressive trade stop can be employed by using the % for long and shorts in the strategy.
Usage & Best setting :
Choose a good volatile stock and a time frame - 10m.
RSI : 9
Overbought & Oversold - can be varied as per user
There is stop loss and take profit that can be used to optimise your trade
Extending this to,
In general guidelines for RSI :
Short-term intraday traders (day trading) often use lower settings with periods in the range of 9-11.
Medium-term swing traders frequently use the default period setting of 14.
Longer-term position traders often set it at a higher period, in the range of 20-30.
The template also includes daily square off based on your time.

[VJ]Thor for MFIThis is a simple intraday strategy for working on Stocks or commodities . You can modify the start time and end time based on your timezones. Session value should be from market start to the time you want to square-off
Important: The end time should be at least 2 minutes before the intraday square-off time set by your broker
Comment below if you get good returns
Strategy:
Indicators used :
Moving average (MA) is a widely used technical indicator that smooths out price trends by filtering out the “noise” from random short-term price fluctuations. Here moving averages are used to identify trend direction and to determine support and resistance levels. Overbought and oversold regions are also taken into consideration
The Money Flow Index ( MFI ) is a momentum indicator that measures the flow of money into and out of a security over a specified period of time. It is related to the Relative Strength Index ( RSI ) but incorporates volume , whereas the RSI only considers price. The MFI is calculated by accumulating positive and negative Money Flow values (see Money Flow ), then creating a Money Ratio. The Money Ratio is then normalized into the MFI oscillator form.
Using the combination of Overbought and Oversold values and varying MFI and using the MA filter to ensure the direction , we can buy/sell when conditions are met
Buying with MFI
1. MFI drops below 20 and enters inside oversold zone.
2. MFI bounces back above 20.
3. MFI pulls back but remains above 20.
4. A MFI break out above its previous high is a good buy signal.
Selling with MFI
1. MFI rises above 80 and enters inside overbought zone.
2. MFI drops back below 80.
3. MFI rises slightly but remains below 80.
4. MFI drops lower than its previous low is a signal to short sell or profit booking
Usage & Best setting :
Choose a good volatile stock and a time frame - 5m.
MFI factor : 3
Moving Average : 80
Overbought & Oversold - can be varied as per user
There is stop loss and take profit that can be used to optimise your trade
The template also includes daily square off based on your time.

Stock trending strategy This is a long only strategy designed maily for stock markets and futures. In general it works best with 1h, however it can be optimized with other timeframes as well.
Components:
VWAP
MACD histogram
EMA 9
Rules for entry
Long :
For VWAP: close is above the vwap daily
EMA: close is above the moving average
MACD histogram is above 0
Short:
For VWAP: close is belowthe vwap daily
EMA: close is below the moving average
MACD histogram is below 0
Rules for exit
This strategy does not have any risk management inside. Instead it exits whenver it receives an opposite signal form the original one used for entry.
If you have any questions let me know !

Crypto RSI with RVI StrategyThis is a long only strategy adapted for crypto market.
Its idea is to take the most juice out of a long trend and cut the losses as soon as possible.
For this , its components are RSI with a very big length - 100 or 200 preferably and RVI.
Rules for entry
If RVI is in the buy zone and we have a crossover from RSI with the overbought level.
Rules for exit
With change condition : If RVI is in the sell zone and we have a cross under from RSI with the oversold level.
With stop loss : we have a SL based on movement in % of the price, recommendable between 5-10%.
If you have any questions let me know !

Vwap mtf Swing Stock StrategyThis is a trending strategy designed for stock market, especially long trending assets such as TSLA, NIO, AMAZON and so on.
Its made of volatility bands and weekly VWAP, in this case daily and weekly.
This strategy has been adapted to go long only.
Rules for entry
For long , we want to enter close of a candle is above vwap weekly, and at the same time the close of a candle cross-under the lower volatility band.
For exit , we want to enter close of a candle is below vwap weekly, and at the same time the close of a candle cross-over the upper volatility band.
This strategy does not have a risk management inside, so use it with caution.
If you have any questions, let me know !

HYE Trend Hunter [Strategy]*** Stratejinin Türkçe ve İngilizce açıklaması aşağıya eklenmiştir.
HYE Trend Hunter
In this strategy, two of the most basic data (price and volume) necessary for detecting trends as early as possible and entering the trade on time are used. In this context, the approaches of some classical and new generation indicators using price and volume have been taken into account.
The strategy is prepared to generate buy signals only. The following steps were followed to generate the buy and exit signals.
1-) First of all, the two most basic data of the strategy, “slow leading line” and “fast leading line” need to be calculated. For this, we use the formula of the “senkou span A” line of the indicator known as the Ichimoku Cloud. We also need to calculate lines known as tenkan sen and kijun sen in ichimoku because they are used in the calculation of this formula.
The high and low values of the candles are taken into account when calculating the Tenkansen, Kijunsen and Senkou Span A lines in the Ichimoku cloud. In this strategy, the highest and lowest values of the periodic VWAP are taken into account when calculating the "slow leading line" and "fast leading line". (The periodic vwap formula was coded and made available by @neolao on tradingviev). Also, in the ichimoku cloud, while the Senkou Span A line is plotted 26 periods into the future, we consider the values of the fast and slow leading lines in the last candle in this strategy.
ORIGINAL ICHIMOKU SPAN A FORMULA
Tenkansen = (Highest high of the last 9 candles + Lowest low of the last 9 candles) / 2
Kijunsen = (Highest high of the last 26 candles + Lowest low of the last 26 candles) / 2
Senkou Span A = Tenkansen + Kijunsen / 2
HYE TREND HUNTER SPAN A FORMULA*
Tenkansen = (Highest VWAP of the last 9 candles + Lowest VWAP of the last 9 candles) / 2
Kijunsen = (Highest VWAP of the last 26 candles + Lowest VWAP of the last 26 candles) / 2
Senkou Span A = Tenkansen + Kijunsen / 2
* We use the original ichimoku values 9 and 26 for the slow line, and 5 and 13 for the fast line. These settings can be changed from the strategy settings.
2-) At this stage, we have 2 lines that we obtained by using the formula of the ichimoku cloud, one of the most classical trend indicators, and by including the volume-weighted average price.
a-) Fast Leading Line (5-13)
b-) Slow Leading Line (9-26)
For the calculation we will do soon, we get a new value by taking the average of these two lines. Using this value, which is the average of the fast and slow leading lines, we plot the Bollinger Bands indicator, which is known as one of the most classic volatility indicators of technical analysis. Thus, we are trying to understand whether there is a volatility change in the market, which may mean the presence of a trend start. We will use this data in the calculation of buy-sell signals.
In the classical Bollinger Bands calculation, the standard deviation is calculated by applying a multiplier at the rate determined by the user (2 is used in the original settings) to the moving average calculated with the “closing price”, and this value is added or subtracted from the moving average and upper band and lower band lines are drawn.
In the HYE Trend Hunter Strategy, instead of the moving average calculated with the closing price in the Bollinger Band calculation, we consider the average of the fast and slow leading lines calculated in the 1st step and draw the Bollinger upper and lower bands accordingly. We use the values of 2 and 20 as the standard deviation and period, as in the original settings. These settings can also be changed from the strategy settings.
3-) At this stage, we have fast and slow leading lines trying to understand the trend direction using VWAP, and Bollinger lower and upper bands calculated by the average of these lines.
In this step, we will use another tool that will help us understand whether the invested market (forex, crypto, stocks) is gaining momentum in volume. The Time Segmented Volume indicator was created by the Worden Brothers Inc. and coded by @liw0 and @vitelot on tradingview. The TSV indicator segments the price and volume of an investment instrument according to certain time periods and makes calculations on comparing these price and volume data to reveal the buying and selling periods.
To trade in the buy direction on the HYE Trend Hunter Strategy, we look for the TSV indicator to be above 0 and above its exponential moving average value. TSV period and exponential moving average period settings (13 and 7) can also be changed in the strategy settings.
BUY SIGNAL
1-) Fast Leading Line value should be higher than the Fast Leading Line value in the previous candle.
2-) Slow Leading Line value should be higher than the Slow Leading Line value in the previous candle.
3-) Candle Closing value must be higher than the Upper Bollinger Band.
4-) TSV value must be greater than 0.
5-) TSV value must be greater than TSVEMA value.
EXIT SIGNAL
1-) Fast Leading Line value should be lower than the Fast Leading Line value in the previous candle.
2-) Slow Leading Line value should be lower than the Slow Leading Line value in the previous candle.
TIPS AND WARNINGS
1-) The standard settings of the strategy work better in higher timeframes (4-hour, daily, etc.). For lower timeframes, you should change the strategy settings and find the best value for yourself.
2-) All lines (fast and slow leading lines and Bollinger bands) except TSV are displayed on the strategy. For a simpler view, you can hide these lines in the strategy settings.
3-) You can see the color changes of the fast and slow leading lines as well as you can specify a single color for these lines in the strategy settings.
4-) It is an strategy for educational and experimental purposes. It cannot be considered as investment advice. You should be careful and make your own risk assessment when opening real market trades using this strategy.
_______________________________________________
HYE Trend Avcısı
Bu stratejide, trendlerin olabildiğince erken tespit edilebilmesi ve zamanında işleme girilebilmesi için gerekli olan en temel iki veriden (fiyat ve hacim) yararlanılmaktadır. Bu kapsamda, fiyat ve hacim kullanan bazı klasik ve yeni nesil indikatörlerin yaklaşımları dikkate alınmıştır.
Strateji yalnızca alış yönlü sinyaller üretecek şekilde hazırlanmıştır. Alış ve çıkış sinyallerinin üretilmesi için aşağıdaki adımlar izlenmiştir.
1-) Öncelikle, stratejinin en temel iki verisi olan “yavaş öncü çizgi” ve “hızlı öncü çizgi” hesaplamasının yapılması gerekiyor. Bunun için de Ichimoku Bulutu olarak bilinen indikatörün “senkou span A” çizgisinin formülünü kullanıyoruz. Bu formülün hesaplamasında kullanılmaları nedeniyle ichimoku’da tenkan sen ve kijun sen olarak bilinen çizgileri de hesaplamamız gerekiyor.
Ichimoku bulutunda Tenkansen, Kijunsen ve Senkou Span A çizgileri hesaplanırken mumların yüksek ve düşük değerleri dikkate alınıyor. Bu stratejide ise “yavaş öncü çizgi” ve “hızlı öncü çizgi” hesaplanırken periyodik VWAP’ın en yüksek ve en düşük değerleri dikkate alınıyor. (Periyodik vwap formülü, tradingviev’de @neolao tarafından kodlanmış ve kullanıma açılmış). Ayrıca, ichimoku bulutunda Senkou Span A çizgisi geleceğe yönelik çizilirken (26 mum ileriye dönük) biz bu stratejide öncü çizgilerin son mumdaki değerlerini dikkate alıyoruz.
ORJİNAL ICHIMOKU SPAN A FORMÜLÜ
Tenkansen = (Son 9 mumun en yüksek değeri + Son 9 mumun en düşük değeri) / 2
Kijunsen = (Son 26 mumun en yüksek değeri + Son 26 mumun en düşük değeri) / 2
Senkou Span A = Tenkansen + Kijunsen / 2
HYE TREND HUNTER SPAN A FORMÜLÜ*
Tenkansen = (Son 9 mumun en yüksek VWAP değeri + Son 9 mumun en düşük VWAP değeri) / 2
Kijunsen = (Son 26 mumun en yüksek VWAP değeri + Son 26 mumun en düşük VWAP değeri) / 2
Senkou Span A = Tenkansen + Kijunsen / 2
* Yavaş çizgi için orijinal ichimoku değerleri olan 9 ve 26’yı kullanırken, hızlı çizgi için 5 ve 13’ü kullanıyoruz. Bu ayarlar, strateji ayarlarından değiştirilebiliyor.
2-) Bu aşamada, elimizde en klasik trend indikatörlerinden birisi olan ichimoku bulutunun formülünden faydalanarak, işin içinde hacim ağırlıklı ortalama fiyatı da sokmak suretiyle elde ettiğimiz 2 çizgimiz var.
a-) Hızlı Öncü Çizgi (5-13)
b-) Yavaş Öncü Çizgi (9-26)
Birazdan yapacağımız hesaplama için bu iki çizginin de ortalamasını alarak yeni bir değer elde ediyoruz. Hızlı ve yavaş öncü çizgilerin ortalaması olan bu değeri kullanarak, teknik analizin en klasik volatilite indikatörlerinden birisi olarak bilinen Bollinger Bantları indikatörünü çizdiriyoruz. Böylelikle piyasada bir trend başlangıcının varlığı anlamına gelebilecek volatilite değişikliği var mı yok mu anlamaya çalışıyoruz. Bu veriyi al-sat sinyallerinin hesaplamasında kullanacağız.
Klasik Bollinger Bantları hesaplamasında, “kapanış fiyatıyla” hesaplanan hareketli ortalamaya, kullanıcı olarak belirlenen oranda (orijinal ayarlarında 2 kullanılır) bir çarpan uygulanarak standart sapma hesaplanıyor ve bu değer hareketli ortalamaya eklenip çıkartılarak üst bant ve alt bant çizgileri çiziliyor.
HYE Trend Avcısı stratejisinde, Bollinger Bandı hesaplamasında kapanış fiyatıyla hesaplanan hareketli ortalama yerine, 1. adımda hesapladığımız hızlı ve yavaş öncü çizgilerin ortalamasını dikkate alıyoruz ve buna göre bollinger üst ve alt bantlarını çizdiriyoruz. Standart sapma ve periyot olarak yine orijinal ayarlarında olduğu gibi 2 ve 20 değerlerini kullanıyoruz. Bu ayarlar da strateji ayarlarından değiştirilebiliyor.
3-) Bu aşamada, elimizde VWAP kullanarak trend yönünü anlamaya çalışan hızlı ve yavaş öncü çizgilerimiz ile bu çizgilerin ortalaması ile hesaplanan bollinger alt ve üst bantlarımız var.
Bu adımda, yatırım yapılan piyasanın (forex, kripto, hisse senedi) hacimsel olarak ivme kazanıp kazanmadığını anlamamıza yarayacak bir araç daha kullanacağız. Time Segmented Volume indikatörü, Worden Kardeşler şirketi tarafından oluşturulmuş ve tradingview’de @liw0 ve @vitelot tarafından kodlanarak kullanıma açılmış. TSV indikatörü, bir yatırım aracının fiyatını ve hacmini belirli zaman aralıklarına göre bölümlere ayırarak, bu fiyat ve hacim verilerini, alış ve satış dönemlerini ortaya çıkarmak için karşılaştırmak üzerine hesaplamalar yapar.
HYE Trend Avcısı stratejisinde alış yönünde işlem yapmak için, TSV indikatörünün 0’ın üzerinde olmasını ve kendi üstel hareketli ortalama değerinin üzerinde olmasını arıyoruz. TSV periyodu ve üstel hareketli ortalama periyodu ayarları da (13 ve 7) strateji ayarlarından değiştirilebiliyor.
ALIŞ SİNYALİ
1-) Hızlı Öncü Çizgi değeri bir önceki mumdaki Hızlı Öncü Çizgi değerinden yüksek olmalı.
2-) Yavaş Öncü Çizgi değeri bir önceki mumdaki Yavaş Öncü Çizgi değerinden yüksek olmalı.
3-) Kapanış Değeri, Üst Bollinger Bandı değerinden yüksek olmalı.
4-) TSV değeri 0’dan büyük olmalı.
5-) TSV değeri TSVEMA değerinden büyük olmalı.
ÇIKIŞ SİNYALİ
1-) Hızlı Öncü Çizgi değeri bir önceki mumdaki Hızlı Öncü Çizgi değerinden düşük olmalı.
2-) Yavaş Öncü Çizgi değeri bir önceki mumdaki Yavaş Öncü Çizgi değerinden düşük olmalı.
İPUÇLARI VE UYARILAR
1-) Stratejinin standart ayarları, yüksek zaman dilimlerinde (4 saatlik, günlük vs.) daha iyi çalışıyor. Düşük zaman dilimleri için strateji ayarlarını değiştirmeli ve kendiniz için en iyi değeri bulmalısınız.
2-) Stratejide tüm çizgiler (hızlı ve yavaş öncü çizgiler ile bollinger bantları) -TSV dışında- açık olarak gelmektedir. Daha sade bir görüntü için bu çizgilerin görünürlüğünü strateji ayarlarından gizleyebilirsiniz.
3-) Hızlı ve yavaş öncü çizgilerin renk değişimlerini görebileceğiniz gibi bu çizgiler için tek bir renk olarak da strateji ayarlarında belirleme yapabilirsiniz.
4-) Eğitim ve deneysel amaçlı bir stratejidir. Yatırım tavsiyesi olarak değerlendirilemez. Bu stratejiyi kullanarak gerçek piyasa işlem açarken dikkatli olmalı ve kendi risk değerlendirmenizi yapmalısınız.

Money Flow Index 5 min Strategy1 - Apply the 3 period Money Flow Index indicator to the 5 minute chart, using 0 and 100 as our oversold and overbought boundaries
2 - Wait for the MFI to reach overbought levels, that indicates the presence of "big sharks" in the market. Price needs to hold up
the first two MFI overbought occurrences of the day to be considered as a bullish entry signal.*
3 - We buy when the MFI = 100 and the next candle is a bullish candle with short wicks.
4 - We place our Stop Loss below the low of the trading day and we Take Profit during the first 60 minutes after taking the trade.
The logic above can be used in a mirrored fashion to take short entries, this is a custom parameter that can be modified from
the strategy Inputs panel.
* I'm using a SMA filter to avoid buying when the price is declining. Time frame was better at 15 min according to my test.

EMA crossover (daily TF)This strategy is only applicable for daily timeframe only. EMAs have been smoothened out to make sure to include volatility glitches that may occur. I have used following conditions:
>EMA crossover of two frames already occurred
> Significant volume in the candle
> Candles are properly bullish or bearish not doji
> price is near EMA crossover
> trading stoploss to reduce risk as price follows the trend
Positive feedbacks are welcome for incorporation.
NSE:SRF

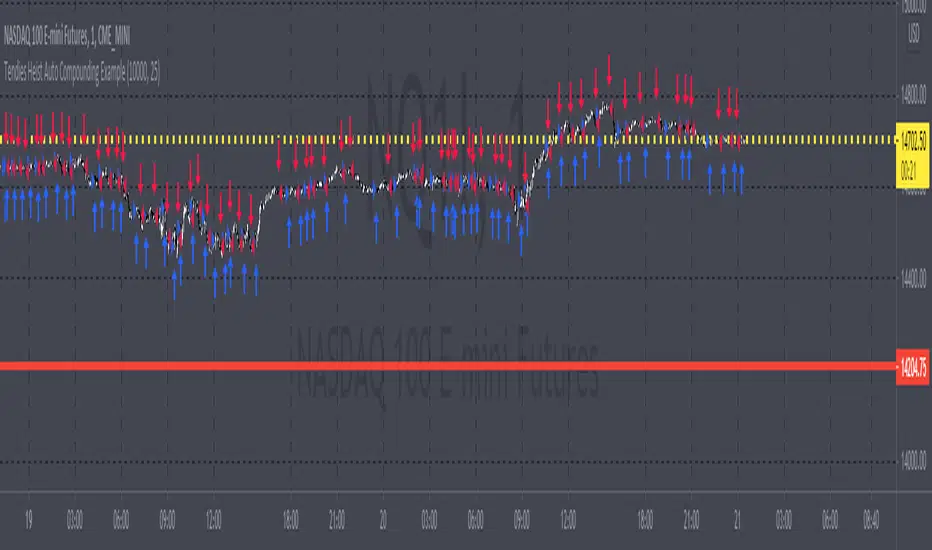
Tendies Heist Auto Compounding ExampleThis is an example of how we can use compounding to control our position size. This example shows how we can automatically add and reduce position size based on account equity. The "initial capital" in properties is the starting account equity. At default its set to 100,000. If our max position size is set to 25 then the very first position that's taken has a position size of 10, IF our leverage is set to 10,000. Account equity divided by leverage equals position size. So in that example 100,000 divided by 10,000 in leverage gives us a max position size of 10. However the max position size was set to 25 meaning we would need 250k in equity for it to open a position size of 25 with the leverage set at 10k. Now if the initial capital was set to 100,000 and the max position size was set to 5 and leverage remained at 10,000, all though 100,000 divided by 10,000 equals 10 it will ONLY open a position size of 5, because the max position size in this example was set at 5. Since this works for strategies you may look through the trade log on the posted back test and check out the position size, you can see in this back test the default 100k is used for the initial capital and the default 10k was used for the leverage. You will be able to see as this logic loses money it takes contracts away and as it gains money it adds contracts. I'm using trading view's basic strategy logic example to provide an example of how the compounding logic works.
Note, don't forget to add the syntax below to your strategy.entry call for this logic to work.
qty = size
Tendies Heist LLC 2021
Chaikin Money Flow + MACD + ATRHere I present you on of Trade Pro's Trading Idea: Chaikin Money Flow + MACD + ATR.
This strategy is not as profitable as it can be seen in one of his videos. In the forex market, the strategy could reach a maximum of 35% profitability.
I have, as some of my followers have requested, created an overview of the current position, risk and leverage settings in the form of a table.
Furthermore, one can again swap between short and long positions.
It is now possible to select or deselect individual indicators.
I have chosen the ATR alone as a take profit stop loss, as in his strategy.
A position is only triggered as soon as all prerequisites have been fulfilled and a command is executed. This prevents false triggering by bots and repainting.
-----------------------------------------------------------------------------------
How does the strategy work?
ENTRY
Long
The MACD indicator must be above the zero line.
Then the K line must cross the D line.
Finally, when this happens, the Money Flow Index must be above the zero line.
Short
Contrary to the premise of long positions.
EXIT
ATR Exit
The value of ATR at the time of buying is multiplied by the value entered in "Profit factor ATR" and "Stop factor ATR". As soon as the price reaches this value, it is closed.
Important
The script must be optimized for each coin or currency pair.
I will publish a guide to the strategy shortly. There I will explain how the table works and how to set the strategy correctly.
The results of the strategy are without commissions and leverage.
If you have any questions or feedback, please let me know in the comments.

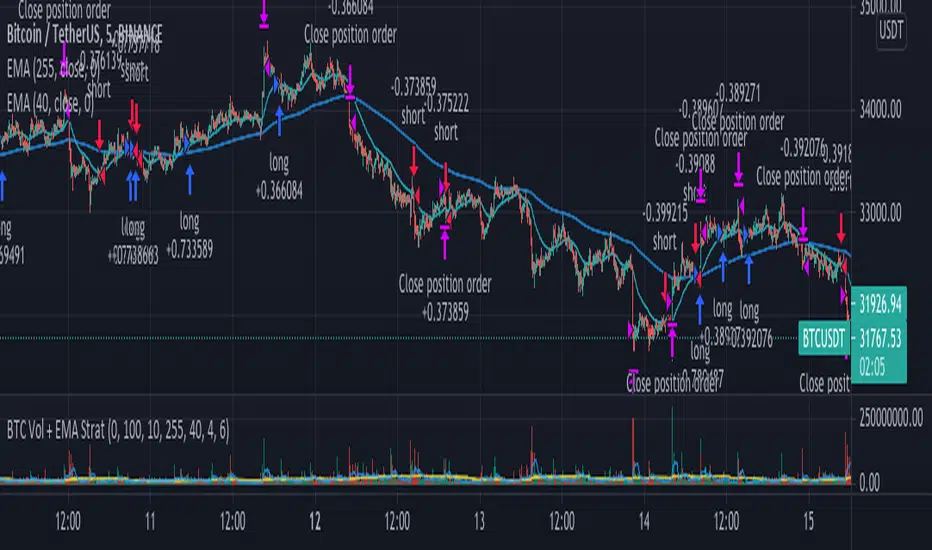
Aggregate BTC Volume + EMA Strat// This strategy buys when the price crosses the Fast EMA. It can go long only
// when the price is above the slow EMA and short when is below. The exit
// is determined by volume spikes, when the volume is greater than the Volume
// MA multiplied by the assigned input multiplier. Thanks to MartinShkreli
// for the Aggregated BTC volume. There is also a Maximum Loss filter which
// should be modified depending on the traded market.
CCI & EMA strategy by TradeswithashishThis strategy is extremely useful for positional traders or traders using timeframe 15-minute of higher. It uses following combo of values:
VWAP, CCI, Volume and Moving average (simple and exponential)
Caution:
Avoid taking trade if candle size is greater than twice the average candle size. for that wait for the retracement to near trailing stoploss

[KL] Relative Volume StrategyThis strategy will Long when:
Confirmation #1: when volume is relatively high
Confirmation #2: during periods of price consolidation (See )
It exits when either (a) stop loss limit is reached, or when (b) price actions suggest trend is bearish.
Measuring price volatility to assume consolidation:
For each candlestick, we quantify price volatility by referring to the value of standard deviations (2x) of closing prices over a look-back period of 20 candles. This is exactly what the Bollinger Band (“BOLL”) indicates by default.
Knowing the value of standard deviation (2x) of prices (aka the width of lower/upper BOLL bands), we then compare it with ATR (x2) over a user-defined length (can be configured in settings). Volatility is considered to be low, relatively, when the standard deviation (x2) of prices is less than ATR (2x).

TradePro's Trading Idea Cipher Divergence EMA Pb StrategyHere I present you on of Trade Pro's Trading Idea: Cipher B+ Divergence EMA Pullback Strategy.
Optimized the crypto pairBTC/USDT in the 30 minute chart.
There is the possibility to switch between short and long positions.
You can choose between 2 different take profit/stop loss types: The Lowest Low/ Highest High Stop Loss/ Take Profit and the ATR Take Profit/ Stop Loss.
-----------------------------------------------------------------------------------
How does the strategy work?
ENTRY
Long
The price must be above the 200 EMA .
The price needs to make a pullback into the 50 EMA .
Right after that, the Cipher B indicator must give a buy signal, it must be below the zero line and the Money Flow cloud must be green.
Short
Contrary to the premise of long positions.
EXIT
Lowest Low/ Highest High Exit
The Lowest Low (long) / highest high (short) serves as the stop loss. The TP is formed on the basis of a factor.
(Long for example: *Lowest Low* multiplied by *Profitfactor* = TP).
ATR Exit
The value of ATR at the time of buying is multiplied by the value entered in "Profit factor ATR" and "Stop factor ATR". As soon as the price reaches this value, it is closed.
Important
The script must be optimized for each coin or currency pair. However, only the values for the profit factor, the stop loss and Lowest Low / Highest High are relevant.
Also, by changing the Chanel Length and the Chanel Average, you can create strong profit changes.
The results of the strategy are without commissions and leverage.
If you have any questions or feedback, please let me know in the comments.
If you need more information about the strategy and want to know exactly how to apply it, check out my profile. There I have created a tutorial for the function of the script.

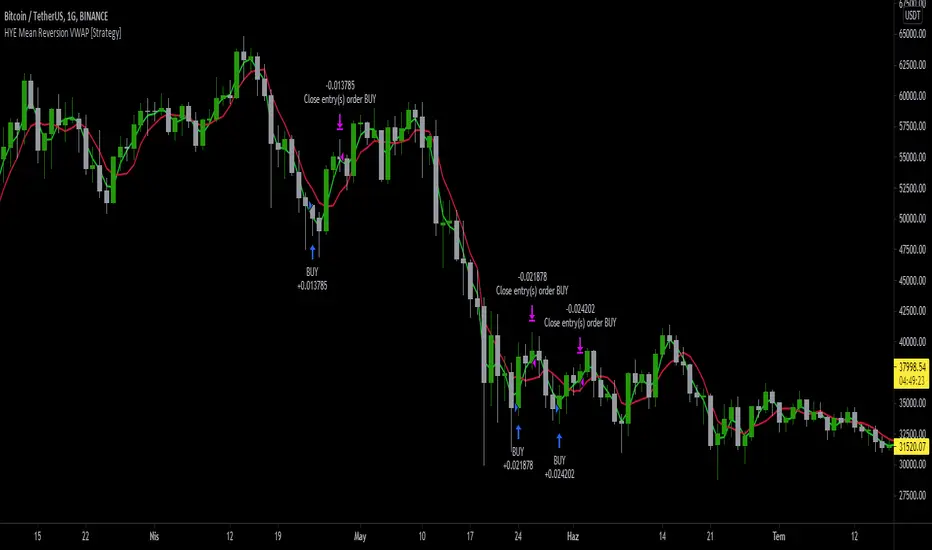
HYE Mean Reversion VWAP [Strategy]An RSI filtered version of PJ Sutherland's Jaws Mean Reversion algorithm using volume weighted average price (VWAP) instead of simple moving average (SMA).
"Long" on the close when;
1-) 2 period VWAP closes 3% or more below the 5 period VWAP ,
2-) 5 period exponential average of the 2 period RSI is below 30.
"Exit Long" on the close when;
1-) 2 period VWAP closes above the 5 period VWAP.
"Short" on the close when;
1-) 2 period VWAP closes 3% or more above the 5 period VWAP ,
2-) 5 period exponential average of the 2 period RSI is above 70.
"Exit Short" on the close when;
1-) 2 period VWAP closes below the 5 period VWAP.
*** You can change the needed percentage for long and short trades, periods of VWAPs and RSI levels.
*** You can select the trend direction: "Long Only" , "Short Only" or "Both". Default is "Long Only".
I used the "VWAP with period" indicator code of @neolao. Special thanks to @neolao.
Indicator Link:
SuperTrend - Custom Screener and Dynamic AlertsTrading View today published a desktop Bad Internet connection indicator ?! which set me thinking…
Despite recently introduced Dynamic Alerts many scripts do not leverage the information available for active traders and traders on the GO!
So decided to share this script totally ALERT focused on one of the most popular DAY trading indicators.
Of course no more BAD internet problem as long your TV APP is configured , you will have enough data for a mental picture of the chart..
The Alerts give you the BAR Close , %percent gain or loss over previous day CLOSE ++ Previous Day High and Low to effectively plan your trade without a chart!(just in case)
2 additions in the way Alerts are delivered over the last script :
1. You get SUMMARY alerts or concatenated alerts by default , however if you uncomment or activate code lines 48 and 55 you will get individual Stock alerts Too!
2. Summary Alerts will come only if there is some Buy or Sell signal NO more empty Alerts!
Few useful EXTRAS in the code :
1. Flexible code can convert any indicator to screener or Alert function.
2. You will NOT get Mutable Variable error while converting any indicator to screener as long as the function is in "GLOBAL" scope..
3. Many Custom Screeners are available but few give OHLC data in output so easily…and very difficult for traders to MODIFY hundreds of lines of code..
4. For UP or DOWN on SCREEN Stock monitoring copy /paste functions in line 41 and 42 in lieu of CROSS functions in 44 and 51 respectively..
5. You can also uncomment/activate lines 66 and 67 for labels in monitoring.
6. The default mode of the scripts is set to Alerts!
Max Stocks only 20!
Finally idea is to help traders to use the great features that TV works so hard to create and constantly improvise.
Enjoy Profitable Trading on the Fly !!

Dynamic Price SwingFinally, a price channel oscillator that works.
I programmed three flavors into this.
The first flavor uses the Fast and Slow EMA to check for the trend to ensure you don't trade in the wrong direction simply because the price crosses the previous highest high or lowest low (based on lookback bars).
The second flavor uses a seven point average of the Fibonacci bands to create an upper and lower central channel for quick trades (like DOGE).
The third flavor uses the golden Fibonacci ratio of 1.618 and trades when the price moves above or below this band.

Relative Volume & RSI PopThis is a basic idea/script designed to take a breakout trade by taking advantage of volume spikes when price/strength is extended (either long or short).
The script only utilises two indicators, the Relative Volume (RV) and the Relative Strength Index (RSI). The script allows the user to select a RSI value between 69 up to 100 for a long trade and between 35 down to 0 for short trade and then pair this with RV from 0 - 10. The period for both the RSI and RV can also be amended by the user but I found in most cases there was no benefit gained by changing away from normal "14" period lookback. The script typically only has small draw downs as the script is designed to exit the trade when the RSI returns back to "normalised" level, therefore the trades are generally quite short. The exit condition for a long trade is when RSI crosses back below 69 (which is why you cannot enter a long below this value) and for a short the, trade will close when RSI crosses back above 35 (which is why you cannot enter a short above this value). These exit values are locked.
By allowing RSI value to go all the way up to "100" on the long side and "0" on the short side this in effect is a way of eliminating the script from taking either longs or shorts if lets say you wanted to back test the script for long only spikes or short only spike. E.G. By setting RSI upper value to "75" the RV to "1" and RSI lower value to "0" then no short trades will not be taken in your back test as the RSI never really gets down to zero.
I put this together with meme stocks in mind and back tested it on day charts for AMC and then a few trending style stocks too. It typically worked best as long only and with RSI settings between 71 - 75 and RV at 1 or 1.5. I also found it had okay results on some lower 1hr timeframe futures markets and weekly time frames too (albeit trades were few and far between on weekly timeframe).
The beauty of such a basic script you could easily set up a trading view screener to look for these opportunities everyday and perhaps even add in an ADX filter on the screener to see if the trend is increasing. Then use this script to run a back test on the stocks that you've selected from the screener.

EmperorBTC's VWAP StrategyEmperorBTC's VWAP Indicator & Strategy
v2.1
coded by Bogdan Vaida
This indicator was created after EmperorBTC's conditions.
Good timeframes for it: 30', 15', 5'
To convert from strategy to study switch the commented lines in the beginning
and at the end of the script and vice versa.
What this indicator does is to check if:
o Pivot Point was crossed
o Stoch-RSI and VWAP were crossed in current or previous candle
o Candle (or previous candle) close is in the trend direction
If all these are true then it will go long or short based on direction.
