SVA - Simple Volume Analyzer, by BlueJayBird [bjb] ENGLISH & SPANISH
------------------------------------- ENSLIGH
The idea was initially inspired in the concepts shared by @LazyBear on his indicator "Better Volume Indicator" (). But I found it somewhat complicated and dull. So I came up with this.
Concept:
It changes the color of volume bars based on surrounding volume changes.
Volume changes are plotted as volume MAs lines in the volume pane.
Whenever the volume is higher than these MAs, the bar changes color.
For this reason, the bar color change is RELATIVE TO the surroundings, because the color change depends on how far the MA has been extended due to sudden (or not) changes in the volume.
BAR COLORS:
Weak Green and Red: Low volume. The calm before or after the storm.
Normal Green and Red: Mid volume. Still low volume, you may get bored.
Yellow: High volume. Players are playing hard and harder.
White: Ultra-High Volume. The elephants stepped in.
NOTES:
SVA works better at lower timeframes. Though as far as I can tell, it works pretty well as far as 1D timeframe.
------------------------------------- SPANISH
La idea estuvo inicialmente inspirada en los conceptos expuestos por @LazyBear en su indicador "Better Volume Indicator" (). Pero lo encontré un poco complicado y falto de claridad. Así que me inventé este.
Conceptp:
Cambia el color de las barras basándose en los últimos cambios de volumen.
Los cambios de volumen son ploteados como lineas de medias móviles (MAs, es decir "Moving Averages") en la sección del volumen (chart pane).
En cualquier momento que el volumen es mayor que estos MAs, el color de las barras cambia.
Por esta razon, el cambio de color de las barras es RELATIVO a lo que está sucediendo alrededor, ya que el cambio de color depende de qué tan lejos el MA se haya extendido por causa de los últimos cambios (o no) de volumen.
BAR COLORS:
Verde y rojo apagados: Volumen bajo (Low Volume). La calma antes de la tormenta.
Verde y rojo normales: Volumen medio (Mid volume). Volumen todavía bajo. Es posible que te aburras.
Amarillo: Volumen alto (High Volume). Los jugadores están jugando duro.
Blanco: Volumen ultra-alto (Ultra-High Volume). Los elefantes entran a la cancha.
NOTAS:
SVA funciona mejor en temporalidades menores. Pero por lo que he visto, funciona bien hasta la temporalidad de 1D.
VSA

Welkin Advanced Volume Study (for VSA)This is a translation of Welkin's Advanced Volume Study Indicator originally written for ThinkOrSwim. This version is simpler than Welkin's and attempts to streamline that basic functionality for beginners to Volume Spread Analysis.
This can be used to replace the built-in volume bar with a more advanced version that is designed to facilitate Volume Spread Analysis. The basic idea is to clearly call out areas of high and low volume that help a trader determine where to "Smart Money" may be attempting to move the market. Volume is an incredible powerful tool for the retail trader; learn how to use it.
Grey bar are Below Average volume .
Blue bars are Average Volume , from a 20sma of volume .
Orange bars are 2-sigma (or 2 standard deviations) above average.
Magenta bars are 3-sigma (3 standard deviations) above average.
The plotted lines represent these levels.
Yellow bars have relatively higher volume compared to the previous bar.
The study can also apply these same colors to the price candles themselves, as well as showing buying and selling pressure of the volume bars.

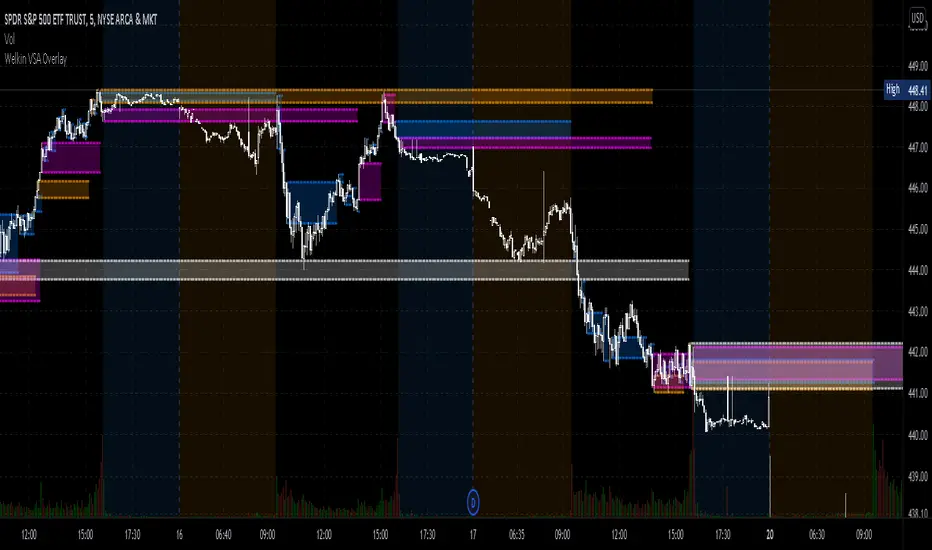
Welkin Advanced Volume Overlay (for VSA)This is a PineScript translation of Welkin's Advanced Volume Indicator Overlay, originally written for ThinkOrSwim. This tool is designed to facilitate Volume Spread Analysis (VSA) by highlighting areas of above average volume alongside price movement.
This indicator does two things:
1. Plots lines that extend from candles of above average, high, and very high volume.
2. Colors in candles with colors indicating volume levels (when "Paint Candles With Volume Colors" is enabled).
Blue lines mark candles with Average volume, based on a 20 SMA.
Orange lines mark 2-sigma (2 times standard deviations higher) volume.
Magenta lines mark 3-sigma (3 times standard deviations higher) volume.
When enabled, gray colored candles indicate below average volume.
Yellow candles indicate volume that is relatively higher than the previous candle, default is 1.25x.

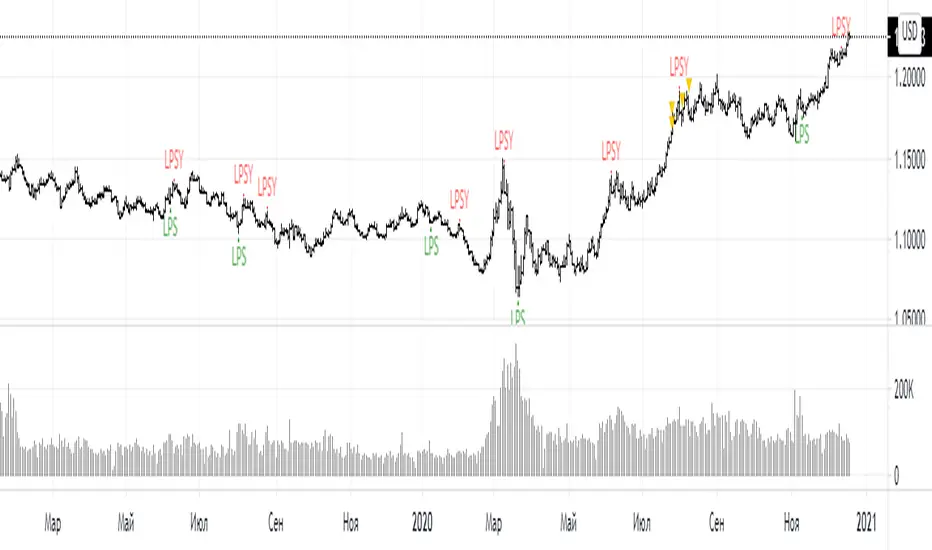
LPS PLSY INDICATOR for VSA( Google translation from Russian.)
Signal conditions:
1. There is a bar with an increased volume
2. The next bar after the bar with increased volume closes in the other direction
Arguments:
Comparison period - the period during which the volumes are compared with each other to calculate the bars with the increased volume.
sensitivity of increased volumes - according to the percentrank indicator - the border above which the volume will be considered large, the same as in the Volume on bar VSA indicator - indicator V2 - for clarity of how it works, I recommend looking at it.
efficiency of the next bar - (efficiency of the next bar from 0 to 100) ") - the efficiency of buying or selling on the next bar, bar field with a large volume. If the value is closer to 100, then the bars whose spread corresponds to the inserted volume will be taken into account, if closer to 0, then bars with a small spread and a large volume can be taken into account.
This argument is calculated similarly to the efficiency of bulls and bears for VSA
Attention.
In its original form, this indicator can give a large number of false signals. To filter out false signals, it should be used after studying the theory of VSA.
Russian language
Условия для сигнала:
1. Имеется бар с повышенным объёмом
2. Следующий бар после бара с повышенным объемом закрывается в другую сторону
Аргументы:
период для сравнения – период, на котором сравниваются между собой объёмы, для вычисления баров с повышенным объемом.
чувствительность повышенных объемов – согласно индикатору percentrank – граница выше которой̆ объем будет считаться большим, то же самое, что в индикаторе Volume on bar VSA - indicator V2 – для наглядности как это работает рекомендую посмотреть его.
эффективность следующего бара от 0 до 100 - эффективность покупок или продаж на следующем баре, поле бара с большим объемом. Если значение ближе к 100 то будут учитываться бары у которых спред соответствует вложенному объему, если ближе к 0 то могут учитываться бары у которых спред маленький а объем большой.
Расчёт этого аргумента производится аналогично индикатору efficiency of bulls and bears for VSA
Примечание
В исходном виде этот индикатор может давать большое количество ложных сигналов. Для отсеивания ложных сигналов его следует применять после изучения теории VSA.
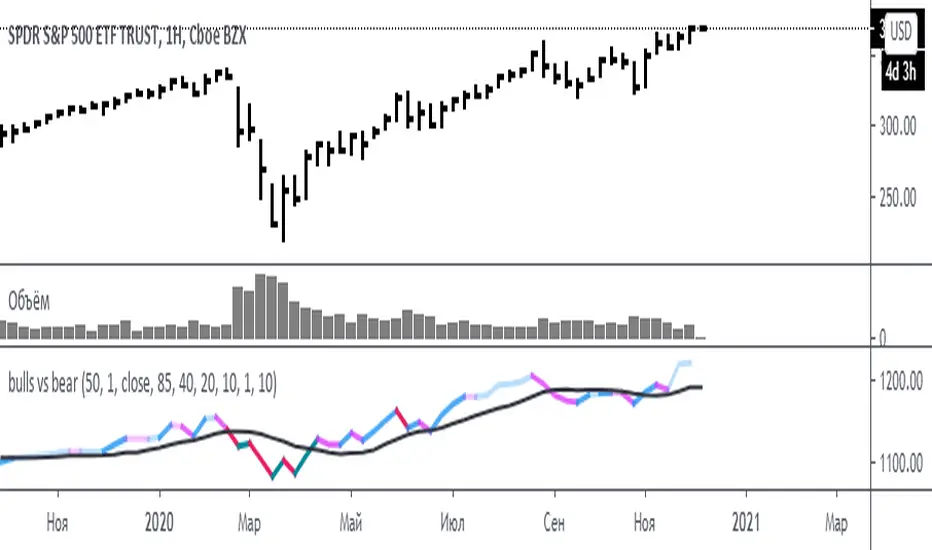
bulls vs bear for VSA(Google translation from Russian.)
This indicator is based on the efficiency of bulls and bears for VSA and has the same parameters.
Its only difference is that all the values of the efficiency of bulls and bears for VSA indicator are sequentially added here.
I want to note that the Period spread - Bars from close to close argument was made for experimental purposes, and shows interesting results for values 3-4-5, in theory this is not very logical. Because then the estimate of the spread for this interval (3-4-5) will be divided by the estimate of the volume of the current bar.
Also added here is a moving average with a default period of 10 - theoretically, if the indicator is above the moving average - the initiative is behind the bulls - if below - the initiative is behind the bears.
It is recommended to use this indicator with the indicator:
efficiency of bulls and bears for VSA
Volume on bar VSA - indicator V2
Russian language.
Этот индикатор сделан на основе efficiency of bulls and bears for VSA и имеет такие же параметры.
Единственное отличие его в том, что тут последовательно складываются все значения индикатора efficiency of bulls and bears for VSA .
Хочу отметить, что аргумент Period spread - Bars from close to close (Период спреда - Баров от закрытия до закрытия) сделан в экспериментальных целях, и показывает интересные результаты на значения 3-4-5, в теории это не очень логично. Потому-что тогда будет делиться оценка спреда за этот интервал (3-4-5), на оценку величины объема текущего бара.
Также тут добавлена скользящая средняя с периодом по умолчанию 10 – теоретически, если индикатор над скользящей средней – инициатива за быками – если ниже – инициатива за медведями.
Это индикатор рекомендуется использовать с индикатором:
efficiency of bulls and bears for VSA
Volume on bar VSA - indicator V2
efficiency of bulls and bears for VSA(Google translation from Russian.)
This indicator shows the effectiveness of selling or buying.
It is calculated as follows: using percentrank, the volume and the value of the spread are estimated (momentum = 1)
the resulting estimate of the volume value is divided by the estimate of the spread (momentum = 1) and thus we obtain the value. The larger it is, the more efficient and easier the price movement was.
If the indicator value is small, then this means that the movement was ineffective, because the volume (money) was invested. but no result.
The color of the volume bars is assigned as follows:
Buyers:
If the volume is large - Blue - green
If middle, then blue
Small - light blue
Sellers:
If the volume is large - Burgundy color
If middle, then purple
Small volume - light purple
Indicator parameters:
Comparison period - the period at which the volumes and spread are compared with each other - by default it is 50, selected as the most universal period suitable for different timeframes. But for daytime ones. Weekly and monthly timeframes may need to be shortened. This is true after significant spikes in volume that are exceptional over the long term.
Period spread - Bars from close to close - or in other words, it is momentum - defaults to 1
sensitivity of increased volumes - according to the percentrank indicator - the limit above which the volume will be considered large, the same as in the Volume on bar VSA - indicator V2 - for clarity, I recommend looking at it.
The default is 85, which means. that if the current value of the volume is greater than 85% of the remaining values in this period, then such a value of the volume will be considered high.
medium volume sensitivity - the same sensitivity of increased volumes but for medium volumes.
multiplier of increased volumes - this is an empirical factor to emphasize the importance of increased volumes - default = 20
multiplier of average volumes - the same. As above, but for medium volumes - the default is 10
reduced volume multiplier - Default is 1.
Knowledge of VSA is required to read this indicator
This indicator is recommended for use with indicators:
Volume on bar VSA - indicator V2
BAR for VSA
Russian language
Этот индикатор показывает эффективность продаж или покупок.
Рассчитывается следующим образом: с помощью percentrank оценивается величина объема и велечина спреда (momentum = 1)
полученная оценка велечины объема делится на оценку спреда (momentum = 1) и таким образом получаем значение. Чем оно больше, тем движение цены было эффективнее и легче.
Если значение индикатора маленькое, то это означает, что движение было неэффективным, поскольку объем (деньги) вложили. а результата нет.
Цвет барам объемов присваиваются следующим образом:
У покупателей:
Если объем большой - Сине – зелёный цвет
Если средний – то голубой
Маленький – свело-голубой
У продавцов:
Если объем большой - Бордовый цвет
Если средний – то пурпурный
Маленький объем – светло-пурпурный
Параметры индикатора:
Comparison period (период для сравнения) – период на котором между собой сравниваются объемы и спред – по умолчанию равно 50 , выбрано как наиболее универсальный период подходящий для различных таймфреймов. Но для дневных. Недельных и месячных таймфреймов может потребоваться уменьшить период. Это актуально после значительных всплесков объемов, которые являются исключительными на длительном периоде.
Period spread - Bars from close to close (Период спреда - Баров от закрытия до закрытия) – или другими словами это momentum – по умолчанию равно 1
sensitivity of increased volumes (чувствительность повышенных объемов) – согласно индикатору percentrank – граница выше которой объем будет считаться большим, то же самое, что в индикаторе Volume on bar VSA - indicator V2 – для наглядности как это работает рекомендую посмотреть его.
По умолчанию задано 85 – это означает. что если текущее значение объема больше, чем 85% остальных значений на этом периоде, то такое значение объема будет считаться высоким.
medium volume sensitivity (чувствительность средних объемов) – то же самое sensitivity of increased volumes но для средних объемов.
multiplier of increased volumes (множитель (вес) повышенных объемов) – это эмперический коэффициент для придания особой важности повышенным объемам- по умолчанию = 20
multiplier of average volumes (множитель (вес) средних объемов) – то же самое. Что и выше, но для средних объемов – по умолчанию равно 10
reduced volume multiplier (множитель (вес) пониженных объемов) – по умолчанию равно 1.
Для чтения данного индикатора необходимо знание VSA
Этот индикатор рекомендуется использовать с индикаторами:
Volume on bar VSA - indicator V2
BAR for VSA
Heatmap Volume [xdecow]This indicator colors the volume bars and candles according to the volume traded. The calculation of the heat map zones is done as follows:
how many standard deviations the volume are distant from the average volume?
For a better visual experience, place the borders and wicks of the candles in a neutral color.

BAR for VSABars in which the open is equal to the previous close.
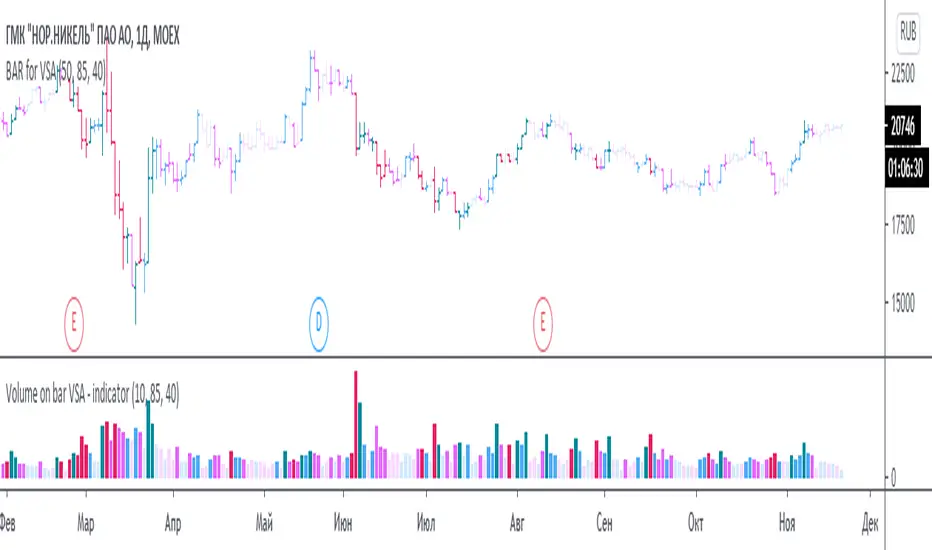
Bars are colored according to the indicator Volume on bar VSA - indicator V2
(Made for analysis by ICA ).
Бары в которых открытие равно предыдущему закрытию.
Бары раскрашиваюся согласно индикатору Volume on bar VSA - indicator V2
(Сделано для анализа по ВСА).
Biggest VolumeShows the biggest volume.Seems to me so strange, but i didnt find that kind of indicator, so i post it.
VSA indicatorGoogle translation from Russian:
This is VSA bar-by-bar analysis.
Spread, volume and progress are analyzed.
Spread is the difference between the current closing price and the previous one.
Progress is determined by dividing price by volume.
For each parameter (spread, volume, progress), a score is assigned according to the following assessment system:
Great value - 3 points
Average value - 2 points
Small value - 1 point
If the volume is small, i.e. 0 points, the other parameters are not evaluated.
Green bars represent a buyer and red bars represent a seller. It is selected based on the location of the closing price between the high and low prices of the bar. If the closing price is closer to the maximum, then these are purchases, if to the minimum, then these are sales.
The higher the bar value, the stronger the player. The maximum value on the bar is 9 (indicates the maximum values for all parameters of spread, volume and progress).
The blue line is the average value for the last 5 bars (the value changes in the settings), it can be interpreted as the balance of forces for the last 5 bars. The centerline value is multiplied by a scale factor of 2 for better display.
It should be borne in mind that to use the indicator, you need to know the VSA theory, since this indicator cannot assess the result of price changes, breaking through important levels, as well as the context in general.
Это побарный анализ VSA.
Анализируется спред, объем и прогресс.
Спред это – разница между текущей ценой закрытия и предыдущей.
Прогресс определяется делением цены на объем.
По каждому параметру (спред, объем, прогресс) присваивается балл по следующей системе оценке:
Большое значение – 3 балла
Среднее значение – 2 балла
Маленько значение – 1 балл
Если объем маленький, т.е. 0 баллов, то остальные параметры не оцениваются.
Зелёные бары обозначают покупателя, а красные продавца. Выбирается на основании расположения цены закрытия между максимальной и минимальной ценой бара. Если цена закрытия расположена ближе к максимуму, то это покупки, если к минимуму, то это продажи.
Чем больше значение бара, тем сильнее игрок. Максимальное значение на баре равно 9 (указывает максимальные значения по всем параметрам спреду, объему и прогрессу).
Синяя линия это среднее значение по последним 5 барам (значение меняется в настройках), его можно интерпретировать как баланс сил по последним 5 барам. Значение средней линии умножено на масштабный коэффициент равный 2 для лучшего отображения.
Следует учитывать, что для пользования индикатором необходимо знать теорию VSA, поскольку этот индикатор не может оценить результат изменения цены, пробитие важных уровней, а также в целом контекст.

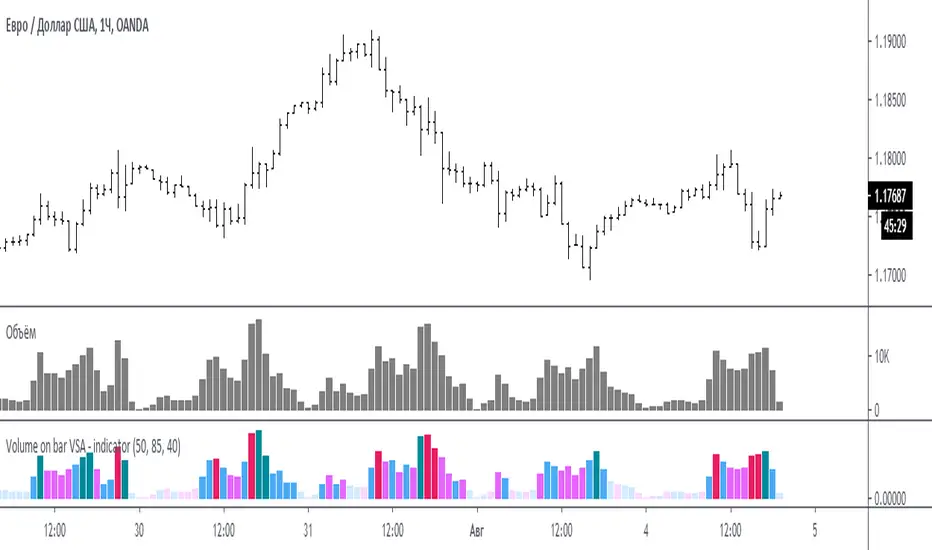
Volume on bar VSA - signal V2Google translate.
This indicator marks bars on the chart with high and medium volumes. The direction of the effort depends on whether the tail is on the bar, bullish or bearish.
In the settings you can set (sensitivity) for tinting volumes of high and medium
This indicator highlights volumes just like here
Этот индикатор помечает бары на графике с повышенными и средними объемами. Направление усилия зависимости от того какой хвост на баре, бычий или медвежий.
В настройках можно задать (чувствительность) для подкрашивания объемов повышенных и средних.
Этот индикатор выделяет объемы точно также как

Volume on bar VSA - indicator V2Google translate.
This indicator compares the volume with its average value and tints it depending on whether the tail on the bar is bullish or bearish.
In the settings you can set (sensitivity) for tinting volumes of high and medium
Этот индикатор сравнивает объем со средним его значением и подкрашивает его в зависимости от того какой хвост на баре, бычий или медвежий.
В настройках можно задать (чувствительность) для подкрашивания объемов повышенных и средних
Candles for VSACandles in which the open is equal to the previous close. (For VSA theory)
Свечи в которых открытие равно предыдущему закрытию. (Сделано для анализа по ВСА).

DeltalexИндикатор связывает спред (momentum=1) и объем. Если они большие на конкретном баре, то индикатор будет повышенным.
Также учитывается хвосты продаж и покупок. Например спред положительный, объем тоже, но хвост покупок составляет всего 10% от диапазона изменения цены на баре, тогда индикатор будет умножен на эти 10%, тем самым уменьшив его и показывая как бы, что да покупки есть но плохие.
Индикатор подкрашивается в зависимости от направления спреда, зелёный если momentum>1, красный если momentum<1
Скрип следует использовать с теорией VSA
Google translate:
The indicator connects spread (momentum = 1) and volume . If they are large on a particular bar, then the indicator will be raised.
The tails of sales and purchases are also taken into account. For example, the spread is positive, the volume is also, but the buy tail is only 10% of the price change range on the bar, then the indicator will be multiplied by these 10%, thereby decreasing it and showing, as it were, that there are but bad buys.
The indicator is colored depending on the direction of the spread, green if momentum> 1, red if momentum <1
Squeak should be used with VSA theory

Volume on bar VSA - signalЭтот индикатор сравнивает объем со средним его значением и обозначает бар в зависимости от того какой хвост на баре, бычий или медвежий.
В настройках можно задать сигнальную линию (чувствительность) для подкрашивания объемов, если он превышает эту линию. (на графике красная линия)
Сигнальная линия задаётся в процентах от среднего объема за указанный период.
Серым цветом показан средний объем.
Google translate.
This indicator compares the volume with its average value and designates a bar depending on which tail on the bar is bullish or bearish.
In the settings, you can set a signal line (sensitivity) for tinting volumes, if it exceeds this line. (red line on the chart)
The signal line is set as a percentage of the average volume for the specified period.
Gray indicates the average volume.

Volume on bar VSA - indicatorЭтот индикатор сравнивает объем со средним его значением и подкрашивает его в зависимости от того какой хвост на баре, бычий или медвежий.
В настройках можно задать сигнальную линию (чувствительность) для подкрашивания объемов, если он превышает эту линию. (на графике красная линия)
Сигнальная линия задаётся в процентах от среднего объема за указанный период.
Серым цветом показан средний объем.
Google translate
This indicator compares the volume with its average value and tints it depending on which tail on the bar is bullish or bearish.
In the settings, you can set a signal line (sensitivity) for tinting volumes, if it exceeds this line. (red line on the chart)
The signal line is set as a percentage of the average volume for the specified period.
Gray indicates the average volume.

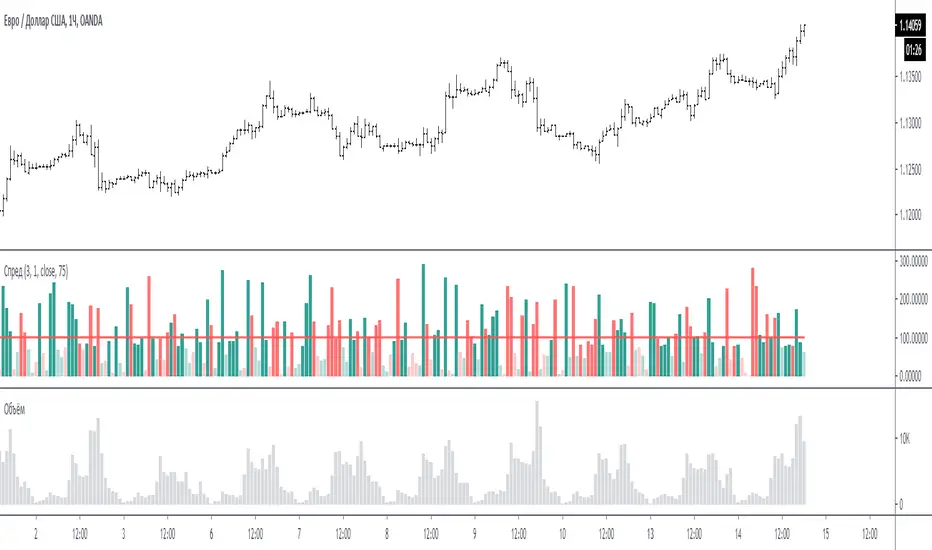
Spread for VSAЭтот индикатор сравнивает спрэд (расстояние от закрытия предыдущего бара до закрытия текущего бара или индикатор Momentum = 1) на периоде для сравнения.
На графике за 100 % принимается среднее значение спрэда за период для сравнения - красная линия. (по умолчанию период сравнения равен 3 - то есть три последних бара)
Размер бара на графике равен текущему спрэду по отношению к 100 %.
Если бар меньше 100 % то он ниже среднего, и наоборот если больше 100% то он больше среднего.
Если бар красный - спрэд отрицательный (текущее закрытие меньше предыдущего закрытия)
Если бар зелёный - спрэд положительный (текущее закрытие больше предыдущего закрытия)
Если бар меньше 75% то он будет окрашен в тусклый цвет (этот процент можно менять в настройках)
Если в настройках период спрэда указать больше 1, например 2, то спрэд будет равен закрытие мину закрытие через 1 бар назад. (это для экспериментов).
Примечание:
по умолчанию период для сравнения равен 3, но также интересен график и при значениях 15 и больше. Экспериментируйте.
По вопросам и предложениям пишите в комментариях.
Automatic translation google translate.
This indicator compares the spread (the distance from the closing of the previous bar to the closing of the current bar or the Momentum indicator = 1) on the period for comparison.
On the chart, the average spread value for the period for comparison is the red line, taken as 100%. (by default, the comparison period is 3 - that is, the last three bars)
The size of the bar on the chart is equal to the current spread with respect to 100%.
If the bar is less than 100%, then it is below average, and vice versa, if more than 100%, then it is more than average.
If the bar is red, the spread is negative (the current close is less than the previous close)
If the bar is green, the spread is positive (the current close is greater than the previous close)
If the bar is less than 75%, then it will be painted in a dull color (this percentage can be changed in the settings)
If in the settings the period of the spread is specified more than 1, for example 2, then the spread will be equal to closing mine closing after 1 bar back. (this is for experimentation).
Note:
the default period for comparison is 3, but the chart is also interesting for values of 15 or more. Experiment.
For questions and suggestions, write in the comments.
SOT INDICATOR for VSARussian language
SOT бар для VSA (Volume spread analysis)
Индикатор обозначает бары указывающие на остановку цены и возможный разворот.
Индикатор в первую очередь написан для таймфреймов от одного часа. На таймфреймах менее 1 часа сигнал будет приводить к неверным результатам, поскольку вечерние объемы существенно ниже дневных.
условие 1: закрытие текущего бара близко к закрытию предыдущего (достигается путём сравнения среднего диапазона последних 5 баров)
sma(high-close,5) - это средний диапазон за 5 баров
итого получается разница между закрытиями меньше 1/2 среднего диапазона за последние 5 баров.
Условие 2: должен быть хвост продаж или покупок (критерий - составляет не менее 2/3 от всего диапазона бара)
Условие 3: объемы должны быть увеличивающиеся (я взял, что текущей объем должен быть больше среднего за последние 5 баров)
Индикатор следует использовать совместно с теорией VSA.
English language (Google Translate)
SOT bar for VSA
The indicator indicates bars indicating a stop of the price and a possible reversal.
The indicator is primarily written for time frames from one hour. On time frames of less than 1 hour, the signal will lead to incorrect results, since evening volumes are significantly lower than daily volumes.
Condition 1: closing the current bar is close to closing the previous one (achieved by comparing the average range of the last 5 bars)
sma (high-close, 5) is the average range for 5 bars
total, the difference between closures is less than 1/2 of the average range for the last 5 bars.
Condition 2: there must be a tail of sales or purchases (the criterion is at least 2/3 of the entire range of the bar)
Condition 3: volumes must be increasing (I took that the current volume should be more than the average for the last 5 bars)
The indicator should be used in conjunction with VSA theory.

Volume DensityA group of two indicators:
The "Volume Density" shows how much volume was thrown out relative to the covered price range.
The "Volume Density Bars" shows the same, but with colour on top of the bar chart.

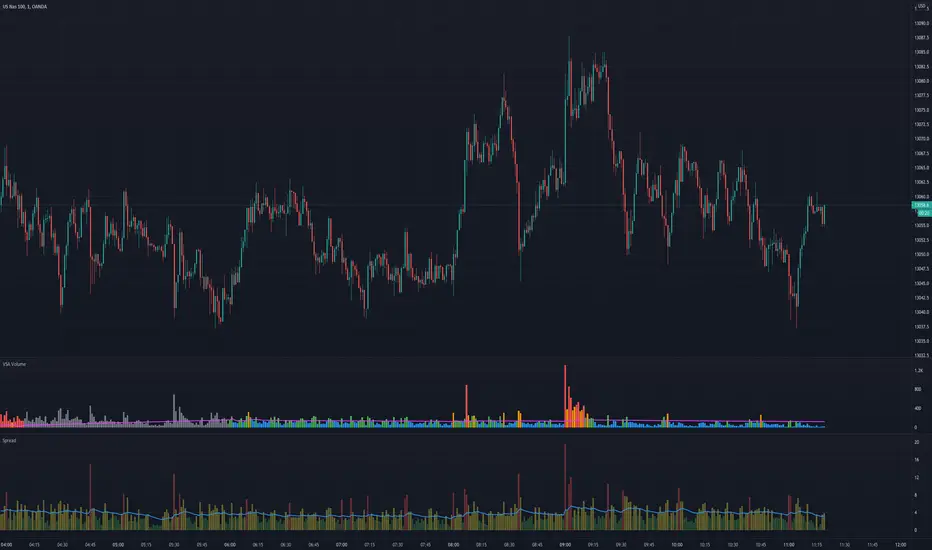
VSA VolumeVolume indicator judging level of volume per bar accordingly to Volume Spread Analysis rules. It allows either to set static volume levels or dynamic ones based on ratio comparable to Moving Average. Bars are coloured based on ratio or static levels, visually presenting level of Volume (low, average, high, ultra high).

VSA SpreadMeasures spread of the candle, useful especially for Volume Spread Analysis (VSA) and to measure trend strength. Spread is coloured based on level comparable to Moving Average.