Simple Multi VWAPSimple Multi VWAP - Release Notes
Overview
**Simple Multi VWAP** is a powerful Volume Weighted Average Price (VWAP) indicator that allows you to display up to **four independent VWAP lines** simultaneously on your chart, each with its own customisable anchor period. This provides traders with a comprehensive view of volume-weighted price levels across different timeframes, enabling better analysis of price action and support/resistance levels.
Key Features
Multiple VWAP Lines
- Display up to **4 independent VWAP lines** on a single chart
- Each VWAP can be individually enabled or disabled
- Each VWAP maintains its own anchor period independently
Flexible Anchor Periods
Choose from **10 different anchor periods** for each VWAP:
- **Session** - Resets daily
- **Week** - Resets weekly
- **Month** - Resets monthly
- **Quarter** - Resets quarterly
- **Year** - Resets annually
- **Decade** - Resets every 10 years
- **Century** - Resets every 100 years
- **Earnings** - Resets on earnings announcements
- **Dividends** - Resets on dividend payments
- **Splits** - Resets on stock splits
Native Styling Support
- Full integration with TradingView's native style dialog
- Right-click any VWAP line to customise:
- Colour
- Line style (solid, dashed, dotted, etc.)
- Line thickness
- Opacity
- Default colours provided for easy identification:
- **VWAP #1**: Orange (#f19d37)
- **VWAP #2**: Purple (#7859bc)
- **VWAP #3**: Red (#df484b)
- **VWAP #4**: Cyan (#54b9d1)
Global Settings
- **Source**: Choose the price source (default: Close)
- **Offset**: Shift VWAP lines forward/backward in time
- **Hide on 1D or Above**: Automatically hide VWAPs on daily or higher timeframes
How to Use
Basic Setup
1. **Add the Indicator**: Search for "Simple Multi VWAP" in TradingView's indicator library
2. **Enable VWAPs**: Check the boxes next to the VWAPs you want to display
3. **Select Anchor Periods**: Choose the anchor period for each enabled VWAP using the dropdown next to each VWAP toggle
4. **Customise Styling**: Right-click any VWAP line → "Style" to customise appearance
Recommended Configurations
Intraday Trading
- **VWAP #1**: Session (daily reset)
- **VWAP #2**: Week (weekly reset)
- **VWAP #3**: Month (monthly reset)
Swing Trading
- **VWAP #1**: Week (weekly reset)
- **VWAP #2**: Month (monthly reset)
- **VWAP #3**: Quarter (quarterly reset)
Long-term Analysis
- **VWAP #1**: Month (monthly reset)
- **VWAP #2**: Quarter (quarterly reset)
- **VWAP #3**: Year (yearly reset)
- **VWAP #4**: Decade (decade reset)
Input Settings
Global Settings
- **Source**: Price source for all VWAP calculations (default: Close)
- **Offset**: Number of bars to shift the VWAP lines (default: 0)
- **Hide VWAP on 1D or Above**: Toggle to hide all VWAPs on daily/weekly/monthly charts
VWAP Settings
Each VWAP has two settings displayed on the same line:
- **Enable Toggle**: Checkbox to show/hide the VWAP line (labelled as "VWAP#1", "VWAP#2", etc.)
- **Anchor Period**: Dropdown to select the reset period (labelled as "---> Anchor Period")
*Note: All VWAP settings are grouped under a single "VWAPs" group for easy organisation.*
Technical Details
Calculation Method
The indicator uses TradingView's built-in `ta.vwap()` function, which calculates:
**VWAP** = Σ(Price × Volume) / Σ(Volume)
The calculation resets based on the selected anchor period, ensuring accurate volume-weighted averages for each timeframe.
Event-Based Anchors
For Earnings, Dividends, and Splits anchors, the indicator uses TradingView's data requests to detect these events automatically, ensuring precise reset points.
Use Cases
Support and Resistance Levels
Multiple VWAPs help identify key support and resistance zones across different timeframes. Price often respects these levels, making them valuable for entry and exit decisions.
Trend Analysis
Compare price action against multiple VWAPs to gauge trend strength:
- Price above all VWAPs = Strong uptrend
- Price below all VWAPs = Strong downtrend
- Mixed positioning = Consolidation or trend change
Mean Reversion
When price deviates significantly from VWAP, it may indicate overextension and potential mean reversion opportunities.
Entry/Exit Signals
- **Long Entry**: Price crosses above VWAP with volume confirmation
- **Short Entry**: Price crosses below VWAP with volume confirmation
- **Exit**: Price returns to VWAP after a significant move
Tips & Best Practices
1. **Start Simple**: Begin with 1-2 VWAPs to avoid chart clutter
2. **Match Timeframes**: Use anchor periods that align with your trading timeframe
3. **Combine with Volume**: VWAP works best when combined with volume analysis
4. **Use Multiple Timeframes**: Apply the indicator to multiple chart timeframes for confirmation
5. **Customise Colours**: Use distinct colours for each VWAP to easily identify them
Notes
- The indicator requires volume data to function properly
- VWAP calculations are most accurate on intraday charts
- Event-based anchors (Earnings, Dividends, Splits) require symbol data availability
- All VWAPs share the same source input for consistency
Version Information
**Current Version**: 1.0.0
Media mobile ponderata con volume (VWMA)

WMA SupertrendVWMA Supertrend for identifying good entry points
Divides the slow VWMA and fast VWMA and multiplies by the close price to give a mountain-style price showing possible entries.

Volume Trabar Rank PRO🔑 Key Concept
The indicator uses a rank-based system that counts the number of timeframe periods (lengths) where price has exceeded standard deviation thresholds. The higher the absolute rank value, the more extreme the market condition — indicating stronger potential reversal zones.
⚙️ How The Indicator Works
The indicator operates on a unique multi-length Bollinger Band analysis system:
📏 Multiple Length Analysis
📊 Rank Calculation
Counts how many bands the price has broken through to generate a rank value from -18 to +18
🎨 Visual Coding
Color-coded histogram and threshold lines for quick visual interpretation
Ranking System Explained :
Rank Value Signal Strength Typical Action
+8 to +18 Very Strong Consider Selling / Taking Profit
+7 Strong Watch for reversal signals
+4 to +6 Moderate Caution for new longs
+1 to +3 Weak Monitor market conditions
0 Neutral No extreme condition
-1 to -3 Weak Monitor market conditions
-4 to -6 Moderate Look for entry opportunities
-7 Strong Strong buy signal
-8 to -18 Very Strong High probability buy zone
Advanced Features
✅Filter #1: Volume Weighting
✅Filter #2: Outlier Filtering (IQR)
✅Filter #3: Anti-Repaint Logic
⏰ Multi-Timeframe Analysis
The indicator can simultaneously monitor up to 4 different timeframes (default: 1m, 5m, 15m, 30m), allowing traders to:
Identify confluence zones where multiple timeframes show the same signal
Spot divergences between timeframes for better timing
Generate "READY" signals when all MTF conditions align
🎯 MTF Ready Signal
READY BUY: Triggers when MTF #1, #2, and #3 all show oversold ranks ≤ -5
READY SELL: Triggers when MTF #1, #2, and #3 all show overbought ranks ≥ +5
These signals indicate strong multi-timeframe alignment, providing high-probability trading opportunities.
You can see here :
🛠️ How This Indicator Was Created
Accuracy Improvements (v3.0)
Volume Weighting: Replaced SMA with VWMA for better accuracy
Outlier Filtering: Added IQR-based filtering to remove false signals from price spikes
✨ Key Advantages
🚫 No Repainting
Anti-repaint logic ensures signals don't disappear or change after bar closure, providing reliable backtesting and live trading signals.
📊 Multi-Timeframe
Simultaneously monitor up to 4 timeframes, identifying confluence and divergence for better timing and higher probability trades.
🎯 Volume-Weighted
Uses actual volume data to weight calculations, making signals more representative of true market sentiment and participation.
🔬 Outlier Filtered
IQR-based filtering removes false signals from flash crashes, spikes, and other anomalous price action that doesn't represent real conditions.
⚡ Performance Optimized
Carefully tuned to balance accuracy with speed. Default settings optimize for the top 10% extreme conditions without lag.
🎨 Highly Customizable
Over 30 input parameters allow complete customization of lengths, thresholds, colors, and display options to match your trading style.
I just also add :
5M SCALPING OPTIMAL SETTINGS
Alert 🔥 Extreme Signal (Buy/Sell) - Priority HIGH and ⭐ Mid-Term Signal (Buy/Sell) - Priority NORMAL
MTF Blending Options ( 8 Blending Modes )
Rank Occurrences Table.
Bull and Bear divergence
-------
To get access to this script you have to be a member, or DM on TradingView.

Multi Rolling VWAPMulti Rolling VWAP Indicator
Displays 4 volume-weighted average price (VWAP) levels on your chart:
7D VWAP - Weekly rolling average
30D VWAP - Monthly rolling average
90D VWAP - Quarterly rolling average
365D VWAP - Yearly rolling average
Each VWAP shows where the average price is, weighted by volume. Institutional traders often use these levels as support/resistance.
Optional Features:
Bands show volatility zones (Value Area High/Low)
Anchor modes: Reset weekly, monthly, quarterly, or yearly instead of rolling
Crypto volume aggregation from 15+ exchanges for accurate calculations
Clean, minimal design for white background charts.

✝️📈📉☢️🔱NUKE is a multi-ticker signal indicator, optimized for intraday futures and stocks trading.
To use: Add to a multi-timeframe charts (e.g., 1m, 5m, 15m), select up to 5 tickers (e.g., MNQ, MES), and set an anchor mode (daily, weekly, monthly, or manual) for session resets. Enable/disable signal components like AVWAP, Price Stoch, VWEMA crosses, ADX, and BB in settings.
For trading: Monitor the dynamic table for recent LONG (L↑) or SHORT (S↓) entries with strength ☢️ (1 to 6, higher indicates stronger confluence). Enter positions in the signal direction on the chart ticker or selected ones, using multi-timeframe confirmation (e.g., anchor to daily while trading on seconds/minutes).
Apply proper risk management, such as ATR-based stops, and test in demo mode.

Percentile Rank Oscillator (Price + VWMA)A statistical oscillator designed to identify potential market turning points using percentile-based price analytics and volume-weighted confirmation.
What is PRO?
Percentile Rank Oscillator measures how extreme current price behavior is relative to its own recent history. It calculates a rolling percentile rank of price midpoints and VWMA deviation (volume-weighted price drift). When price reaches historically rare levels – high or low percentiles – it may signal exhaustion and potential reversal conditions.
How it works
Takes midpoint of each candle ((H+L)/2)
Ranks the current value vs previous N bars using rolling percentile rank
Maps percentile to a normalized oscillator scale (-1..+1 or 0–100)
Optionally evaluates VWMA deviation percentile for volume-confirmed signals
Highlights extreme conditions and confluence zones
Why percentile rank?
Median-based percentiles ignore outliers and read the market statistically – not by fixed thresholds. Instead of guessing “overbought/oversold” values, the indicator adapts to current volatility and structure.
Key features
Rolling percentile rank of price action
Optional VWMA-based percentile confirmation
Adaptive, noise-robust structure
User-selectable thresholds (default 95/5)
Confluence highlighting for price + VWMA extremes
Optional smoothing (RMA)
Visual extreme zone fills for rapid signal recognition
How to use
High percentile values –> statistically extreme upward deviation (potential top)
Low percentile values –> statistically extreme downward deviation (potential bottom)
Price + VWMA confluence strengthens reversal context
Best used as part of a broader trading framework (market structure, order flow, etc.)
Tip: Look for percentile spikes at key HTF levels, after extended moves, or where liquidity sweeps occur. Strong moves into rare percentile territory may precede mean reversion.
Suggested settings
Default length: 100 bars
Thresholds: 95 / 5
Smoothing: 1–3 (optional)
Important note
This tool does not predict direction or guarantee outcomes. It provides statistical context for price extremes to help traders frame probability and timing. Always combine with sound risk management and other tools.

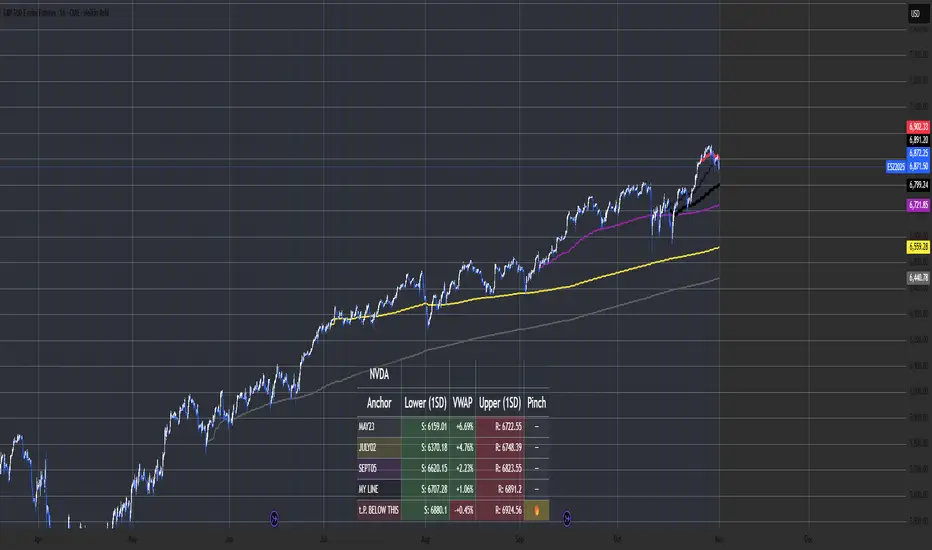
Multi-Anchor VWAP Deviation Dashboard Overview
Multi-Anchor VWAP Deviation Dashboard (Optimized Global) is an overlay indicator that computes up to five user-defined Anchored Volume Weighted Average Prices (AVWAPs) from custom timestamps, plotting their lines and displaying real-time percentage deviations from the current close. It enables precise analysis of price positioning relative to key events (e.g., earnings, news) or periods (e.g., weekly opens), with a compact dashboard for quick scans. Optimized for performance, it uses manual iterative calculations to handle dynamic anchor changes without repainting.
Core Mechanics
The indicator focuses on efficient AVWAP computation and deviation tracking:
Anchor Configuration: Five independent anchors, each with a name, UTC timestamp (e.g., "01 Oct 2025 00:00" for monthly open), show toggle, and color. Timestamps define the calculation start—e.g., AVWAP1 from "20 Oct 2025" onward.
AVWAP Calculation: For each enabled anchor, it identifies the first bar at/after the timestamp as the reset point, then iteratively accumulates (price * volume) / total volume from there. Uses HLC3 source (customizable); handles input changes by resetting sums on new anchors.
Deviation Metric: For each AVWAP, computes % deviation = ((close - AVWAP) / AVWAP) * 100—positive = above (potential resistance), negative = below (support).
Visuals: Plots lines (linewidth 1–2, user colors); dashboard (2 columns, 6 rows) shows names (anchor-colored if enabled) and deviations (green >0%, red <0%, gray N/A), positioned user-selectable with text sizing. Updates on last bar for efficiency.
This setup scales deviations across volatilities, aiding multi-period bias assessment.
Why This Adds Value & Originality
Standard VWAPs limit to session anchors (daily/weekly); deviation tools often lack multiples. This isn't a simple mashup: Manual iterative AVWAP (no built-in ta.vwap reliance) ensures dynamic resets on timestamp tweaks—e.g., shift "Event" to FOMC date without recalc lag. The 5-anchor flexibility (arbitrary UTC times) + centralized dashboard (colored deviations at a glance) creates a "global timeline scanner" unique to event-driven trading, unlike rigid multi-VWAP scripts. It streamlines what requires 5 separate indicators, with % normalization for cross-asset comparison (e.g., SPY vs. BTC).
How to Use
Setup: Overlay on chart. Configure anchors (e.g., Anchor1: "Weekly Open" at next Monday 00:00 UTC; enable/show 2–3 for focus). Set source (HLC3 default), position (Top Right), text size (Small).
Interpret Dashboard:
Left Column: Anchor names (e.g., "Monthly Open" in orange).
Right Column: Deviations (e.g., "+1.25%" green = above, bullish exhaustion?).
Scan for confluence (e.g., all >+2% = overbought).
Trading:
Lines: Price near AVWAP = mean reversion; breaks = momentum.
Example: -0.8% below "Event" anchor post-earnings → potential bounce buy.
Use on 1H–D; adjust timestamps via calendar.
Tips: Enable 1–3 anchors to avoid clutter; test on historical events.
Limitations & Disclaimer
AVWAPs reset on anchor bars, potentially lagging mid-period; deviations are % only (add ATR for absolute). Table updates on close (no intrabar). Timestamps must be UTC/future-proof. No alerts/exits—integrate manually. Not advice; backtest deviations on your assets. Past ≠ future. Comments for ideas.
OBV (Delta or regular)This is a quite simple script to apply some choices to OBV.
You can choose to use regular OBV values or you can choose to use delta OBV values.
Delta OBV values calculates the delta between selling volume and buying volume per bar to find discrepancies.
You can make the OBV a smoothed line or just keep the normal rigid line. Rigid line is default.
A secondary smoothed OBV line is added automatically with color change if the OBV is above or below the smoothed line.
You can set your desired MA from SMA, EMA, VWMA and WMA, The same will be applied to both lines if chosen to smooth them both.
Both lines are editable from the styles tab (visibility, color and line type)
If you for some reason don't want color change on the secondary line, chose the same color for both color 1 and 2.
Simple delta OBV example:
If a red bar has a long lower wick, OBV will calculate the entire bar towards bearish volume, while the delta will check if there's more buying or selling happening in total. Some times you'll be able to catch divergences in the volume which implies a reversal might be in the making.
For instance more selling on a green candle making the OBV drop instead of increasing or vise versa.
Hopefully someone finds is useful.

Simulated Liquidity Zone Heatmap (SLZH) v5 (Stable)# 📈 Simulated Liquidity Zone Heatmap (SLZH) v5 - Order Flow Proxy & Adaptive VWAP
## 💡 Overview
The **Simulated Liquidity Zone Heatmap (SLZH)** is an advanced, stable Pine Script indicator designed to give traders an edge by visualizing **structural market liquidity** and **institutional order flow**. It acts as a powerful proxy for structural zones (like average cost basis) that are often missed by traditional technical analysis.
SLZH achieves this by combining two highly effective components:
1. **Volume-Based Liquidity Zones (VBLZ):** A dynamic, adaptive heatmap based on **Volume-Weighted Average Price (VWAP)** and Standard Deviation.
2. **Order Block (OB) Signals:** Stable, high-conviction signals marking the origin of strong impulsive moves.
---
## 📊 Key Features & Interpretation
### 1. Volume-Based Liquidity Zones (VBLZ) - The Adaptive Heatmap
The VBLZ dynamically paints a three-tiered support/resistance system, representing the market's average cost basis and conviction. This is primarily used as a **mean-reversion tool**.
| Component | Interpretation | Trading Action |
| :--- | :--- | :--- |
| **VWAP Center** (White Line) | The **Center of Liquidity**. Price is often attracted back to this line. | Use as a **Primary Target** when trading from the outer zones. |
| **Strong VBLZ** (Darkest Color) | **Highest Volume Concentration** (1 StdDev). Primary structural support/resistance. | Look for **Reversals** when price enters this zone. |
| **Mid/Weak VBLZ** (Lighter Colors) | Secondary areas of interest. | Use as **Secondary Targets** or to confirm an extended move. |
### 2. Order Block (OB) Signals - Structural Support/Resistance
The OB signals mark the last counter-trend candle before a strong, sustained move, indicating a potential institutional supply or demand zone. These are displayed as stable triangles on the chart.
* **Bullish OB** (Green Triangle Up): Marks a potential **Demand Zone**. Look for high-probability **long entries** when price returns to the area of this signal.
* **Bearish OB** (Red Triangle Down): Marks a potential **Supply Zone**. Look for high-probability **short entries** when price returns to the area of this signal.
---
## 🎯 High-Conviction Trading Strategy
The most effective way to use SLZH is to look for **confluence** between the dynamic VBLZ and the static OB signals. This combination creates the highest probability trade setups.
| Trade Setup | VBLZ Condition | OB Signal Condition | Action | Rationale |
| :--- | :--- | :--- | :--- | :--- |
| **High-Conviction Long** | Price is near or entering the **Strong VBLZ** from above. | A **Bullish OB Signal** is present in the same area. | **Enter Long** | Strong alignment between the market's average cost basis (VBLZ) and a structural demand zone (OB). |
| **High-Conviction Short** | Price is near or entering the **Strong VBLZ** from below. | A **Bearish OB Signal** is present in the same area. | **Enter Short** | Strong alignment between the market's average cost basis (VBLZ) and a structural supply zone (OB). |
### Setting Up Alerts
The script is equipped with three critical alert conditions for automated monitoring:
1. **Price in Strong VBLZ:** Notifies you when price enters the highest conviction heatmap zone.
2. **Bullish OB Signal:** Notifies you when a new Demand Zone is established.
3. **Bearish OB Signal:** Notifies you when a new Supply Zone is established.
---
## ⚙️ Customization (Inputs)
Adjust the indicator's sensitivity via the settings menu:
* **VBLZ Lookback Length:** Controls the recency of the heatmap calculation. **Higher values** create a smoother, longer-term zone.
* **OB Min Price Move (ATR Multiplier):** Filters the Order Blocks. **Increase this value** to show only the highest-conviction zones that led to the most powerful price moves.
---
**Note on Stability:** This is **v5**, a highly stable version optimized to avoid common Pine Script runtime errors. It uses stable `plotshape` signals instead of persistent boxes for the Order Blocks to ensure reliable performance on all charts.

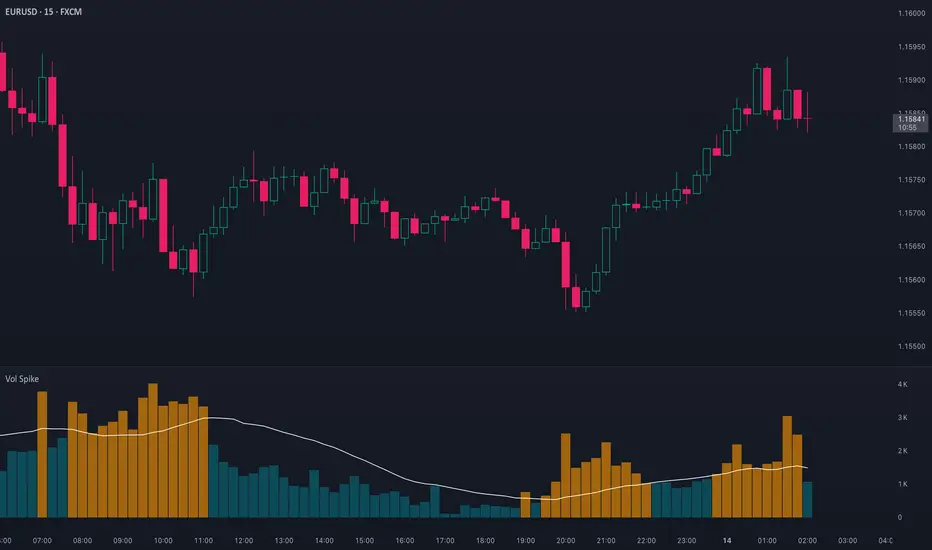
Volume Spike (Multi-Timeframe)Volume Spike (Multi-Timeframe)
Overview
Volume Spike (Multi-Timeframe) evaluates traded volume against its moving average on a selected timeframe so traders can identify when activity departs from recent norms.
What it does
Calculates volume on the chart timeframe or any alternate timeframe you select in the inputs.
Builds a configurable simple moving average to establish a rolling volume benchmark.
Applies distinct colors to spike and baseline volume columns to highlight deviations.
Plots the related moving-average line for reference.
Registers an alert condition when volume closes above its moving-average baseline.
How to use it
Choose the desired Volume Timeframe (leave blank to inherit the chart’s period).
Tune the Volume MA Length to balance responsiveness and noise.
Adjust the spike, base, and MA colors to align with existing chart styling.
Enable the alert condition when automated notification of spikes is needed.
Implementation notes
Timeframe selection is applied consistently to both the raw volume series and its moving average.
Color inputs allow visual adjustments without modifying code.
Alert messaging specifies that the event is a volume spike relative to the selected timeframe baseline.
Disclaimer
This indicator is designed as a technical analysis tool and should be used in conjunction with other forms of analysis and proper risk management.
Past performance does not guarantee future results, and traders should thoroughly test any strategy before implementing it with real capital.
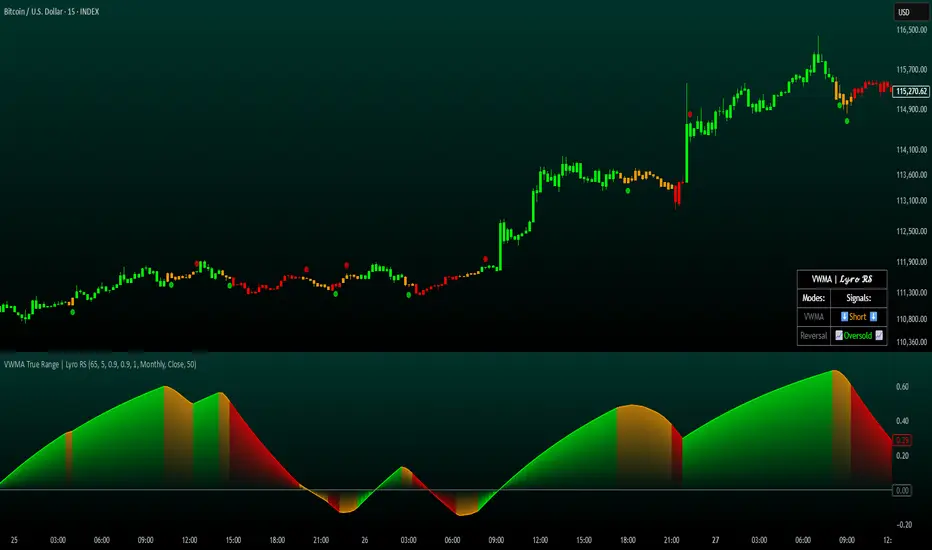
VWMA True Range | Lyro RSVWMA True Range | Lyro RS
This script is a hybrid technical analysis tool designed to identify trends and spot potential reversals. It employs a consensus-based system that uses multiple smoothed, Volume-Weighted Moving Averages (VWMA) to generate both trend-following and counter-trend signals.
Understanding the Indicator's Components
The indicator plots a main line on a separate pane and provides visual alerts directly on the chart.
The Main Line: This line represents a smoothed average of momentum scores derived from multiple VWMAs. Its direction and value are the foundation of the analysis.
Signal Generation: The tool provides two distinct types of signals:
Trend Signals: These trend-following signals ("⬆️Long" / "⬇️Short") activate when the indicator's consensus reaches a pre-set strength threshold, indicating sustained momentum in one direction.
Reversal Signals: These counter-trend alerts ("📈Oversold" / "📉Overbought") trigger when the main line breaks a previous period's level, hinting at exhaustion and a potential short-term reversal.
Visual Alerts:
Colored Background: The indicator's background highlights during strong trend signals for added visual emphasis.
Chart Shapes: Small circles appear on the main chart to mark where potential reversals are detected.
Colored Candles: You can choose to color the price candles to reflect the current trend signal.
Information Table: A compact table provides an at-a-glance summary of all currently active signals.
Suggested Use and Interpretation
Here are a few ways to incorporate this indicator into your analysis:
Following the Trend: Use the "Long" or "Short" trend signals to align your trades with the prevailing market momentum.
Spotting Reversals: Watch for "Oversold" or "Overbought" reversal signals, often accompanied by chart shapes, to identify potential market turning points.
Combining Signals: Use the primary trend signal for context and look for reversal signals that may indicate a pullback within the larger trend, potentially offering favorable entry points.
Customization Options:
You can tailor the indicator's behavior and appearance through several settings:
Core Settings: Adjust the Calculation Period and Smooth Length to make the main line more or less responsive to price movements.
Signal Thresholds: Fine-tune the Long threshold and Short threshold to control how easily trend signals are triggered.
Visual Settings: Toggle various visual elements like the indicator band, candle coloring, and the information table on or off.
Table Settings: Customize where the information table appears and its size to suit your chart layout.
⚠️Disclaimer
This indicator is a tool for technical analysis and does not guarantee future results. It should be used as part of a comprehensive trading strategy that includes other analysis techniques and strict risk management. The creators are not responsible for any financial decisions made based on its signals.
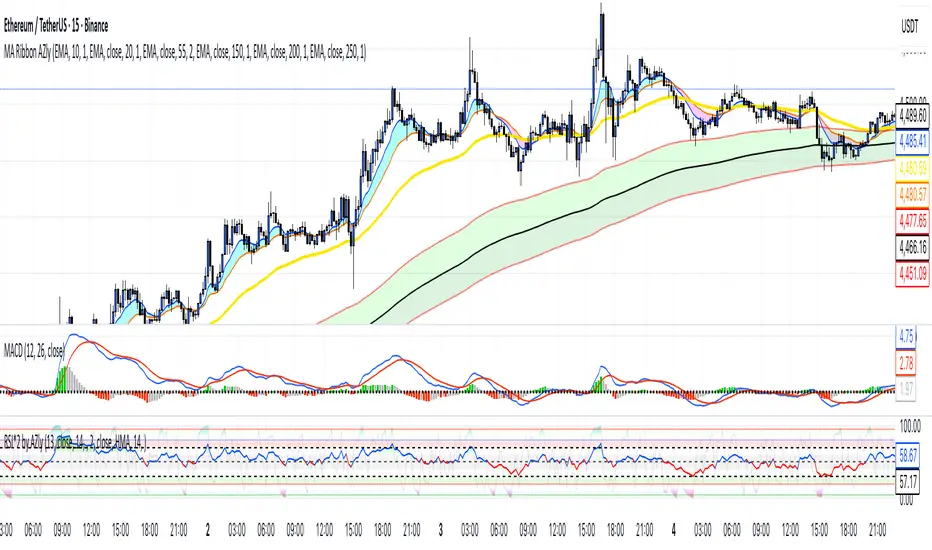
Moving Average Ribbon AZlyMoving Average Ribbon AZly
The Moving Average Ribbon AZly is a flexible trend-following indicator that visualizes market direction, strength, and transition phases using multiple customizable moving averages. It helps traders instantly identify when short-, medium-, and long-term trends align or diverge.
🔧 How it works
Up to six moving averages can be plotted, each with its own:
Type (SMA, EMA, SMMA, WMA, VWMA, or HMA)
Length, color, and width
Custom source input
The script also adds adaptive color fills between key pairs:
MA1–MA2: short-term momentum
MA4–MA5: mid-term bias
MA5–MA6: long-term trend
Bullish alignment paints green or blue ribbons, while bearish alignment turns them red or pink. The wider the ribbon, the stronger the trend separation.
💡 Why it’s better
Unlike typical ribbon indicators, this version offers full per-line customization, adaptive color fills, and a clean, high-contrast design that makes trend shifts instantly recognizable . It’s optimized for clarity, flexibility, and smooth performance on any market or timeframe.
🎯 Trading ideas
Trend confirmation: Trade only in the direction of the ribbon (green for long, red for short).
Early reversals: Watch for the fastest MAs (MA1–MA2) crossing the mid-term pair (MA4–MA5) as early signals of a trend shift.
Momentum compression: When the ribbon narrows or colors alternate rapidly, it signals consolidation or potential breakout zones.
Pullback entries: Enter trades when price bounces off the outer ribbon layer in the direction of the dominant trend.
Multi-timeframe use: Combine with a higher timeframe ribbon to confirm overall market bias.
📊 Recommended use
Works on all markets and timeframes. Ideal for trend-following, swing trading, and visual confirmation of price structure.
Howard Intraday Edge (JH Edge) - (VWAP + EMA9/EMA21 + RSI)Howard Intraday Edge (JH Edge)
A disciplined intraday trading system by J. Howard.
Uses VWAP, EMA 9/21, RSI, and Optional EMA 200 to confirm trends and momentum.
Automatically plots Clean stop-loss and take profit levels. Built for SPY 0DTE-5DTE options, but works on other liquid tickers.
Focus: 1-3 high probability trades/day with tight risk control.
Best used on 1 or 3 minute timeframes.

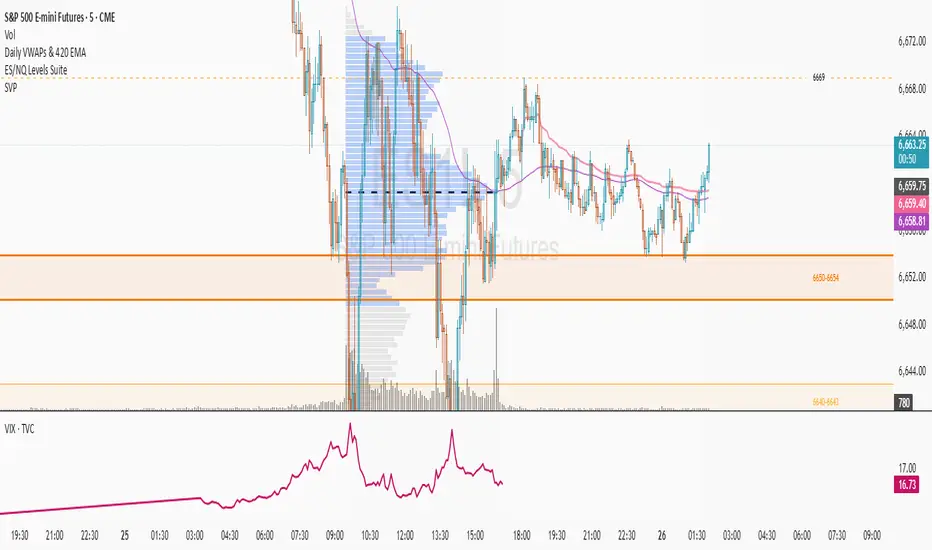
Daily VWAPs & 420 EMAAuto-plots AVWAPS at ETH & RTH of US indice futures open. Additional option for EMA of user's choice.
Multiple Colored Moving AveragesMULTIPLE COLORED MOVING AVERAGES - USER GUIDE
DISCLAIMER
----------
Both the code and this documentation were created heavily using artificial intelligence. I'm lazy...
This indicator was inspired by repo32's "Moving Average Colored EMA/SMA" indicator. *
What is this indicator?
-----------------------
This is a TradingView indicator that displays up to 4 different moving averages on your chart simultaneously. Each moving average can be customized with different calculation methods, colors, and filtering options.
Why would I use multiple moving averages?
-----------------------------------------
- See trend direction across different timeframes at once
- Identify support and resistance levels
- Spot crossover signals between fast and slow MAs
- Reduce false signals with filtering options
- Compare how different MA types react to price action
What moving average types are available?
----------------------------------------
11 different types:
- SMA: Simple average, equal weight to all periods
- EMA: Exponential, more weight to recent prices
- WMA: Weighted, linear weighting toward recent data
- RMA: Running average, smooth like EMA
- DEMA: Double exponential, reduced lag
- TEMA: Triple exponential, even less lag
- HMA: Hull, fast and smooth combination
- VWMA: Volume weighted, includes volume data
- LSMA: Least squares, based on linear regression
- TMA: Triangular, double-smoothed
- ZLEMA: Zero lag exponential, compensated for lag
How do I set up the indicator?
------------------------------
Each MA has these settings:
- Enable/Disable: Turn each MA on or off
- Type: Choose from the 11 calculation methods
- Length: Number of periods (21, 50, 100, 200 are common)
- Smoothing: 0-10 levels of extra smoothing
- Noise Filter: 0-5% to ignore small changes
- Colors: Bullish (rising) and bearish (falling) colors
- Line Width: 1-5 pixels thickness
What does the smoothing feature do?
-----------------------------------
Smoothing applies extra calculations to make the moving average line smoother. Higher levels reduce noise but make the MA respond slower to price changes. Use higher smoothing in choppy markets, lower smoothing in trending markets.
What is the noise filter?
--------------------------
The noise filter ignores small percentage changes in the moving average. For example, a 0.3% filter will ignore any MA movement smaller than 0.3%. This helps eliminate false signals from minor price fluctuations.
When should I use this indicator?
---------------------------------
- Trend analysis: See if market is going up, down, or sideways
- Entry timing: Look for price bounces off MA levels
- Exit signals: Watch for MA slope changes or crossovers
- Support/resistance: MAs often act as dynamic levels
- Multi-timeframe analysis: Use different lengths for different perspectives
What are some good settings to start with?
-------------------------------------------
Conservative approach:
- MA 1: EMA 21 (short-term trend)
- MA 2: SMA 50 (medium-term trend)
- MA 3: SMA 200 (long-term trend)
- Low noise filtering (0.1-0.3%)
Active trading:
- MA 1: HMA 9 (very responsive)
- MA 2: EMA 21 (short-term)
- MA 3: EMA 50 (medium-term)
- Minimal or no smoothing
How do I interpret the colors?
------------------------------
Each MA changes color based on its direction:
- Bullish color: MA is rising (upward trend)
- Bearish color: MA is falling (downward trend)
- Gray: MA is flat or unchanged
What should I look for in crossovers?
-------------------------------------
- Golden Cross: Fast MA crosses above slow MA (bullish signal)
- Death Cross: Fast MA crosses below slow MA (bearish signal)
- Multiple crossovers in same direction can confirm trend changes
- Wait for clear separation between MAs after crossover
How do I use MAs for support and resistance?
---------------------------------------------
- In uptrends: MAs often provide support when price pulls back
- In downtrends: MAs may act as resistance on rallies
- Multiple MAs create support/resistance zones
- Stronger levels where multiple MAs cluster together
Can I use this with other indicators?
-------------------------------------
Yes, it works well with:
- Volume indicators for confirmation
- RSI or MACD for timing entries
- Bollinger Bands for volatility context
- Price action patterns for setup confirmation
What if I get too many signals?
-------------------------------
- Increase smoothing levels
- Raise noise filter percentages
- Use longer MA periods
- Focus on major crossovers only
- Wait for multiple MA confirmation
What if signals are too slow?
-----------------------------
- Reduce smoothing to 0
- Lower noise filter values
- Switch to faster MA types (HMA, ZLEMA, DEMA)
- Use shorter periods
- Focus on the fastest MA only
Which MA types work best in different markets?
----------------------------------------------
Trending markets: EMA, DEMA, TEMA (responsive to trends)
Choppy markets: SMA, TMA, HMA with smoothing (less whipsaws)
High volatility: Use higher smoothing and noise filtering
Low volatility: Use minimal filtering for better responsiveness
Do I need all the advanced features?
------------------------------------
No. Start with basic settings:
- Choose MA type and length
- Set colors you prefer
- Leave smoothing at 0
- Leave noise filter at 0
Add complexity only if needed to improve signal quality.
How do I know if my settings are working?
-----------------------------------------
- Backtest on historical data
- Paper trade the signals first
- Adjust based on market conditions
- Keep a trading journal to track performance
- Be willing to modify settings as markets change
Can I save different configurations?
------------------------------------
Yes, save different indicator templates in TradingView for:
- Different trading styles (scalping, swing trading)
- Different market conditions (trending, ranging)
- Different instruments (stocks, forex, crypto)

Trend Strength Index Long Strategy📈 Trend Strength Index Long Strategy
This strategy combines the Trend Strength Index (TSI) with a Volume-Weighted Moving Average (VWMA) to identify high-probability long entries based on trend momentum and price confirmation.
📊 TSI Calculation : Measures correlation between price and time (bar index) over a user-defined period. Strong TSI values indicate trend momentum.
📏 VWMA Filter : Confirms bullish bias when price is above the VWMA.
🚀 Entry Condition : Long position is triggered when TSI crosses above -0.65 and price is above VWMA.
🔒 Exit Condition : Position is closed when TSI crosses above 0.65.
🎨 Visuals : Gradient fills highlight bullish and bearish zones. VWMA is plotted for trend context.
🧮 TSI Length: Adjustable (default 14)
📐 VWMA Length: Adjustable (default 55)
💸 Commission: 0.1% per trade
📊 Position Size: 75% of equity
⚙️ Slippage: 10 ticks
✅ Best used in trending markets with steady momentum.
⚠️ Avoid in choppy or range-bound conditions.

Slovenský Hybrid (VWAP, Multi MA)Slovenský Hybrid (VWAP, Multi MA) – JS VWAP/MA
Tento indikátor som vytvoril ja, Ján Salma – mentor Akadémie , špeciálne pre slovenský trh. Je navrhnutý tak, aby ho bolo možné používať aj na bezplatnej verzii TradingView a zároveň aby ostal priestor na pridanie ďalších vlastných indikátorov.
👉 Čoskoro pribudne nová verzia, ktorá bude obsahovať ešte viac nástrojov v jednom balíku.
Funkcie a nastavenia:
Indikátor kombinuje viacero kľúčových prvkov technickej analýzy do jedného nástroja:
Multi Moving Averages (MA)
Môžeš zobraziť až 4 rôzne kĺzavé priemery.
Každý MA sa dá zapnúť alebo vypnúť podľa potreby.
Možnosť nastaviť dĺžku periody.
Výber typu: SMA alebo EMA.
Nastavenie zdroja ceny (Close, Open, High, Low, atď.).
Možnosť upraviť farbu a hrúbku čiary pre lepší prehľad.
VWAP (Volume Weighted Average Price)
VWAP sa dá zapnúť alebo vypnúť.
Nastavenie farby a hrúbky čiary.
Výhody indikátora
Jednoduché a prehľadné nastavenia v slovenskom jazyku.
Ideálne pre začiatočníkov aj pokročilých traderov.
Kombinuje viacero indikátorov do jedného, čo šetrí miesto v grafe.
Umožňuje flexibilne prispôsobiť vzhľad podľa vlastného štýlu obchodovania.
________________________________________
✅ Tento nástroj je výbornou pomôckou pre každého, kto sa chce zamerať na čistý graf, prehľadné nastavenia a efektívne využitie TradingView.
Slovak Hybrid (VWAP, Multi MA) – JS VWAP/MA
This indicator was created by Ján Salma – mentor of the Slovak Academy , especially for the Slovak market. It is designed to work even on the free version of TradingView, while keeping space for additional indicators on your chart.
👉 A new version with more tools combined in one indicator is coming soon!
Features and Settings:
Multi Moving Averages (MA)
Up to 4 customizable moving averages.
Each MA can be turned on/off individually.
Choose between EMA or SMA.
Adjustable length, source, line width, and color.
VWAP (Volume Weighted Average Price)
Can be enabled/disabled.
Adjustable line thickness and color.
Benefits:
Simple and intuitive settings in Slovak language.
Great for both beginners and advanced traders.
Combines multiple indicators into one → saves chart space.
Fully customizable look to fit your trading style.
________________________________________
✅ A clean, flexible, and easy-to-use indicator for every trader who wants efficiency and clarity in their charts.

VWMA CandlesVWMA Candles – Smarter Candle Coloring with Volume Awareness
This indicator enhances your chart candles by showing their relationship to the Volume-Weighted Moving Average (VWMA). It visually integrates the VWMA and price action, making it easier to spot momentum shifts, value zones, and price interaction with volume-weighted levels. I saw this indicator idea from TrendSpider on threads and decided to try and make my own. This is my first publicly shared script so go easy on me!
IN ORDER FOR THE COLOR CODING TO WORK PROPERLY, YOU MUST:
GO TO -> CHART SETTINGS -> SYMBOLS AND DISABLE BODIES, BORDERS, AND WICKS.
How it works:
The VWMA is plotted on your chart with a customizable band around it.
Candles change color depending on their position relative to the VWMA and its band:
Green → Price is above the VWMA (bullish bias).
Orange → Price is near or touching the VWMA/band (potential reaction zone).
Red → Price is below the VWMA (bearish bias).
You can choose between custom candles (full plotcandle styling) or simply recolor your existing chart candles with barcolor.
Customization options:
Select how the band is calculated: by % of VWMA, ATR multiple, or Ticks/Points.
Adjust colors separately for candle body, wick, and border.
Choose to show/hide the VWMA line and the band fill.
Fine-tune transparency for a clean look on any chart background.
Why traders use it:
Quickly spot when price is stretched away from the VWMA (overextended conditions).
Identify when candles are interacting with the VWMA (potential support/resistance).
Add volume-sensitivity to your trend analysis compared to standard moving averages.
Authors Note: The default settings work well with stocks on the weekly timeframe, although this can be used on any timeframe. The settings are highly adjustable for you to tune it to your liking.

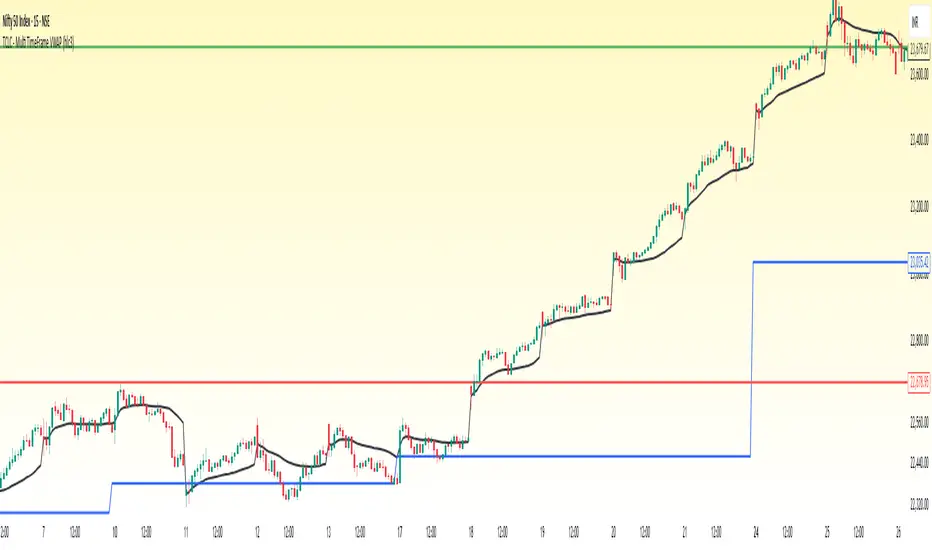
TCLC - Multi TimeFrame VWAPVWAP :
VWAP, or Volume Weighted Average Price, is a trading indicator that represents the average price of a security over a specific period, weighted by the volume of trades at each price level. It is calculated by taking the sum of the product of price and volume and dividing it by the total volume for the period. Essentially, VWAP shows the average price at which most trades occurred, giving more weight to prices with higher trading volumes.
The Indicator Plots the VWAP in Daily, WEEKLY , MONTHLY , YEARLY which helps to gauage the trend where the Volume vs Price exists....
VWAP Suite {Phanchai}VWAP Suite {Phanchai}
Compact, readable, TradingView-friendly.
What is VWAP?
The Volume Weighted Average Price (VWAP) is the average price of a period weighted by traded volume. It’s used as a fair-value reference (mean) and resets at the start of each new period.
Included VWAP Modes
Session — resets each trading day (current session).
Week / Month / Quarter / Year — current calendar periods.
Anchored Week / Month / Quarter / Year — starts at the beginning of the previous completed period.
Rolling 7D / 30D / 90D — rolling windows: today + last 6/29/89 daily sessions.
Important
This suite does not generate buy/sell signals. It provides structure and confluence; decisions remain yours.
Use Cases
Identify fair-value zones / mean-reversion areas.
Plan TP / SL around periodic VWAPs.
Define DCA levels (e.g., anchored to prior week/month).
Gauge trend bias via VWAP slope and reactions.
How to Use
Inputs → VWAP 1..5: Choose the period per slot (Session, Anchored, Rolling, etc.) and toggle Show .
Sources: Select the price source for all VWAPs (default: HLC3).
Global: Line offset (bars) shifts plots visually (does not affect calculations).
Style tab: Adjust per-line colors, thickness, and line style.
Alerts
Price crosses a VWAP (per slot).
VWAP slope turns UP or DOWN (per slot).
Tips & Notes
Volume required: Poor/absent volume (e.g., some FX tickers) can degrade accuracy.
Anchored modes: Start at the prior period’s open; values appear only after that timestamp.
Rolling modes: Use completed daily sessions (including today).
Clutter control: If labels crowd, increase Line offset or hide unneeded slots.
Confluence: Combine with market structure, liquidity zones, or momentum filters for stronger context.
Built for clear VWAP workflows. Trade safe!

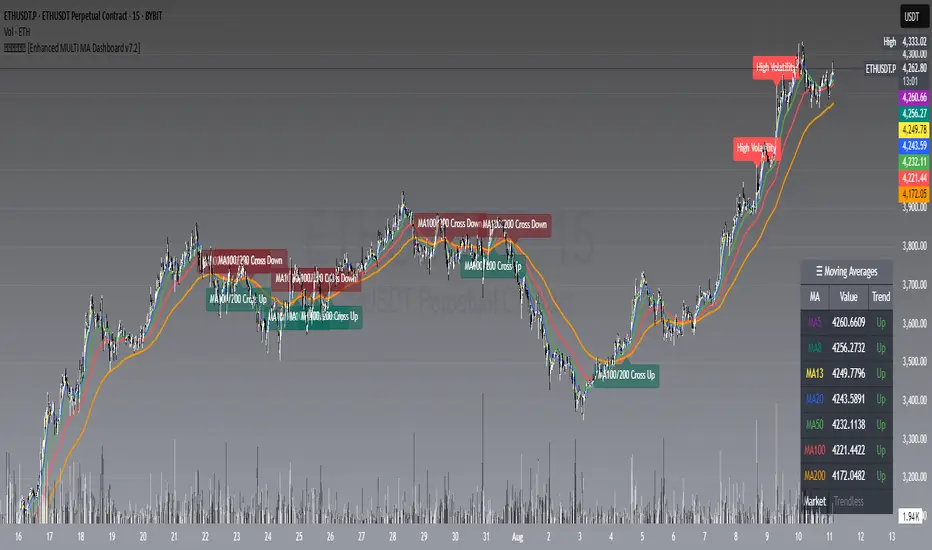
𝙷✪𝚕𝚍𝚎𝚖 [Enhanced MULTI MA Dashboard v7.2]
𝙷✪𝚕𝚍𝚎𝚖 — Enhanced MULTI MA Dashboard v7.2
What it does
A complete moving-average control center that overlays up to seven MAs (5/8/13/20/50/100/200), draws dynamic MA clouds between consecutive pairs, tags crossover events (optional), and shows a compact on-chart dashboard with each MA’s current value and slope-based trend (Up/Down/Flat). It also detects Trendless and High-Volatility regimes to help you adapt your strategy.
Key Features
7 Configurable Moving Averages
Turn each MA on/off individually (5, 8, 13, 20, 50, 100, 200).
Choose type per MA: SMA, EMA, WMA, HMA, VWMA.
Set lengths freely and color each line.
Works on any symbol and timeframe; source selectable (close/open/high/low, etc.).
☁︎ MA Clouds (optional)
Shaded cloud between each consecutive pair (5–8, 8–13, 13–20, 20–50, 50–100, 100–200).
Cloud auto-colors toward the currently dominant MA (above/below) with adjustable transparency.
Quick visual read of short- vs long-side control and compression/expansion.
⚠️ Market Regime Detection
Trendless: measures how tightly short MAs (5, 8, 13) are clustered using std-dev % of their values; user-set threshold.
High Volatility: flags when ATR(Length) > ATR SMA × Multiplier.
Optional background tint and chart labels when regimes flip.
Dashboard cell shows Trending / Trendless / High Volatility with color coding.
➕ Crossover Signal Labels (fully granular)
Toggle labels for any pair you care about (e.g., 5/8, 8/20, 50/200, etc.).
Separate styles/colors for Cross Up and Cross Down; adjustable label size.
Great for momentum shifts, golden/death cross style monitoring, or timing add/reduce decisions.
(Note: these are visual labels; no alertconditions are defined.)
📊 On-Chart MA Dashboard
Compact, movable table (Top/Bottom/Middle, Left/Right/Center).
Columns: MA name, current value, trend direction (derived from MA slope).
Customizable text size, header text, colors, background, optional alternating row colors, and border styling.
Auto-adds a Market row when regime detection is enabled.
How to Use
1 Pick your data source (close by default) and switch on the MAs you care about.
2 Choose MA types and lengths to match your system (e.g., EMA for reactivity, SMA for smoothing).
3 Enable MA Clouds to see compression/expansion and dominance at a glance.
4 Set regime thresholds:
Lower Trendless Threshold → stricter definition of chop.
Raise ATR Multiplier → fewer, “truer” high-volatility flags.
5 Activate specific crossovers that fit your playbook (e.g., 5/20 for short-term momentum, 50/200 for cycle turns).
6 Position and style the dashboard so it stays readable on your layout.
Signal & Reading Guide
Trend column (Up/Down/Flat) reflects the slope of each MA (today vs previous bar).
Cloud flips (color dominance changes) often precede or confirm crossover labels.
Trendless suggests range conditions; consider mean-reversion tools or stand aside.
High Volatility calls for wider stops or volatility-aware sizing; breakouts can travel farther.
Disclaimer
This tool is for education and visualization. It does not constitute financial advice and is not a buy/sell system by itself. Always validate signals within your broader risk-managed plan.

Moving Volume-Weighted Avg Price, % Channel, BBsThis script includes:
- Moving Volume-Weighted Average Price line.
- User-defined % band above and below, very useful for "breakout" signals, and mentally adjusting to the magnitude of price swings when viewing an automatic scale on the price axis.
- Volume-Weighted Bollinger Bands, which are more sensitive to volume.
More detail:
- This is like TV's basic VWAP in concept, except the major flaw in that is that it has reset periods that you can't override, and the volume is cumulative until the next hard reset. The 'reset' is OK for securities trading, that resets every day anyway. But not for crypto - and not if/when securities trading goes 24/7. Also, the denominator accumulating over the entire period is also *not* OK, because then what is shown means something different as the day progresses - which kind of makes it useless. In other words, it starts out very sensitive to volume, and gets progressively more numb to it as they day progresses, and starts flattening out.
- This fixes both problems, by using a user-definable moving window for the average. Essentially combining SMA with volume-weighting.
- You may also find an invaluable trading aid, in the % bands above and below.
- What can optionally be shown is standard deviation bands, aka Bollinger bands. The advantage over regular BB is that it's volume-weighted. Since it is already calculated on a moving average, the period for the standard deviation has been shortened by default, and the magnitude increased, to better approximate regular Bollinger Bands - but it's still more responsive to volume.
