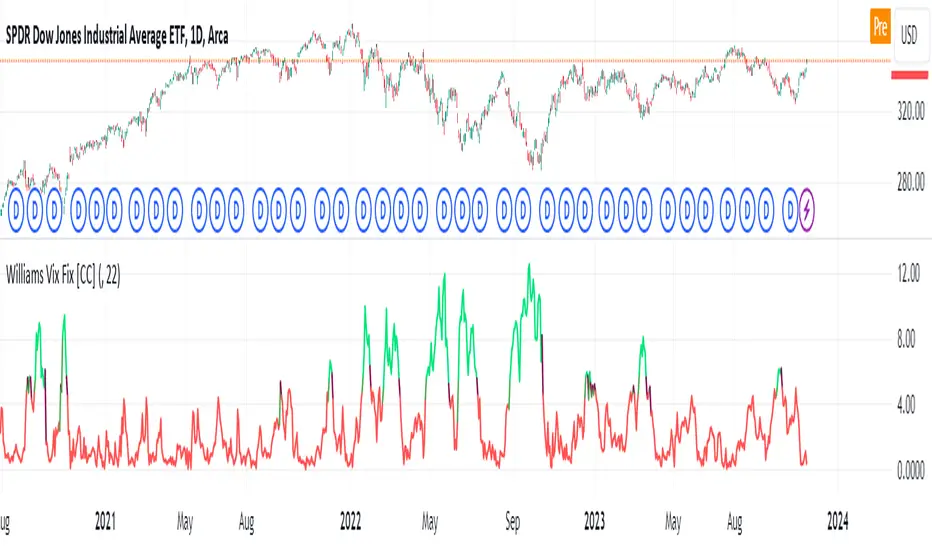
Williams Vix Fix [CC]The Vix Fix indicator was created by Larry Williams and is one of my giant backlog of unpublished scripts which I'm going to start publishing more of. This indicator is a great synthetic version of the classic Volatility Index and can be useful in combination with other indicators to determine when to enter or exit a trade due to the current volatility. The indicator creates this synthetic version of the Volatility Index by a fairly simple formula that subtracts the current low from the highest close over the last 22 days and then divides that result by the same highest close and multiplies by 100 to turn it into a percentage. The 22-day length is used by default since there is a max of 22 trading days in a month but this formula works well for any other timeframe. By itself, this indicator doesn't generate buy or sell signals but generally speaking, you will want to enter or exit a trade when the Vix fix indicator amount spikes and you get an entry or exit signal from another indicator of your choice. Keep in mind that the colors I'm using for this indicator are only a general idea of when volatility is high enough to enter or exit a trade so green colors mean higher volatility and red colors mean low volatility. This is one of the few indicators I have written that don't recommend to buy or sell when the colors change.
This was a custom request from one of my followers so please let me know if you guys have any other script requests you want to see!
Williams %R (%R)
Oops!Oops! is based on an overemotional response, then a quick reversal of the concomitant overreaction of price. The overreaction we are looking for to give us a buy signal is an opening that is below the previous day's low. The entry comes when, following the lower open, price then rallies back to the previous day's low (selling pressures have been abated and a market rally should follow). A sell signal is just the opposite. We will be looking for an open greater than the prior day's high. Our entry then comes from price falling back to the prior high, giving us a strong short-term suggestion of lower prices to come.

EUR/USD 45 MIN Strategy - FinexBOTThis strategy uses three indicators:
RSI (Relative Strength Index) - It indicates if a stock is potentially overbought or oversold.
CCI (Commodity Channel Index) - It measures the current price level relative to an average price level over a certain period of time.
Williams %R - It is a momentum indicator that shows whether a stock is at the high or low end of its trading range.
Long (Buy) Trades Open:
When all three indicators suggest that the stock is oversold (RSI is below 25, CCI is below -130, and Williams %R is below -85), the strategy will open a buy position, assuming there is no current open trade.
Short (Sell) Trades Open:
When all three indicators suggest the stock is overbought (RSI is above 75, CCI is above 130, and Williams %R is above -15), the strategy will open a sell position, assuming there is no current open trade.
SL (Stop Loss) and TP (Take Profit):
SL (Stop Loss) is 0.45%.
TP (Take Profit) is 1.2%.
The strategy automatically sets these exit points as a percentage of the entry price for both long and short positions to manage risks and secure profits. You can easily adopt these inputs according to your strategy. However, default settings are recommended.

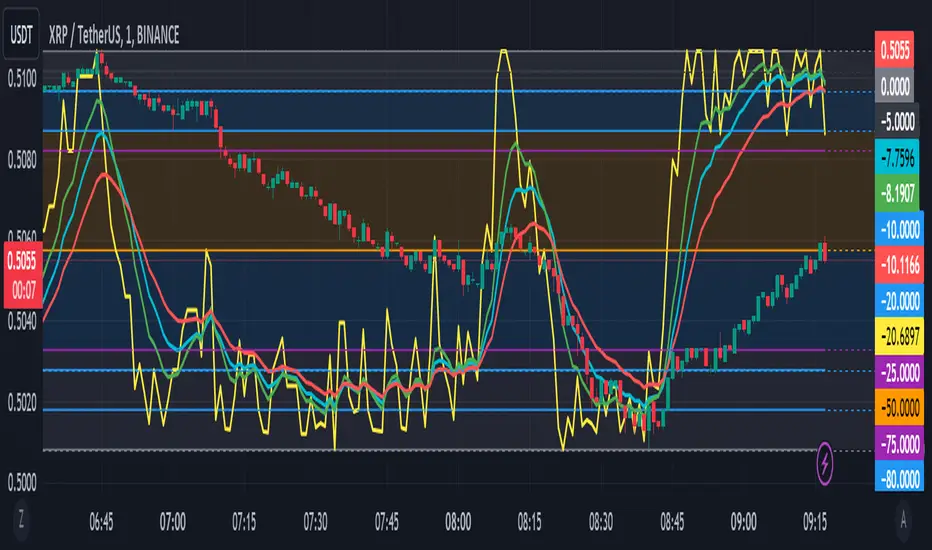
Williams %R with EMA'sThe provided Pine Script code presents a comprehensive technical trading strategy on the TradingView platform, incorporating the Williams %R indicator, exponential moving averages (EMAs), and upper bands for enhanced decision-making. This strategy aims to help traders identify potential buy and sell signals based on various technical indicators, thereby facilitating more informed trading decisions.
The key components of this strategy are as follows:
**Williams %R Indicator:** The Williams %R, also known as the "Willy," is a momentum oscillator that measures overbought and oversold conditions. In this code, the Williams %R is calculated with a user-defined period (default 21) and smoothed using an exponential moving average (EMA).
**Exponential Moving Averages (EMAs):** Two EMAs are computed on the Williams %R values. The "Fast" EMA (default 8) responds quickly to price changes, while the "Slow" EMA (default 21) provides a smoother trend-following signal. Crossovers and divergences between these EMAs can indicate potential buy or sell opportunities.
**Candle Color Detection:** The code also tracks the color of candlesticks, distinguishing between green (bullish) and red (bearish) candles. This information is used in conjunction with other indicators to identify specific trading conditions.
**Additional Upper Bands:** The script introduces upper bands at various levels (-5, -10, -20, -25) to create zones for potential buy and sell signals. These bands are visually represented on the chart and can help traders gauge the strength of a trend.
**Alert Conditions:** The code includes several alert conditions that trigger notifications when specific events occur, such as %R crossing certain levels, candle color changes within predefined upper bands, and EMA crossovers.
**Background Highlighting:** The upper bands and the zero line are visually highlighted with different colors, making it easier for traders to identify critical price levels.
This code is valuable for traders seeking a versatile technical strategy that combines multiple indicators to improve trading decisions. By incorporating the Williams %R, EMAs, candlestick analysis, and upper bands, it offers a holistic approach to technical analysis. Traders can customize the parameters to align with their trading preferences and risk tolerance. The use of alerts ensures that traders are promptly notified of potential trade setups, allowing for timely execution and risk management. Overall, this code serves as a valuable tool for traders looking to make more informed decisions in the dynamic world of financial markets.
[TTI] MarketSmith & IBD Style Model Stock Quarters 📜 ––––HISTORY & CREDITS––––
The MarketSmith & IBD Style Model Stock Quarters another Utility indicator is an original creation by TintinTrading inspired by Investor's Business Daily and William O'Neil style of presenting information. While going through the Model Stocks that IBD has been publishing, I realized that I wanted to see the exam same Quarterly presentation on the time axis in order to compare William O'Neil notes better with my own notes from Tradingview. The script is simple and could help you if you study the CANSLIM methodology.
🦄 –––UNIQUENESS–––
The distinctiveness of this indicator lies in its ability to visually delineate stock quarters directly on the price chart. It serves as a handy tool for traders who adopt a quarterly review of stock performance, in line with MarketSmith and IBD's analysis frameworks.
🛠️ ––––WHAT IT DOES––––
Quarter Marking : Draws a black line at the beginning of each financial quarter (January, April, July, and October).
Quarter Labeling : Places a label at the close of the last month in a quarter, indicating the upcoming quarter with its abbreviation and the last two digits of the year.
💡 ––––HOW TO USE IT––––
👉Installation: Add the indicator to your TradingView chart by searching for " MarketSmith & IBD Style Model Stock Quarters" in the indicator library.
👉Add to New Pane and squash the Pane Length: I add the indicator to a new pane under the price and volume charts and squash the height of the pane so that it looks exactly like the MarketSmith visuals.
👉Visual Cues:
Look for the black lines marking the start of a new quarter.
Observe the labels indicating the upcoming quarter and year, positioned at the close of the last month in a quarter.
👉Interpretation: Use these quarterly markers to align your trading strategies with quarterly performance metrics or to conduct seasonal analysis.
👉Settings: The indicator does not require any user-defined settings, making it straightforward to use.

[TTI] Price confirmation indicator📜 ––––HISTORY & CREDITS––––
The Price Confirmation Indicator is an innovative tool developed by TintinTrading to help his students learn to interpret Price + Volume moves. It is designed to provide traders with a visual cue for price movement confirmation based on both price direction and trading volume. I got the idea from watching Daivd Ryan, how he explains that he looks at volume first before looking at the price of a stock.
🦄 –––UNIQUENESS–––
What sets this indicator apart is its dual analysis approach and easy interpretation: it not only evaluates price movements but also takes trading volume into account. The indicator's color-coded bars are dynamically adjusted based on the volume difference from a 50-day Simple Moving Average (SMA) of the volume. This offers traders an intuitive way to gauge both the market's direction and its strength.
🛠️ ––––WHAT IT DOES––––
The Price Confirmation Indicator performs the following functions:
👉Price Movement: Determines whether each trading day is an 'Up Day' or a 'Down Day' based on the closing price.
👉Volume Analysis: Calculates the 50-day SMA of trading volume and identifies the volume difference in percentage terms.
👉Transparency Adjustment: Dynamically adjusts the transparency of colored bars based on the volume difference.
👉Bar Coloring: Colors the bars blue for 'Up Days' and purple for 'Down Days', with the transparency indicating the strength of the volume.
Transparency Tresholds:
Full color (no transparency 0%) - Volume is greater than 40% compared to the 50DSMA Volume
Strong color (little transparency 20%) - Volume is between 20% and 40% greater than the 50DSMA Volume
Noticable color (moderate transparency 40%) - Volume is between 0% and 20% greater than the 50DSMA Volume
Negligable color (strong transparency 60%) - Volume is light and is less than 50DSMA Volume with less than 20% lower.
Weak color (very strong transparency 80%) - Volume is below 50DSMA, with between 40% and 20% lower.
Very weak color (max transparency 90%) - Volume is below 50DSMA, with between -40% and -80% lower.
Alarming weak color (color is orange) - Volume is noticably light - this generally signals velocity contraction before a breakout.
💡 ––––HOW TO USE IT––––
Installation: Search for " Price Confirmation Indicator" in TradingView’s indicator library and add it to your chart.
Settings:
Price Up Color: Customize the color for 'Up Days'.
Price Down Color: Customize the color for 'Down Days'.
Interpretation:
Blue bars signify 'Up Days', and their transparency indicates the strength of the volume.
Purple bars represent 'Down Days', with transparency again indicating volume strength.
Orange bars signify extremely low volume days.
Volume Transparency: The less transparent the bar, the stronger the volume, aiding in confirming the price direction.
The indicator is a great tool for newer traders to get in the habit of reading Price & Volume together!

[TTI] Closing Range Indicator📜 ––––HISTORY & CREDITS––––
This Pine Script Utility indicator, titled " Closing Range Indicator," is designed and developed by TintinTrading but inspired by the teaching of Investor's Business Daily (IBD) and William O'Neil. It aims to help traders identify the closing range of a given timeframe, either daily or weekly.
🦄 –––UNIQUENESS–––
The unique feature of this indicator lies in its ability to simulate a functionality of Closing Range calculation based on hovering of the mouse over the close. It employs a conditional display that allows the user to set the indicator as 'invisible' without removing it from the chart and hence provides a numerical closing range value when hovering over the indicator.
🛠️ ––––WHAT IT DOES––––
The Closing Range Indicator calculates the closing range of a trading bar in terms of percentages. It computes the difference between the closing price and the low price of the bar, and then divides it by the range of the bar.
A stock that closes on the high would display 100%
A stock that closes on the low would display 0%
Generally, the higher the percentage the more bullish the close but there are exceptions to this rule.
The indicator can operate on two timeframes:
Daily : Computes the closing range based on the daily high, low, and closing prices.
Weekly : Computes the closing range based on the weekly high, low, and closing prices. If you enable the weekly it will show the weekly close on all daily timeframes. Meaning that if the week Closing range is 54.15% on Friday, it will show the value 54.15% for all days prior to Friday from the same week.
The indicator places a label at the close of each bar, with the label's tooltip showing the calculated closing range percentage. I generally hide the label and just reference the tooltip calculation with a a hoover on top of the bar.
💡 ––––HOW TO USE IT––––
Installation: Add the indicator to your TradingView chart by searching for " Closing Range Indicator" in the indicator library.
Reorder: Reorder the indicator so that it sits as the first indicator (even above the price) on the Pane. This will make sure that you always trigger the tooltip functionality.
Go to Settings:
Timeframe: Choose between daily ('D') and weekly ('W') timeframes from the settings.
Visibility: Enable the 'Make Invisible' option if you want the indicator to be hidden.
Interpretation:
A higher percentage indicates that the closing price is closer to the high of the range, signaling bullish sentiment.
A lower percentage indicates bearish sentiment.
Tooltip: Hover over the label to view the closing range in percentage terms.

12&50 RSI + %R2/50 RSI+ %R is a PineScript indicator that combines two popular technical indicators, the Relative Strength Index (RSI) and the Williams %R. The indicator plots two lines, K and D, which represent the smoothed moving averages of the RSI. It also plots the RSI with a 60-period length and the Williams %R with a 21-period length. The indicator can be used to identify overbought and oversold conditions, as well as potential reversals.
Here are some of the key features of the script:
It uses two different RSI lengths to provide a more comprehensive view of the market.
It plots the Williams %R, which can be used to identify overbought and oversold conditions.
It includes overbought and oversold levels to help traders identify potential entry and exit points.

Ultimate Balance StrategyThe Ultimate Balance Oscillator Strategy harnesses the power of the Ultimate Balance Oscillator to deliver a comprehensive and disciplined approach to trading. By combining the insights of the Rate of Change (ROC), Relative Strength Index (RSI), Commodity Channel Index (CCI), Williams Percent Range, and Average Directional Index (ADX) from TradingView, this strategy offers traders a systematic way to navigate the markets with precision.
The core principle of this strategy lies in its ability to identify optimal entry and exit points based on the movement of the Ultimate Balance Oscillator. When the oscillator line crosses below the 0.75 level, a buy signal is generated, indicating a potential opportunity for a bullish trend reversal. Conversely, when the oscillator line crosses above the 0.25 level, it triggers an exit signal, suggesting a possible end to a bullish trend.
Key Features:
1. Objective Market Analysis: The Ultimate Balance Oscillator Strategy provides a disciplined and objective approach to market analysis. By relying on the quantified insights of multiple indicators, it helps traders cut through market noise and focus on key signals, improving decision-making and reducing emotional biases.
2. Enhanced Timing and Precision: This strategy's entry and exit signals are based on the specific thresholds of the Ultimate Balance Oscillator. By waiting for confirmation through the crossing of these levels, traders can potentially enter trades at opportune moments and exit with greater precision, maximizing profit potential and minimizing risk exposure.
3. Customizability and Adaptability: The strategy offers flexibility, allowing traders to customize the parameters to fit their preferred trading style and timeframes. Whether you're a short-term trader or a long-term investor, the Ultimate Balance Oscillator Strategy can be adjusted to suit your specific needs, making it adaptable to various market conditions.
4. Real-time Alerts: Stay informed and never miss a potential trade opportunity with the strategy's built-in alert system. Set personalized alerts for buy and exit signals to receive timely notifications, ensuring you're always aware of the latest developments in the market.
5. Backtesting and Optimization: Before applying the strategy to live trading, it's recommended to conduct thorough backtesting and optimization. By testing the strategy's performance over historical data and fine-tuning the parameters, you can gain insights into its strengths and weaknesses, enabling you to make informed adjustments and increase its effectiveness.
Trading involves risk. Use the Ultimate Balance Oscillator Strategy at your own discretion. Past performance is not indicative of future results.

Ultimate Balance OscillatorIntroducing the Ultimate Balance Oscillator: A Powerful Trading Indicator
Built upon the renowned Rate of Change (ROC), Relative Strength Index (RSI), Commodity Channel Index (CCI), Williams Percent Range, and Average Directional Index (ADX) from TradingView, this indicator equips traders with an unparalleled understanding of market dynamics.
What sets the Ultimate Balance Oscillator apart is its meticulous approach to weighting. Each component is assigned a weight that reflects its individual significance, while carefully mitigating the influence of highly correlated signals. This strategic weighting methodology ensures an unbiased and comprehensive representation of market sentiment, eliminating dominance by any single indicator.
Key Features and Benefits:
1. Comprehensive Market Analysis: The Ultimate Balance Oscillator provides a comprehensive view of market conditions, enabling traders to discern price trends, evaluate momentum shifts, identify overbought or oversold levels, and gauge the strength of prevailing trends. This holistic perspective empowers traders to make well-informed decisions based on a thorough understanding of the market.
2. Enhanced Signal Accuracy: With its refined weighting approach, the Ultimate Balance Oscillator filters out noise and emphasizes the most relevant information. This results in heightened signal accuracy, providing traders with a distinct advantage in identifying optimal entry and exit points. Say goodbye to unreliable signals and welcome a more precise and dependable trading experience.
3. Adaptability to Various Trading Scenarios: The Ultimate Balance Oscillator transcends the constraints of specific markets or timeframes. It seamlessly adapts to diverse trading scenarios, accommodating both short-term trades and long-term investments. Traders can customize this indicator to suit their preferred trading style and effortlessly navigate ever-changing market conditions.
4. Simplicity and Ease of Use: The Ultimate Balance Oscillator simplifies trading analysis by providing a single line on the chart. Its straightforward interpretation and seamless integration into trading strategies make decision-making effortless. By observing bullish or bearish crossovers with the moving average, recognizing overbought or oversold levels, and tracking the overall trend of the oscillator, traders can make well-informed decisions with confidence.
5. Real-time Alerts: Stay ahead of the game with the Ultimate Balance Oscillator's customizable alert system. Traders can set up personalized alerts for bullish or bearish crossovers, breaches of overbought or oversold thresholds, or any specific events that align with their trading strategy. Real-time notifications enable timely action, ensuring traders never miss lucrative trading opportunities.
The Ultimate Balance Oscillator is a robust trading companion, empowering traders to make shrewd and calculated decisions. Embrace its power and elevate your trading endeavors to new heights of precision and success. Discover the potential of the Ultimate Balance Oscillator and unlock a world of trading possibilities.

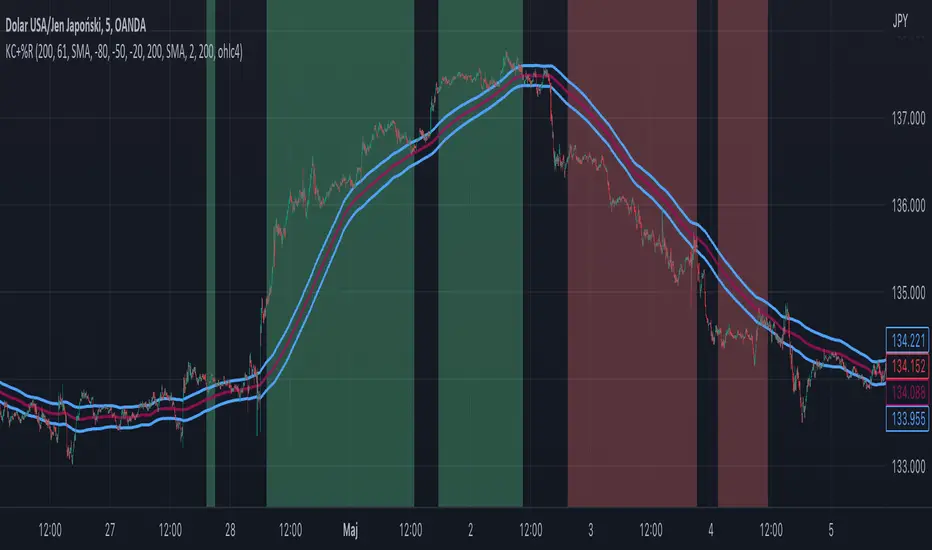
Williams %R + Keltner chanells - indicator (AS)1)INDICATOR ---This indicator is a combination of Keltner channels and Williams %R.
It measures trend using these two indicators.
When Williams %R is overbought(above upper line (default=-20)) and Keltner lower line is below price indicator shows uptrend (green).
When Williams %R is oversold(below lower line (default=-80)) and Keltner upper line is above price indicator shows downtrend (red) .
Can be turned into a strategy quickly.
2) CALCULATIONS:
Keltner basis is a choosen type of moving average and upper line is basis + (ATR*multiplier). Same with lower but minus instead of plus so basiss – (ATR*multiplier)
Second indicator
Williams %R reflects the level of the close relative to the highest high for the lookback period
3)PLS-HELP-----Looking for tips, ideas, sets of parameters, markets and timeframes, rules for strategy -------OVERALL -every advice you can have
4) SIGNALS-----buy signal is when price is above upper KC and Williams %R is above OVB(-20). Short is exactly the other way around
5) CUSTOMIZATION:
-%R-------LENGTH/SMOOTHING/TYPE SMOOTHING MA
-%R-------OVS/MID/OVB -(MID-no use for now)
-KC -------LENGTH/TYPE OF MAIN MA
-KC-------MULTIPLIER,ATR LENGTH
-OTHER--LENGTH/TYPE OF MA - (for signal filters, not used for now)
-OTHER--SOURCE -src of calculations
-OTHER--OVERLAY - plots %R values for debugging etc(ON by default)
6)WARNING - do not use this indicator on its own for trading
7)ENJOY
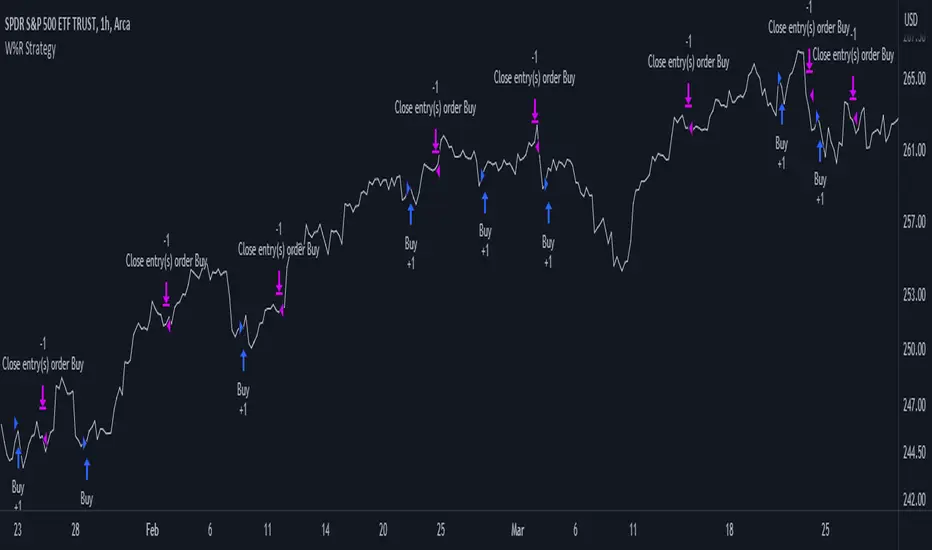
Williams %R Strategy
The Williams %R Strategy is a trading approach that is based on the Williams Percent Range indicator, available on the TradingView platform.
This strategy aims to identify potential overbought and oversold conditions in the market, providing clear buy and sell signals for entry and exit.
The strategy utilizes the Williams %R indicator, which measures the momentum of the market by comparing the current close price with the highest high and lowest low over a specified period. When the Williams %R crosses above the oversold level, a buy signal is generated, indicating a potential upward price movement. Conversely, when the indicator crosses below the overbought level, a sell signal is generated, suggesting a possible downward price movement.
Position management is straightforward with this strategy. Upon receiving a buy signal, a long position is initiated, and the position is closed when a sell signal is generated. This strategy allows traders to capture potential price reversals and take advantage of short-term market movements.
To manage risk, it is recommended to adjust the position size based on the available capital. In this strategy, the position size is set to 10% of the initial capital, ensuring proper risk allocation and capital preservation.
It is important to note that the Williams %R Strategy should be used in conjunction with other technical analysis tools and risk management techniques. Backtesting and paper trading can help evaluate the strategy's performance and fine-tune the parameters before deploying it with real funds.
Remember, trading involves risks, and past performance is not indicative of future results. It is always advised to do thorough research, seek professional advice, and carefully consider your financial goals and risk tolerance before making any investment decisions.
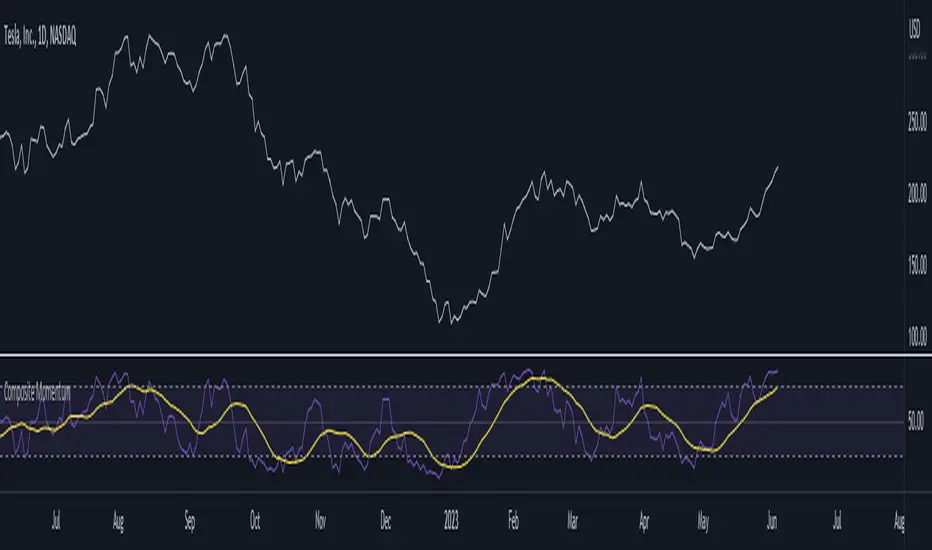
Composite MomentumComposite Momentum Indicator - Enhancing Trading Insights with RSI & Williams %R
The Composite Momentum Indicator is a powerful technical tool that combines the Relative Strength Index (RSI) and Williams %R indicators from TradingView. This unique composite indicator offers enhanced insights into market momentum and provides traders with a comprehensive perspective on price movements. By leveraging the strengths of both RSI and Williams %R, the Composite Momentum Indicator offers distinct advantages over a simple RSI calculation.
1. Comprehensive Momentum Analysis:
The Composite Momentum Indicator integrates the RSI and Williams %R indicators to provide a comprehensive analysis of market momentum. It takes into account both the strength of recent price gains and losses (RSI) and the relationship between the current closing price and the highest-high and lowest-low price range (Williams %R). By combining these two momentum indicators, traders gain a more holistic view of market conditions.
2. Increased Accuracy:
While the RSI is widely used for measuring overbought and oversold conditions, it can sometimes generate false signals in certain market environments. The Composite Momentum Indicator addresses this limitation by incorporating the Williams %R, which focuses on the price range and can offer more accurate signals in volatile market conditions. This combination enhances the accuracy of momentum analysis, allowing traders to make more informed trading decisions.
3. Improved Timing of Reversals:
One of the key advantages of the Composite Momentum Indicator is its ability to provide improved timing for trend reversals. By incorporating both RSI and Williams %R, traders can identify potential turning points more effectively. The Composite Momentum Indicator offers an early warning system for identifying overbought and oversold conditions and potential trend shifts, helping traders seize opportunities with better timing.
4. Enhanced Divergence Analysis:
Divergence analysis is a popular technique among traders, and the Composite Momentum Indicator strengthens this analysis further. By comparing the RSI and Williams %R within the composite calculation, traders can identify divergences between the two indicators more easily. Divergence between the RSI and Williams %R can signal potential trend reversals or the weakening of an existing trend, providing valuable insights for traders.
5. Customizable Moving Average:
The Composite Momentum Indicator also features a customizable moving average (MA), allowing traders to further fine-tune their analysis. By incorporating the MA, traders can smooth out the composite momentum line and identify longer-term trends. This additional layer of customization enhances the versatility of the indicator, catering to various trading styles and timeframes.
The Composite Momentum Indicator, developed using the popular TradingView indicators RSI and Williams %R, offers a powerful tool for comprehensive momentum analysis. By combining the strengths of both indicators, traders can gain deeper insights into market conditions, improve accuracy, enhance timing for reversals, and leverage divergence analysis. With the added customization of the moving average, the Composite Momentum Indicator provides traders with a versatile and effective tool to make more informed trading decisions.
Candle Combo ScreenerThe Candle Combo Screener allows you to see candlestick combinations for up to 5 different tickers at the same time . If one of the candle combination is detected the corresponding cell will be highlighted to alert you.
Candle Combinations Detected
Bullish Kicker
Bullish & Bearish Oops Reversals
Open Equals High / Low
Inside Day
Select any 5 tickers. Colors and table settings are fully customizable to fit your style.
Bullish Kicker
The opening price of the current candle gaps up above the body of the prior day's candle AND the prior day's candle close was less than the open.
Oops Reversals
Bullish: Price opens below the prior day’s low and closes above.
Bearish: Price opens above the prior day's high and closes below.
Open Equals High / Low
The current candles opening price is equal to either the high or low of the day.
Inside Day
The current candles high and low are contained within the prior day's high and low.

WillyCycle Oscillator&DoubleMa/ErkOzi/version 2This oscillator can be customized by adjusting the length of the Willy period, the length of Willy's EMA, and the upper and lower bands. The upper and lower bands help traders identify overbought and oversold conditions.
The WillyCycle Oscillator is a technical analysis tool used to measure the momentum of an asset and identify overbought and oversold conditions based on the price range of a specific period and calculating the percentage of the closing price in that range. The WillyCycle Oscillator consists of two main components: Willy and Willy's EMA. The Willy component is the percentage calculation of the asset's price range, and Willy's EMA is the exponential moving average of the Willy component. Willy's EMA is used to smooth out the Willy component and make it easier to identify trends.
*** When the oscillator is above the 80 level, it indicates that the asset is overbought, and when it is below the 20 level, it indicates that the asset is oversold. Traders can use these levels as a guide for buying and selling signals.
***Traders can also use the WillyCycle Oscillator to identify trend reversals. When the oscillator rises above the 50 level, it signals a potential uptrend, and when it falls below the 50 level, it signals a potential downtrend.
***I have added a smoothed line option to the WillyCycle Oscillator, which allows traders to see a more smoothed version of the oscillator. This option can be enabled by setting the 'smoothed' input to true. The default value for the smoothed line is 15.
***We have also changed the value range of the WillyCycle Oscillator from -100 to 100 to 0 to 100. This change was made to make the oscillator more user-friendly and easier to read.
In conclusion, the WillyCycle Oscillator is a versatile tool that can help traders identify potential trading opportunities and trend reversals. Traders can customize the oscillator to fit their trading style and preferences. Adding a smoothed line and changing the value range can enhance the user experience and make the oscillator easier to use.

WillyCycle Oscillator&DoubleMa/ErkOzi/"This code creates a technical analysis indicator used to calculate and visualize the WillyCycle oscillator and double moving average indicators on the price of a financial asset. The functionality can be summarized as follows:
*Calculate the WillyCycle oscillator: The WillyCycle is an oscillator calculated based on the highest and lowest values of an asset. This oscillator is used to measure overbought or oversold conditions of the asset.
*Calculate the double moving average: The double moving average helps determine trends by calculating the short-term and long-term moving averages of asset prices.
*Use the WillyCycle oscillator and double moving average indicators together: The WillyCycle oscillator is combined with the double moving averages to provide a clearer indication of overbought and oversold conditions.
*Visualize the indicator with color coding: The indicator is color-coded to show overbought and oversold conditions. Additionally, line and background colors are changed to make the indicator more readable.
Many parameters can be adjusted on the indicator: The indicator can be customized and modified by the user. For example, the period of the WillyCycle oscillator and the lengths of the double moving averages can be adjusted."
The strategy is based on two indicators - the WillyCycle oscillator and the double moving average. The WillyCycle oscillator measures overbought and oversold conditions of the asset based on its highest and lowest values. The double moving average calculates short-term and long-term moving averages of the asset's price, which can help identify trends.
The WillyCycle oscillator and the double moving average are combined in this strategy to provide a clearer indication of overbought and oversold conditions. When the WillyCycle oscillator indicates that the asset is oversold and the short-term moving average crosses above the long-term moving average, it may signal a buy opportunity. Conversely, when the WillyCycle oscillator indicates that the asset is overbought and the short-term moving average crosses below the long-term moving average, it may signal a sell opportunity.
To make it easier for traders to read and interpret the indicator, color-coding is used to indicate overbought and oversold conditions. The user can also customize the indicator by adjusting parameters such as the period of the WillyCycle oscillator and the lengths of the double moving averages.
*ıt provides successful buy and sell signals for price reversals.
*You can open counter trades in overbought and oversold areas by following the averages.

AII - Average indicator of indicatorsThis Pine Script for TradingView is a technical analysis tool that visualizes the average of several popular indicators in the trading world. The indicators included are the RSI (Relative Strength Index), RVI (Relative Vigor Index), Stochastic RSI, Williams %R, relative MACD (ranging from 0 to 100), and Bollinger Bands price distance from 0 to 100. The script uses the "input" function to customize the length of the indicators and the "plot" function to display the results on the chart. In addition, options are included to turn off certain indicators and change the line colors if the user desires. All indicators can also be activated independently, allowing the user to see only the indicators they want. It is also mentioned that the script will be improved in the future to offer a better user experience. The calculated values are calculated with the default EMA of 14. Overall, this script is an excellent option for those looking for a combined view of several important indicators for making trading decisions.

CM_Williams_Vix_Fix - Market Top and Bottom with multi-timeframeThis is a modification of CM_Williams_Vix_Fix indicator to include both market tops and bottoms with multi-timeframe support. The original indicator only finds market bottoms.
All credits go to the original author ChrisMoody.
Original script link
Working:
The histogram above 0 signifies the trend of market going UP and the histogram below 0 signifies the trend of market going DOWN.
The histogram bar is calculated using "LookBack Period Standard Deviation High" number of candles. A threshold is calculated using bollinger bands and based on percentile of "Look Back Period Percentile High" number of candles.
If the histogram bar above 0 crosses the up threshold then we have market top which is signified by histogram bar having the color green. If the histogram bar below 0 crosses the down threshold then we have market bottom which is signified by histogram bar having the color red.
The market tops and bottoms can also be calculated across multiple timeframes.
Sample usage:
Suppose the market is in an uptrend and the indicator displays red market bottom bar, this might be an indication that the market has reached the end of a pullback. We can use additional indicators like stochastic or rsi to get additional confluence.
This indicator does not repaint but you need to wait for the candle to close.

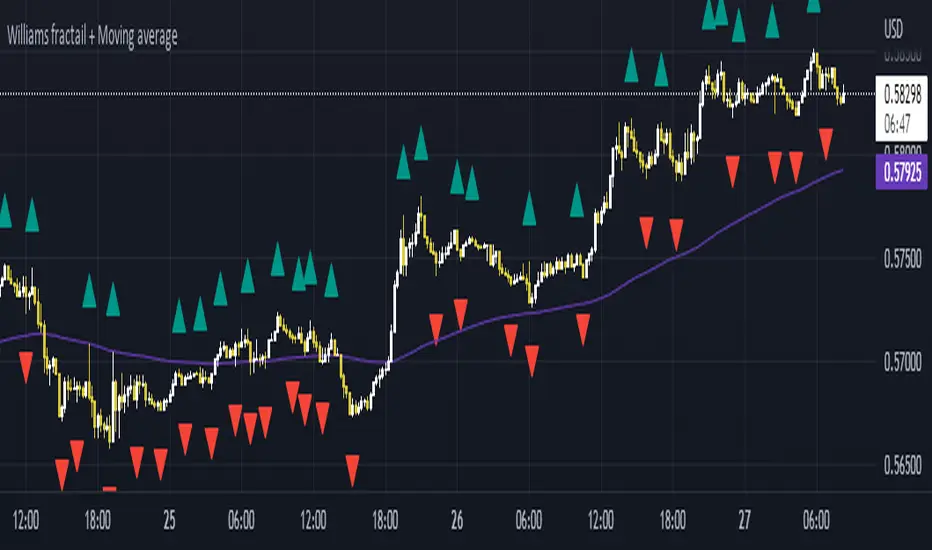
Williams Fractals + SMMAwilliams fractail + moving average. Is for educational . combined indicator of williams fractails and smmothed moving average
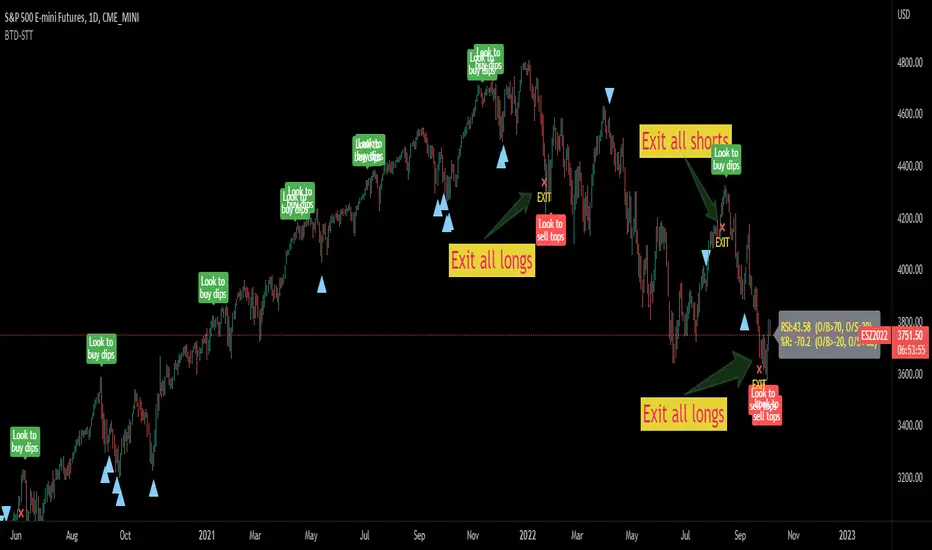
Buy the dips - sell the topsThis script is a merge of the RSI and the Williams %R.
I've observed that in strong uptrends, we go from RSI overbought to RSI overbought, but it hardly gets oversold. (the same in the opposite direction)
To find a better entry point, Williams %R is used to find oversold conditions in an uptrend or overbought in a downtrend.
=> When W%R returns from oversold/overbought to normal, a triangle will be plotted and this is the point of entry to add to your position. (there's an option to mark all candles in the overbought/oversold region, by default it is off)
=> When RSI goes from overbought back to normal it will tell you to buy the dip. In a downtrend it will tell you to sell the tops.
=> When the RSI gets oversold and the previous RSI was overbought, it will mark to exit the position
I did backtest this one with a risk to reward of 2 and exit when target is reached.
Trading EUR/USD on the daily would return 28% after 10 years of trading with a success ratio of 43%.
Trading BTC/USD on the daily would lose 12% after 7 years and a success rate of 28%.
Trading it this way is not the best idea ;-) 2 Interesting observations however:
- Once you get the entry right, in 80% of the cases, you do reach the next RSI oversold/overbought level. Keeping your position open until you reach that level can be an option to maximize profits.
- When a triangle is plotted and it is the low compared to the previous more or less 5 candles (same for the high), chances are high it will be taken out a few candles later, so don't take a trade yet.
Using classic technical analysis might improve more your entry and exit positions.
Feel free to comment your best strategy using this indicator ;-)
Happy trading!
Quick and Simple - WPR+RSI+CCITake a look.
Couple of confluencial reversal signals from popular indicators (W%R, RSI & CCI). I can only say this shows how random the "stanard tools" are and how the market makers "play" these kind of tools to their advantage.
That said. It's better tha average, but not top-class, so expect to have to take signals with other confluence. DON'T take the plots or signals as buy / sell signals, they are just confluencial movements from these indicators based on how they should be "traditionally" used. Instead, use it as a guide as to what other traders may be thinking, or as a pull-back identifier.
Included 100 period ema as basic trend filter.
Not my normal type of script + been away for some time so be kind, lol :)
You might find it useful however so sharing.
More stuff to follow :)

End-pointed SSA of Williams %R [Loxx]End-pointed SSA of Williams %R is an indicator that runes Williams %R SSA calculation through a Singular Spectrum Analysis (SSA) algorithm to derive a smoother final output. The reduction in noise from the traditional Williams %R is significant.
What is Williams %R?
Williams %R , also known as the Williams Percent Range, is a type of momentum indicator that moves between 0 and -100 and measures overbought and oversold levels. The Williams %R may be used to find entry and exit points in the market. The indicator is very similar to the Stochastic oscillator and is used in the same way. It was developed by Larry Williams and it compares a stock’s closing price to the high-low range over a specific period, typically 14 days or periods.
What is Singular Spectrum Analysis ( SSA )?
Singular spectrum analysis ( SSA ) is a technique of time series analysis and forecasting. It combines elements of classical time series analysis, multivariate statistics, multivariate geometry, dynamical systems and signal processing. SSA aims at decomposing the original series into a sum of a small number of interpretable components such as a slowly varying trend, oscillatory components and a ‘structureless’ noise. It is based on the singular value decomposition ( SVD ) of a specific matrix constructed upon the time series. Neither a parametric model nor stationarity-type conditions have to be assumed for the time series. This makes SSA a model-free method and hence enables SSA to have a very wide range of applicability.
For our purposes here, we are only concerned with the "Caterpillar" SSA . This methodology was developed in the former Soviet Union independently (the ‘iron curtain effect’) of the mainstream SSA . The main difference between the main-stream SSA and the "Caterpillar" SSA is not in the algorithmic details but rather in the assumptions and in the emphasis in the study of SSA properties. To apply the mainstream SSA , one often needs to assume some kind of stationarity of the time series and think in terms of the "signal plus noise" model (where the noise is often assumed to be ‘red’). In the "Caterpillar" SSA , the main methodological stress is on separability (of one component of the series from another one) and neither the assumption of stationarity nor the model in the form "signal plus noise" are required.
"Caterpillar" SSA
The basic "Caterpillar" SSA algorithm for analyzing one-dimensional time series consists of:
Transformation of the one-dimensional time series to the trajectory matrix by means of a delay procedure (this gives the name to the whole technique);
Singular Value Decomposition of the trajectory matrix;
Reconstruction of the original time series based on a number of selected eigenvectors.
This decomposition initializes forecasting procedures for both the original time series and its components. The method can be naturally extended to multidimensional time series and to image processing.
The method is a powerful and useful tool of time series analysis in meteorology, hydrology, geophysics, climatology and, according to our experience, in economics, biology, physics, medicine and other sciences; that is, where short and long, one-dimensional and multidimensional, stationary and non-stationary, almost deterministic and noisy time series are to be analyzed.
Included:
Bar coloring
[*Alerts
[*Signals
[*Loxx's Expanded Source Types
Related Williams %R Indicators
Williams %R on Chart w/ Dynamic Zones
Williams %R w/ Bollinger Bands
Intermediate Williams %R w/ Discontinued Signal Lines
Related SSA Indicators
End-pointed SSA of FDASMA
End-pointed SSA of Normalized Price Oscillator
Rsi/W%R/Stoch/Mfi: HTF overlay mini-plotsOverlay mini-plots for various indicators. Shows current timeframe; and option to plot 2x higher timeframes (i.e. 15min and 60min on the 5min chart above).
The idea is to de-clutter chart when you just want real-time snippets for an indicator.
Useful for gauging overbought/oversold, across timeframes, at a glance.
~~Indicators~~
~RSI: Relative strength index
~W%R: Williams percent range
~Stochastic
~MFI: Money flow index
~~Inputs~~
~indicator length (NB default is set to 12, NOT the standard 14)
~choose 2x HTFs, show/hide HTF plots
~choose number of bars to show (current timeframe only; HTF plots show only 6 bars)
~horizontal position: offset (bars); shift plots right or left. Can be negative
~vertical position: top/middle/bottom
~other formatting options (color, line thickness, show/hide labels, 70/30 lines, 80/20 lines)
~~tips~~
~should be relatively easy to add further indicators, so long as they are 0-100 based; by editing lines 9 and 11
~change the vertical compression of the plots by playing around with the numbers (+100, -400, etc) in lines 24 and 25
