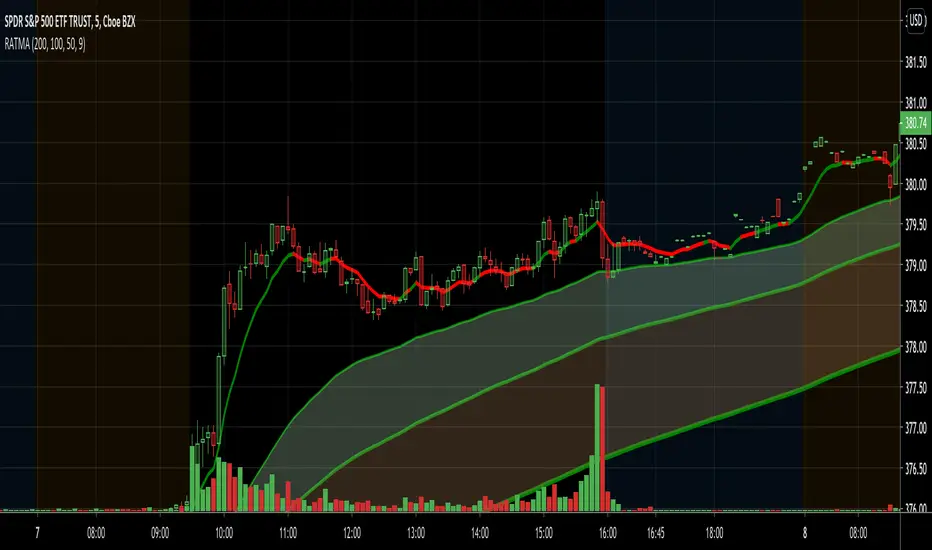
万有引力(均线支撑阻挡Moving Average Support and Resisitance)系统This is a Moving Average indicator base on R/S which design for Chinese.
这是一个基于均线作为移动支撑阻挡的用法而设计的指标。
本脚本的目的在于帮助使用中文的人了解该指标,特别是其用法。同时将该指标代码添加完整的中文注释,方便使用中文的人学习Pine语言。
均线移动支撑阻挡的用法是葛南维八大买卖法则的基础。
本指标的特色
本指标利用均线的支撑阻挡效应来捕捉一段长期趋势的第二段行情。
*万有引力:即均值回归理论。认为价格始终在重复着远离其均值,再回到其均值;
*洛希极限:以均线为中心,以其0.2标准差构建其上下轨道,形成一个容错通道;
指标可调节参数
该指标有三个可设置的参数
1 短周期均线参数:默认为20;
2 长周期均线乘数:默认为80;
3 标准差参数:0.2
本指标还有两项可选设置项
1 价格源:价格源默认使用收盘价,但是你还可以选择使用开盘价、最高价、最低价等其他的价格计算方式;
2 是否显示强趋势的开关;
3 是否显示中趋势的开关;
指标用法
买入信号: 当指标出现上涨A或上涨B时,即为买入信号。其中上涨A为强趋势信号,上涨B为中趋势信号。
卖出信号: 当指标出现下跌A或下跌B时,即为卖出信号。其中下跌A为强趋势信号,下跌B为中趋势信号。
本指标支持配置买卖点的预警。
指标优势
1 适用于不同的时间周期和不同的交易品种;
2 对趋势有很好的识别效应。
指标局限性
本指标主要在于捕捉趋势的第二段,若当前趋势较弱时,第二段极有可能不成立。
Media mobile ponderata (WMA)

RAT Momentum Squeeze BETAV1.0
MAs are a great tool to measure the market's momentum. I created this indicator to graphically depict bullish and banishment movements with the moving averages.
Using the 50, 100, & 200 day MA in conjunction with the RSI we are able to find great swing setups. This is used best on the 30min & up to the daily chart.
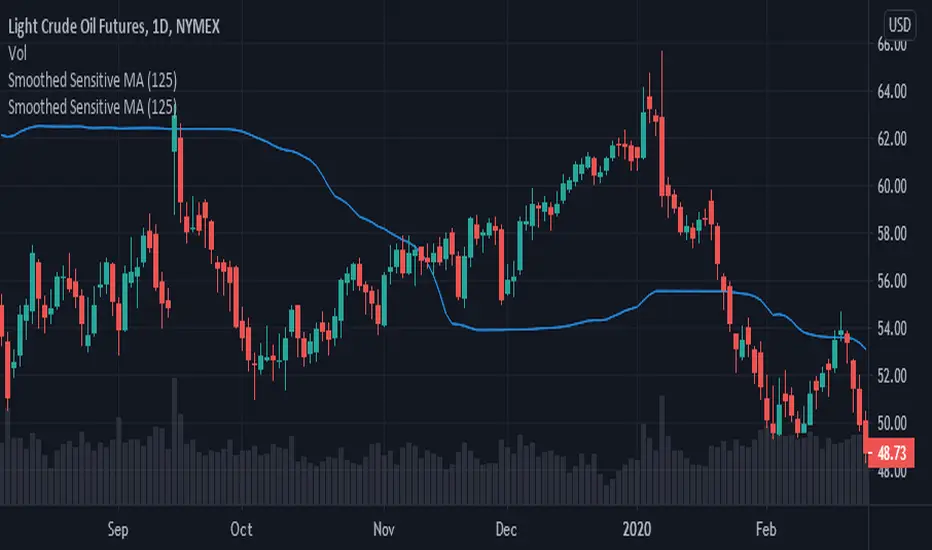
Smoothed Sensitive MAThis moving average is sensitive and reacts quickly to significant price movements, while remaining indifferent to small price moves.
Smoothed Sensitive MA is triple weighted for price changes.
It takes in one parameter "Length", which is used as both
1. the lookback period for price change,
zCC=abs(close-close [ len ])
and also as
2. the number of periods to be averaged
zSSMA=sum(zCC*zCC*zCC*close, len )/sum(zCC*zCC*zCC, len )
Alternatively, you could modify the script to use two separate parameters for values for 1 and 2.
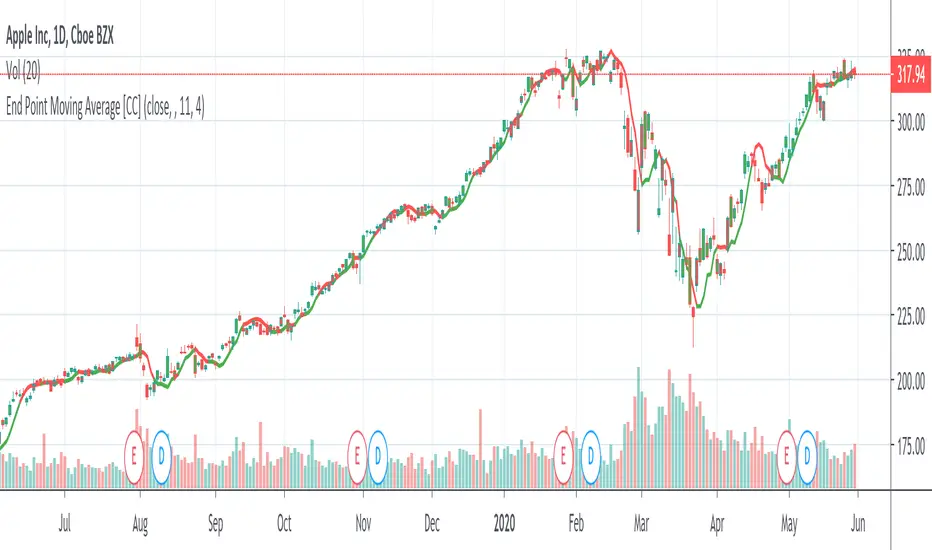
End Point Moving Average [CC]The End Point Moving Average was created by Patrick E. Lafferty (Stocks & Commodities V13 (413-417)) and it is essentially a variation of the weighted moving average but the weight system is different. Feel free to change the offset and length amounts to adjust to your needs but I'm using the default amounts in my script. This hugs the price very closely and I think you will enjoy this script as much as I had making it. As always buy when the indicator line is green and sell when it is red!
Let me know if you would like me to publish other scripts or if you want something custom done!
Note: I'm republishing this because the original script couldn't be found in searches so this will fix that.

GMS: Keltner ChannelsBasically I wanted to make this into one indicator instead of three while adding in some extra options as well... So this is just a Keltner Channel with three channels, all of which have the same length. I have also added in an option to select the moving average for the channel, the original is based on the EMA.
The source code should be open so take a look around and enjoy!
Andre

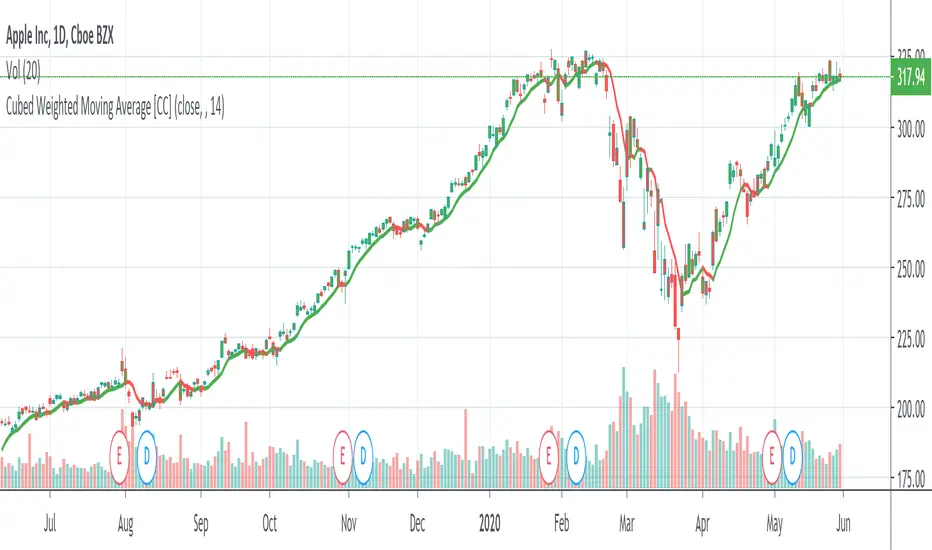
Cubed Weighted Moving AverageThis is another indicator that I have created that is my favorite script yet for a weighted moving average. This indicator is very similiar to a classic weighted moving average but in this version I'm cubing the weights. It hugs the price very closely as you can see and of course buy when the indicator line is green and sell when it is red.
Let me know if you would like me to publish other scripts or if you want something custom done!
WMA/LSMA - Simplified CalculationsLots of moving averages are based on a weighted sum, the most common ones being the simple (arithmetic) and linearly weighted moving average. The problems with the weighted sum approach is that when your moving average is a FIR filter then the number of operations increase with higher values of length, and when the weights are based on a complex calculation this number of operations can increase drastically!
For the common technical analyst the calculation time of moving averages can be an insignificant factor, even more when using higher time frames, however its always a good practice to seek better performances. The SMA has already a calculation where the number of operations is independent of its length, as such it can be easy to do the same for the linearly weighted moving average (WMA). This post will describe the process toward calculating a simple and efficient WMA which will then be used to provide an efficient calculation of the least squares moving average (LSMA).
Carving Impulses Responses
Remember that impulses responses fully describe the properties of moving averages, the impulse response of the WMA is a linearly decreasing function, so we'll try to calculate it without using a weighted sum. We first need to use a cumulative sum, the cumulative sum can be described as a summation from the first element of a series to the n th element of the series, where n is the current bar number, one could say that this operation is actually super inefficient, however this is not the case, as a cumulative sum can be calculated recursively as follows:
y = y + x
The cumulative sum can be described as an amplifier and posses the following impulse response:
Once the cumulative sum receive the impulse signal as input the result will always be equal to 1. This will form the basis of our simplified calculation, all we need to do transform this response into a linearly decreasing one. The full process is as follows:
Get the impulse response of the cumulative sum
Subtract this response from a linearly increasing impulse response of size length
Normalize the result such that the sum of the resulting response is equal to 1
We need a linearly increasing response of size length , this can be done by using a running sum of the original cumulative sum response, however we must make sure that the value of this response is 0 when the one of the cumulative sum is first equal to 1. Because the resulting response as a maximum value of length we need to multiply our cumulative sum response with length , then we proceed to subtraction.
Finally we need to normalize the result, the sum of a linear sequence of values starting at 1 and ending at n is given by the explicit formula : n(n+1)/2 , which in our case give length*(length+1)/2 , we divide our previous response with this result and we end up with the impulse response of a WMA. This process can be graphically described as follows:
We can then replace the impulse function by the closing price in order to get the WMA of the closing price.
Advantages And Disadvantages
The big advantage of this calculation is its efficiency, in its non functional form (you can see it in the code) the calculation of the WMA only require 9 operations regardless of the value of length against length*2 + 4 for the weighted sum approach, as such both methods are equally efficient in terms of operations as long as the length of a standard WMA is inferior to 3, which is ridiculous, as such our approach is more appropriate.
Another advantage is that Pinescript does not allow for series as length arguments in the WMA function, however here we can have a variable length for the WMA.
Of course there are disadvantages to this approach, in terms of code we require more variables for the non functional form, which create a lengthier scripts. Another disadvantage is that we can be prone to rounding errors due to the cumulative sum, however they shouldn't be significants in our case.
Getting The Least Squares Moving Average
The LSMA is one of my favorite moving averages, and it can derived from a linear combination between the WMA and SMA described as follows : 3WMA - 2SMA. Since we proposed an alternative calculation of the WMA we can then calculate the LSMA without even using the SMA, why ? because the SMA can be calculated by computing the changes over length period of the cumulative sum of an input, this result is then divided by length .
Remember that the impulse response of a cumulative sum is just a rectangular function, all we need is to truncate it such that only length values of the response are equal to 1, this is done thanks to the change function in Pine.
In Summary
A more efficient calculations for both the WMA and LSMA have been presented, while this on itself isn't super important you have learned what is the process toward calculating a filter without relying on a weighted sum.
This calculation will soon be included in the Pinecoders script allowing series as length argument.
Thank you for reading, your interest is always appreciated !

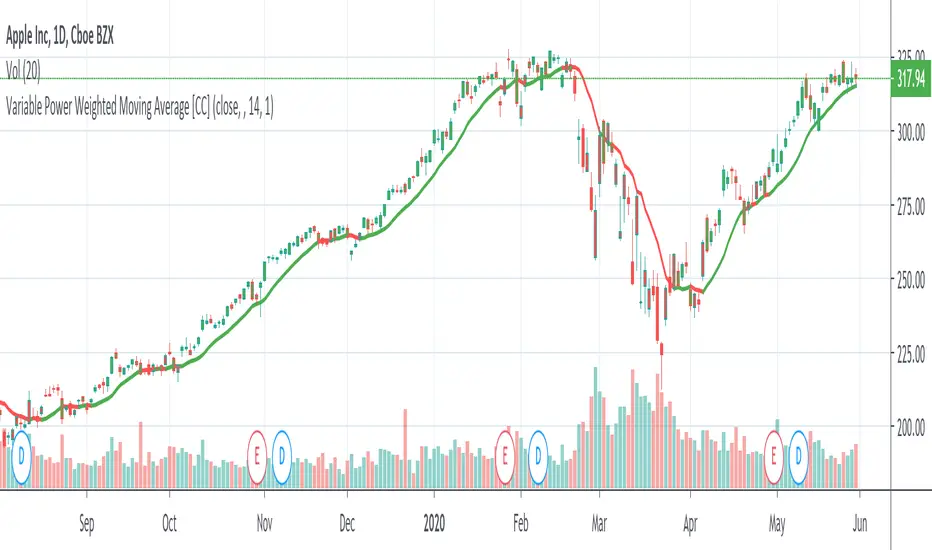
Variable Power Weighted Moving AverageThe Variable Power Weighted Moving Average was created by RedKTrader so make sure you follow them! This is a very handy indicator where you can change the weights of the weighted moving average yourself!
For an easy guide here are common values to use to convert this indicator into other indicators:
Power = 0 = Simple Moving Average
Power = 0.5 = Square Root Weighted Moving Average
Power = 1 = Weighted Moving Average
Power = 2 = Squared Weighted Moving Average
Try it out and let me know what you think!
Let me know if you have other ideas for me or if you want something custom done!
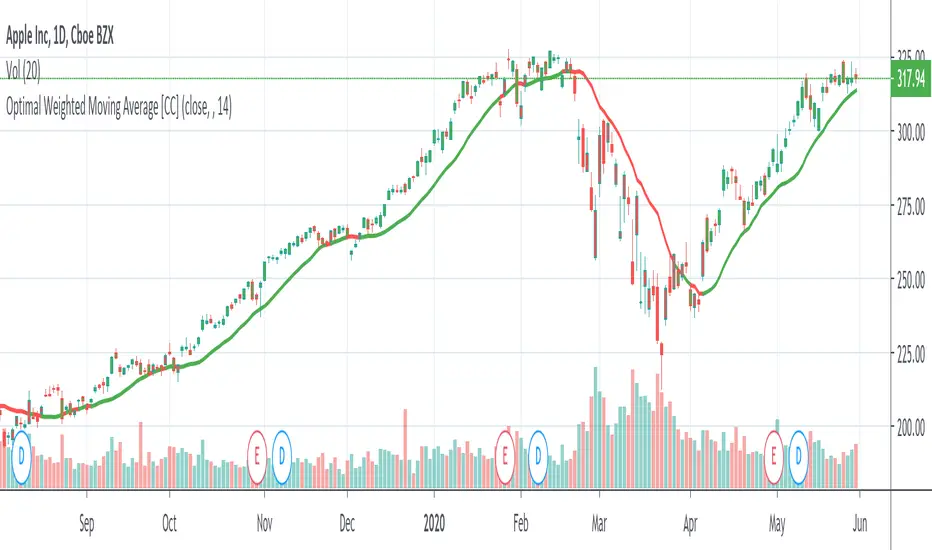
Optimal Weighted Moving AverageThe Optimal Weighted Moving Average was created by Thomas Hutchinson and Peter G. Zhang, Ph.D. (Stocks & Commodities V. 11:12 (500-505)) and it is very similar to a classic weighted moving average but it uses the correlation between the input and the optimal weighted moving average output to use as the weights. Buy when the line turns green and sell when it turns red.
Let me know if you would like to see me publish any other scripts or if you want something custom done!
Squared Weighted Moving AverageThe Squared Weighted Moving Average is similar to the classic Weighted Moving Average but the difference is that it squares the weights instead of the classic weight values. Buy if the indicator line is green and sell when it goes red.
Let me know if you would like to see any more scripts from me or if you want something custom done!

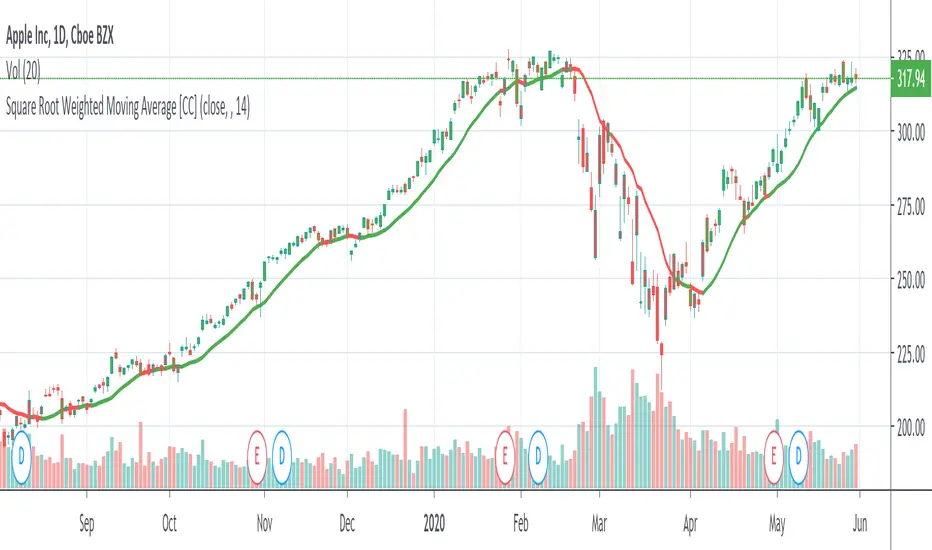
Square Root Weighted Moving AverageThe Square Root Weighted Moving Average is similar to the classic Weighted Moving Average but the difference is that it uses the square root of the weights instead of the classic weight values. Buy if the indicator line is green and sell when it goes red.
Let me know if you would like to see any more scripts from me or if you want something custom done!
Moving Average RibbonMoving Average Ribbon:
-----------------------------------------------------------
A series of moving averages of different lengths to create a ribbon-like indicator. Traders can determine trend strength by the distance between the moving averages, the overall balance of the coloured lines and determine price points. Price movements through the ribbon can be used to identify trend changes.
SMA, EMA, WMA with user defined length, starting plot, number of plots to show, theme choice and colour calculation toggle.
Inputs:
-----------------------------------------------------------
Source: input value for MAs (close)
Type: moving average type (ema)
Theme: multiple colours/themes (theme 2)
Length: MA length (13)
Start: MA plot number to start ribbon on (1)
No. of MAs: number of plots to show; maximum 32 (32)
Colour option: unchecked then line colour is based on the source value crossing current MA otherwise the moving average below (false)
Example:
-----------------------------------------------------------
multiple MAs overlaid with different values give interesting results e.g.
Ribbon1 :
length: 13
start: 1
Ribbon2:
length:1
start: 26
Notes:
-----------------------------------------------------------
if increasing the length beyond around 150 results in "references too many candles in history" error then reduce the no. of MAs value to show less MA plots; the longer length MAs will go beyond the 5k max candle history..

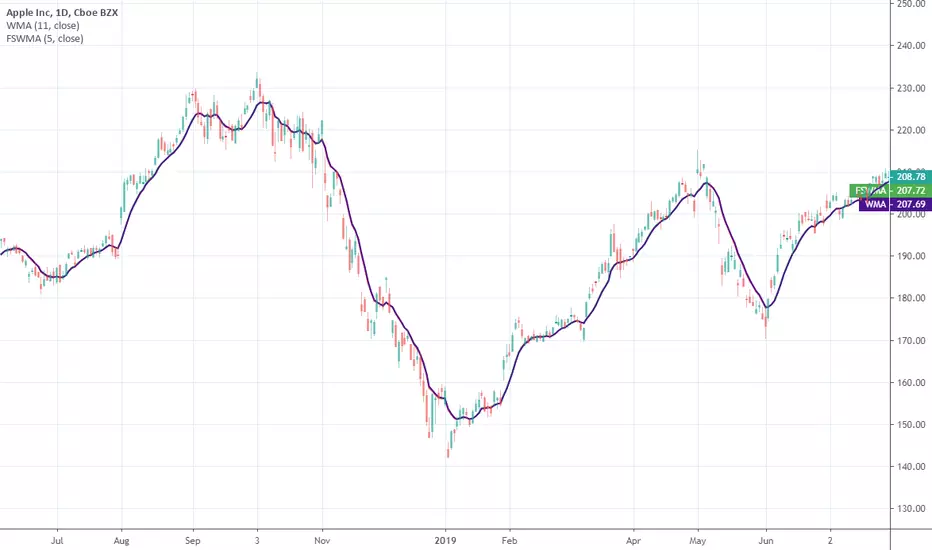
TA Basics: Evolving our Zero Lag Moving Average.In the previous Zero-Lag MA post, we introduced the "mirroring" technique and the associated calculation.
In this post, we will see how we can use the same technique, with a slight variation, to evolve our zero lag moving average line, add more "smoothness" and still maintaining the low lag and fast response to data series changes.
to use the "mirroring" technique, we need to use 2 MA lines with varying speeds - this is essential to produce the delta between the lines, that can then be mirrored around the fast line to produce the final line. in the first example, we used a Simple MA (slow) and a Weighted MA (fast) of the same length to achieve that.
here we introduce a different way of doing that. we will use a Weighted MA of the length (slow) and another Weighted MA of half the length (fast) -- the difference in "speed" between these 2 lines should produce the delta we need, we mirror it around the fast line, and we get our desired Zero-lag line. Check!
then while we're at it, why don't we introduce an additional smoothing just to ensure the new line is not too "broken" and jumpy .. and flows smoothly across the data series. but what length should we use for smoothing?
smoothing length should be enough to make an actual smoothing effect, but not too large else it will introduce lagging on its own. how about 3? usually 3 or 4 are good values for smoothing. A brilliant idea here is to use a number related to the same input length of the original line, which can always be relatively small -- the square root (integer portion) of that original length - and in that case, the user will only need to enter 1 input for the moving average, just the length - everything will be calculated from there. Check again!
I commented the code if you like to follow the simplified build-up of the formula, now that the concept is explained.
the (more complex-looking) 1-line, condensed form of that formula to use is (alert: watch out for the ()'s -- they're tricky :) )
----------------------------------------------
ZLMA_Line = wma((2*wma(close,int(length/2)) - wma(close,length)), int(sqrt(length)))
------------------------------------------
the one thing i do not like about this technique, is that we introduce the use of the half length MA. i do not like to build indicators that make decisions like this on behalf of the trader - the trader wants to analyze the data for a specific length, and we should continue to stick to that consistently across the moving average (or whatever indicator) calculation. I would always be caution about "hardcoding" some optional values (in this case 0.5 * length) within the indicator itself - others may not mind that.
Now to a nice surprise for the patient folks who got so far in this post - Congratulations, we have just discovered the concept and the formula behind the famous Hull Moving Average .. the big thing here is, we just had the opportunity to learn how to create the whole thing ourselves from the ground up step by step, and had fun doing it (I hope!)
-- these posts are meant to provide those who are new to the world of technical analysis and want to learn how and why to build their own technical indicators. i hope some of you find them useful and interesting, and i wish you the best of luck.

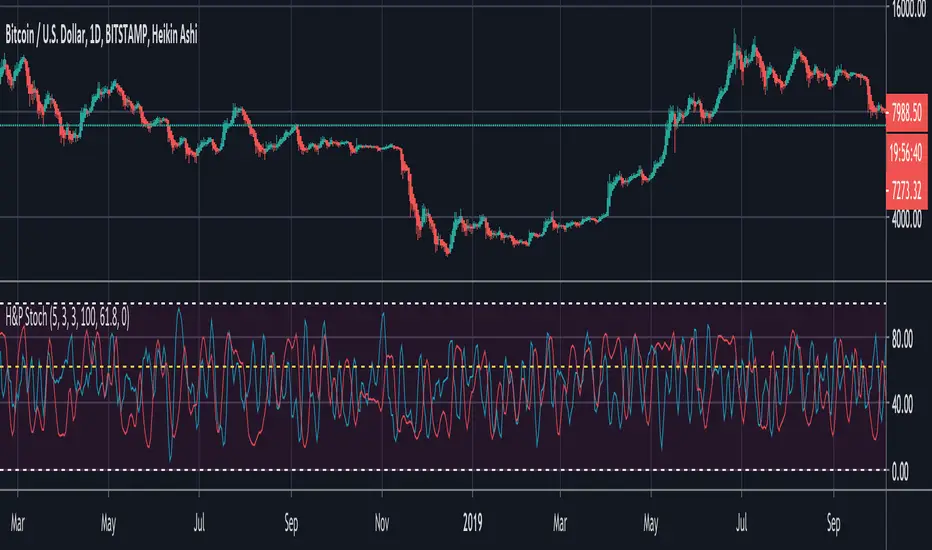
BTC Hash Rate & Price Stochastic IndiciatorFresh off the press, we have a new breed of indicators: Bitcoin's Hash Rate & Price.
As many of you have read, roughly 80% of BTC's price movements can be correlated to its changes in hash rate volume. I decided to make a stochastic indicator that utilizes this principle to track divergence of the price from the hash rate.
Let's break this down...
In red is the CLOSE of BTC's Price, which is then smoothed by a SMA, and smoothed again by a WMA.
In aqua is a STOCH of BTC's Hash Rate, which is then smoothed by a SMA, and smoothed again by a WMA.
The reason why I chose to use the CLOSE of the Price versus a STOCH as I did with the Hash Rate, is because the price tends to signal trends via divergence from the Hash Rate, and eventually converge with the Hash Rate at some point.
You will notice that anytime there is a significant divergence of the RED from the AQUA, a trend is closely aligned with it. This indicator does a remarkable job of indicating the beginnings and ends of both bullish and bearish price movements.
Example Strategy:
Enter long when RED (price) crosses over AQUA (hash rate), and close long when RED crosses under AQUA.
The inverse can be done for shorts, just RED diverges downwards from AQUA versus upwards.
Note:
Unlike a normal Stochastic Indicator, the upper and lower bounds do not appear to hold any significance. In other words, the lines do not seem to reverse at 20/80. As a result, I just set them to 0/100 for aesthetics.
DO NOT make trades based off of small divergences, or simply enter into positions based off the price divergences. Though this indicator times the start/end of movements very accurately, it also comes riddled with false breakouts .
Proceed at your own pace, and please, toy around with the inputs values. I experimented with a few combinations, but I'm sure there are better value combinations that yield sharper results with fewer false signals.
EASTER EGG:
Notice the "Golden Line"? Any avid user of TV knows that Fibonacci ratios show up everywhere in markets. With that said, I plotted a horizontal line at 0.618, which is 1/Phi, an important level in Fibonacci retracements.
Final Comments:
First, this is not investment, merely my experimentation and observation of happenings in the analytical world.
Second, please comment questions, improvements, etc. Dialogue opens up room for exploration!
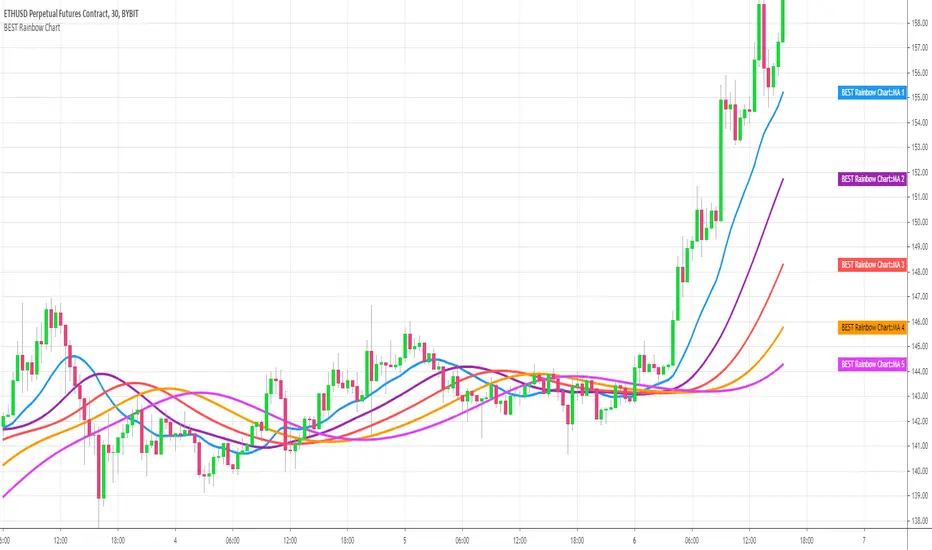
BEST Rainbow ChartHello traders
This script is a Pinescript adaptation of this FXCM/LUA script
Draws a flexible number of moving averages between 1 and 5 - with a end result looking like a rainbow
Formula
Each Moving Average is defined as a Moving Average of the previous MA
The first MA is based on candle close
MA = MA of Price
MA = MA of MA
....
MA = MA of MA
Bonus
You can select the MA type (EMA, SMA, SMMA, TEMA, DEMA, TMA, ALMA, VWMA, ...) and the MA period shared across all the moving averages
Scaling
If you have any issue with your scaling, you may follow this quick tutorial
Hope you'll like it because it looks nice on your chart :)
Dave
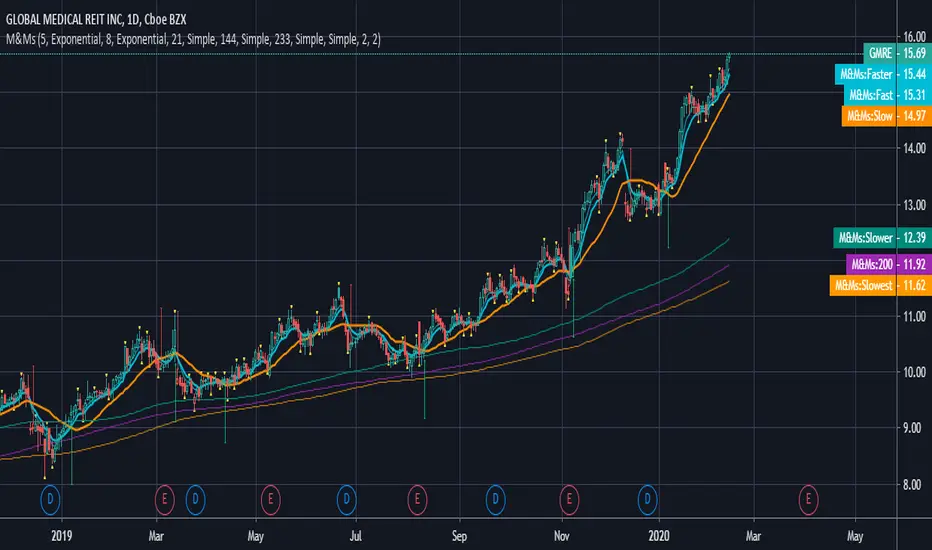
M&Ms - Multiple Moving Average Indicators This version includes Simple, Exponential and Weighted Moving Averages.
5WMAs based on GANN numbers 5 13 49 73 198Plots 5 Weighted Moving Averages of 5 13 49 73 198 with source (High+Low+Close)/3
A Cross Appears when 13 WMA Crosses 49 WMA

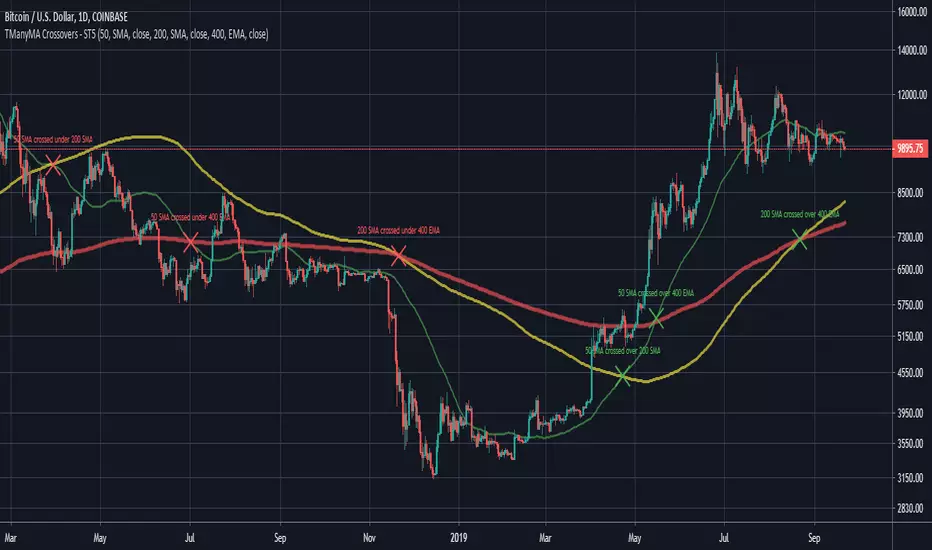
Scripting Tutorial 8 - Triple Many Moving Averages RibbonsThis script is for a triple moving average indicator where the user can select from different types of moving averages, price sources, lookback periods and resolutions.
Features:
- 3 Moving Averages with variable MA types, periods, price sources, resolutions and the ability to disable each individually
- Crossovers are plotted on the chart with detailed information regarding the crossover (Ex: 50 SMA crossed over 200 SMA )
- Forecasting available for all three MAs. MA values are forecasted 5 values out and plotted as if a continuation to the MA.
- Forecast bias also applies to all forecasting. Bias means we can forecast based on an anticipated bullish, bearish or neutral direction in the market.
- To understand bias, please read the source code, or if you can't read the code just send me a message on here or Twitter. Twitter should be linked to my profile.
- Ribbons added and on by default. Optional setting to disable the ribbons. 5 ribbons between MA1 and MA2 and another 5 between MA2 and MA3.
- Ribbons are alpha-color coded based on their relation to their default MAs.
- Ribbons are only visible between MAs if the MAs being compared share the same Type, Resolution, and Source because there is no way to consolidate those three in a simple manner.
- Ribbon values are calculated based on calculated MA Periods between the MAs.
This script is meant as an educational script with well-formatted styling, and references for specific functions.

Momentum 4 Ways Smoothed [Salty]This is an enhance version of Momentum 4 Ways that shows 4 ways to calculate momentum and display each one along with their combined average value.
This study was created to compare 4 different momentum values against their combined average using different display styles to allow the user to experiment with different views of momentum.
- Added the ability to smooth the Average Momentum value. Default Smoothing value is 5.
- Added the ability to use different average calculations. Default is WMA.
- Added the ability to select the number of momentum values to average (1-4). Default is 4.
- Added the ability to use VWAP instead of price as the input.
The Smoothed Average Momentum line is color coded so that it is green when it is moving in the bullish direction and red when it is moving in the bearish direction.

Scripting Tutorial 5 - Triple Many Moving Averages CrossoversThis script is for a triple moving average indicator where the user can select from different types of moving averages and periods. This script improves upon tutorial 3 by adding source selection for MAs and another option for an MA that is not built-in, the HMA . It is meant as an educational script with well formatted styling, and references for specific functions.
Farey Sequence Weighted Moving AverageA moving average that weighted with Farey fractions. It matches a standard linear weighted average almost one-to-one. Why? Because both averages have strictly monotonic weighting sequences and assign a higher weight to latests data. So, Farey weights are just scaled to linear ones. Instead of specifing period you specify an order of Farey sequence. To learn more about Farey sequence you can refer to Wiki
Published just for reference, it is not intended for trading purposes.
Savitzky-Golay Smoothing FilterThe Savitzky-Golay Filter is a polynomial smoothing filter.
This version implements 3rd degree polynomials using coefficients from Savitzky and Golay's table, specifically the coefficients for a 5-, 7-, 9-, 15- and 25-point window moving averages.
The filters are offset to the left by the number of coefficients (n-1)/2 so it smooths on top of the actual curve.
You can turn off some of the smoothing curves, as it can get cluttered displaying all at once.
Any feedback is very welcome.
