Yield Inversion Curve DifferenceDisplays the yield inversion difference on bonds between short term and long term bonds.
Yield


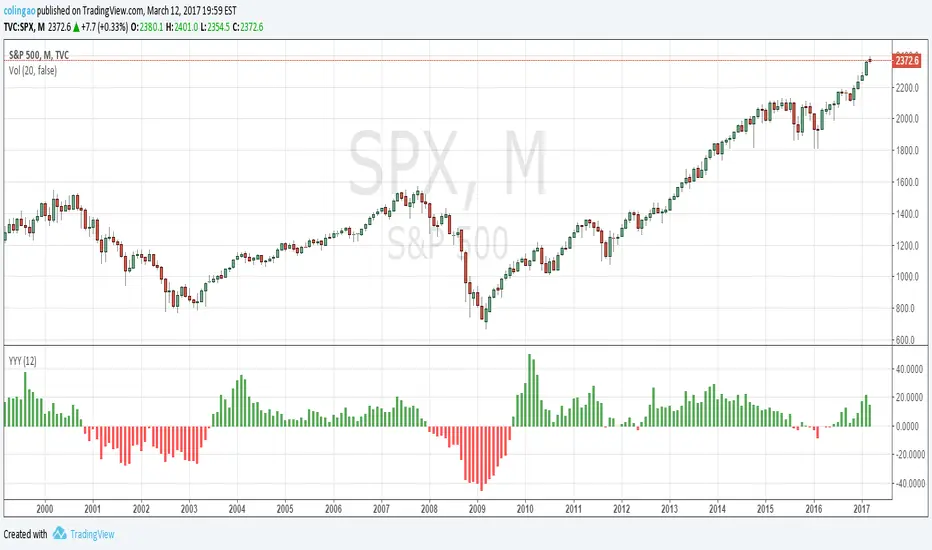
Inverted Yield Curve with VIX Fear IndexUS 2 year and US 10 year comparison, inverted yield curve with VIX. I use this on a weekly chart with 2 moving averages, the 40 week (ma200 daily) and the 520 week (10 year median).
The bottom histogram is the VIX and the plot is the yield curve. When the VIX is above a certain level (you can set it in settings) and the ýield curve is close to or at inversion the background goes red.
The last seven recessions were preceded by an inverted yield curve. Here I combined the two main fear indexes, the VIX and the run for safe US treasuries (Inverted Yield Curve).
This is preset to the 2 year and 10 year US bond, weekly, and the normal VIX ticker but you can set it to whatever you like.
Published with source code for anyone to modify. Please comment below if you do so! This is the second in a series of indicators I intend to publish as a package of economic recoverty/recession symptom indicators.
Follow me for updates, next one up is commodities with dr Copper and oil!

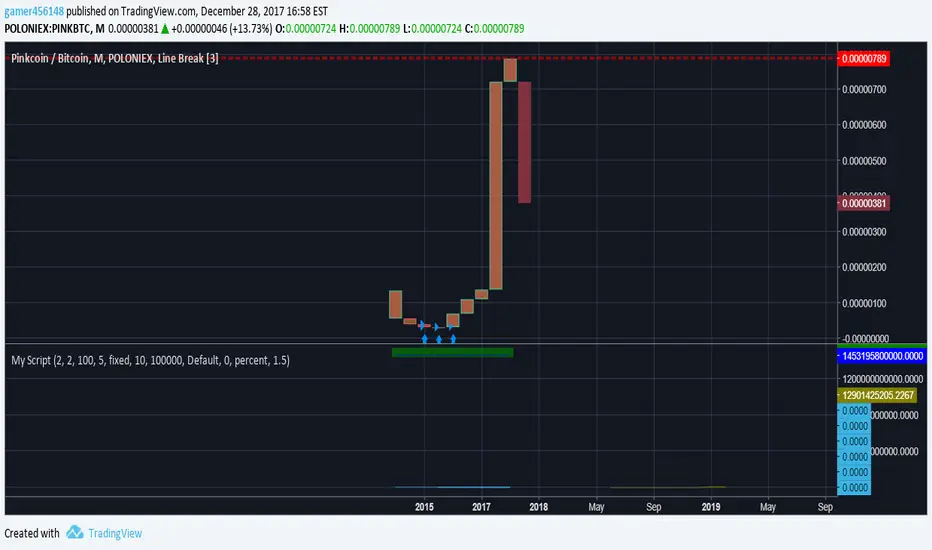
Yield Ratio ViewerUtilizes for yield and buy hold positions using the "Volume & Intraday Script" as well as the acculturation and distribution views script. The point of this is to backtest long holds for past strategies in a trading script. Math and logic still would need to be added with higher frequency to make this more efficient with the script that you would be utilizing for trading. This should work well for both cryptocurrency and forex trading as well as binary options bots that follow the modulus formula.