Amazon Multi-Month Position Build: $232-234 Entry Zone Targeting $320
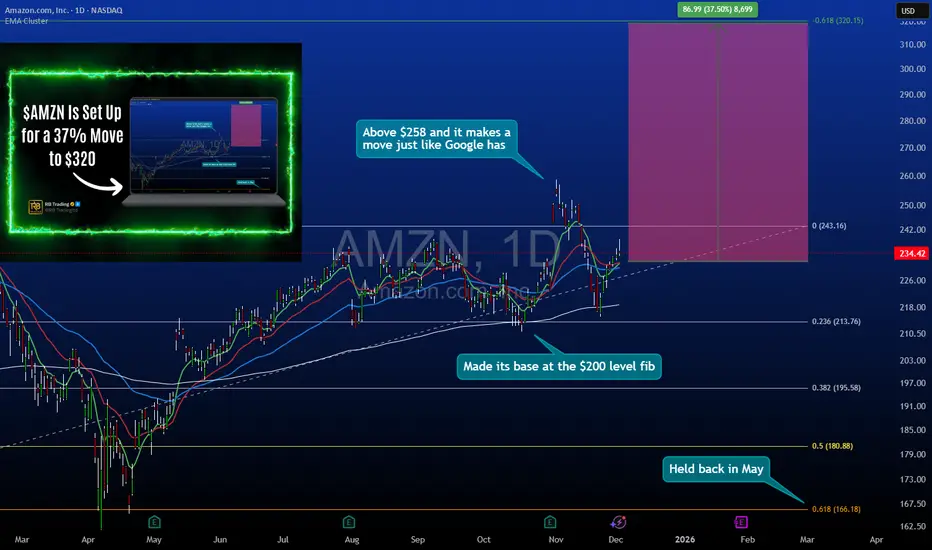
Amazon has pulled back into a critical support zone at $232-234, presenting the same geometric retracement setup that recently validated on GOOGL. This analysis breaks down why this level offers favorable risk/reward asymmetry for a multi-month position targeting $320.
🎯 Setup Overview:
Entry Zone: $232-234 (current pullback area)
Primary Target: $320 (37% upside potential)
Timeframe: Multi-month position (Q1-Q2 2025)
Pattern: Structured retracement in established uptrend
📊 Technical Structure:
Support Confluence at $232-234:
0.618 Fibonacci retracement from recent swing low to high
Previous consolidation zone that acted as resistance, now support
Volume profile shows significant accumulation at this level historically
Aligns with rising trendline from 2023 lows
Price Action Context:
Amazon rallied from $140 lows to $260+ highs before this pullback. The current retracement brings price back into a zone where buyers have historically stepped in with conviction.
Why $320 Target:
Represents the next major resistance zone from prior price structure
Aligns with measured move extensions from current base
37% upside provides asymmetric reward relative to defined risk
🔍 The GOOGL Parallel (Why This Pattern Works):
What Just Happened with GOOGL:
Google recently pulled back into a similar geometric retracement zone (0.618 level) and reversed sharply, validating the strategy of buying quality big tech names during structured pullbacks rather than chasing momentum.
Why The Pattern Repeats:
Institutional Behavior: Large funds rebalance and take profits at resistance, creating predictable pullback zones
Liquidity Zones: Support levels represent areas where prior buyers have conviction and add to positions
Mean Reversion: Extended moves in trending assets typically retrace to specific mathematical levels before continuation
Key Lesson from GOOGL:
The most uncomfortable entry (during the pullback) provided the best risk/reward. Waiting for "confirmation" meant entering 15-20% higher with expanded risk.
📈 Why This Setup Makes Sense:
Risk Is Defined:
Stop loss placement below $225 (structure breakdown) limits downside to ~$7-9 per share from mid-range entry at $233. If price breaks $225, the bullish thesis is invalidated.
Reward Is Probable:
The $320 target isn't arbitrary it's based on:
Previous resistance turned future resistance
Fibonacci extension levels from the pullback
Historical price behavior at major psychological levels
From $233 entry:
Risk: ~$8 to stop at $225
Reward: $87 to target at $320
Ratio: ~10.8:1
Even a conservative partial target at $280 (first resistance) still offers 6:1 reward/risk.
🛡️ Risk Management Framework:
Entry Strategy (Scaling In):
First position: $234 (initial test of support zone)
Second position: $232 (if support retests cleanly)
Final position: $228-230 (if maximum pain occurs but structure holds)
This averaging approach improves entry price while maintaining discipline.
Stop Loss Placement:
Below $225 - a decisive break of this level invalidates the support thesis and requires exit regardless of unrealized loss.
Target Management:
First reduction (1/3): $270 (previous resistance, books profit)
Second reduction (1/3): $295 (psychological level, locks gains)
Final exit (1/3): $320 (primary target, complete position close)
Progressive profit-taking removes emotion from exits.
🧠 Trader Psychology: Why Most Will Miss This:
The Discomfort Factor:
At $234, Amazon "feels" weak because it's down from $260. At $270, it will "feel" strong because it's rising. But the best risk/reward exists now, not later.
Recency Bias:
Recent selling pressure makes traders assume more downside. Historical structure suggests this is where buyers return.
Waiting for Confirmation:
Many will wait for price to break above $250 to "confirm" strength. By then, risk to $225 expands dramatically and reward compresses.
The GOOGL Proof:
Those who waited for Google to "prove itself" entered 18% higher with worse risk parameters. The same pattern is setting up here.
📊 Tools Supporting This Analysis:
Fibonacci Retracement:
0.618 level at $232 marks the zone where pullbacks in strong trends typically find buyers.
Volume Profile:
High volume node around $230-235 indicates this area has been contested heavily—now it must hold as support.
Trendline Analysis:
Rising support from 2023 lows intersects with current price, adding confluence to the $232 zone.
Market Structure:
Higher lows and higher highs remain intact. This pullback is a correction within an uptrend, not a reversal.
🎯 Why Big Tech Pullbacks Work:
Quality + Liquidity:
FAANG stocks have deep liquidity and institutional ownership. When they pull back to structure, buyers appear because the underlying businesses remain strong.
Rotation, Not Rejection:
Selloffs in mega-cap tech are often profit-taking and sector rotation, not fundamental deterioration. This creates buy-the-dip opportunities.
Historical Precedent:
Amazon has repeatedly rewarded buyers who entered during 15-20% pullbacks to support in multi-year uptrends.
📅 Timeframe Expectations:
Not a Day Trade:
This is a multi-month position (potentially 3-6 months to target). Intraday volatility should be ignored.
Quarterly Catalysts:
Amazon's next earnings report and holiday season results could act as catalysts for the move toward $320.
Patience Required:
The $232 level may retest multiple times before resolving higher. Position sizing should accommodate short-term volatility.
⚠️ What Could Go Wrong:
Macro Headwinds:
Broader market selloff could pressure all equities regardless of individual structure. The $225 stop exists for this reason.
Sector Rotation:
If money flows out of tech entirely, support may not hold. This invalidates the thesis and requires disciplined exit.
Earnings Risk:
If holding through earnings, position sizing should account for potential volatility. Consider reducing exposure before the event.
Breaking Support:
If price closes below $225, the setup is broken. No hoping, no averaging down further—just exit and reassess.
🏆 The Professional Approach:
They Buy Structure, Not Stories:
The $232 level isn't interesting because of news or narratives. It's interesting because risk is small and reward is large based on geometry.
They Scale Positions:
Rather than going all-in at $234, they build the position across $234, $232, and potentially $228. This reduces timing pressure.
They Accept Being Wrong:
If $225 breaks, they exit with a small, controlled loss. Pride doesn't enter the equation.
They Journal the Setup:
Entry rationale, risk parameters, and targets documented before the trade. Emotions don't dictate exits.
📌 Key Takeaways:
✅ GOOGL validated the pattern: The same pullback-to-support strategy that worked on Google is setting up on Amazon at $232-234.
✅ 10:1 risk/reward exists now: Entry at $233 with $225 stop and $320 target offers exceptional asymmetry this compresses as price rises.
✅ Multi-month timeframe: This isn't a quick flip. Targets may take 3-6 months. Position sizing and patience are critical.
✅ Structure over emotion: When $234 feels scary, that's the signal. When $280 feels safe, that's the warning.
✅ Scale in, scale out: Build the position across the zone, exit progressively at targets. This removes timing pressure and locks gains.
⚠️ Important Disclaimers:
This analysis is for educational purposes and reflects a technical view based on price structure, historical patterns, and risk/reward calculations. It is not financial advice or a recommendation to buy or sell AMZN or any security.
The $232-234 support zone could fail. The $225 stop loss exists because no support level is guaranteed. Proper risk management requires accepting potential loss if structure breaks.
Targets are based on historical resistance levels and do not guarantee future performance. Market conditions, company-specific events, and macroeconomic factors can prevent targets from being reached.
The GOOGL comparison is for educational pattern recognition, not a guarantee that Amazon will follow the same path. Each setup has unique risks.
Always conduct independent analysis, size positions according to your risk tolerance, and consider consulting a financial professional. All investing involves risk of loss.
✨ Join the Discussion:
Are you watching Amazon at these levels? Have you used similar pullback strategies on big tech names? Share your thoughts or questions in the comments below.
📜 Buy structure. Define risk. Trade with discipline.
Script Access: DM me on TradingView to request access.
Learn more: rbtrading.substack.com/p/premium-tradingview-indicators-hub
Learn more: rbtrading.substack.com/p/premium-tradingview-indicators-hub
Declinazione di responsabilità
Le informazioni e le pubblicazioni non sono intese come, e non costituiscono, consulenza o raccomandazioni finanziarie, di investimento, di trading o di altro tipo fornite o approvate da TradingView. Per ulteriori informazioni, consultare i Termini di utilizzo.