🔍 Key Levels
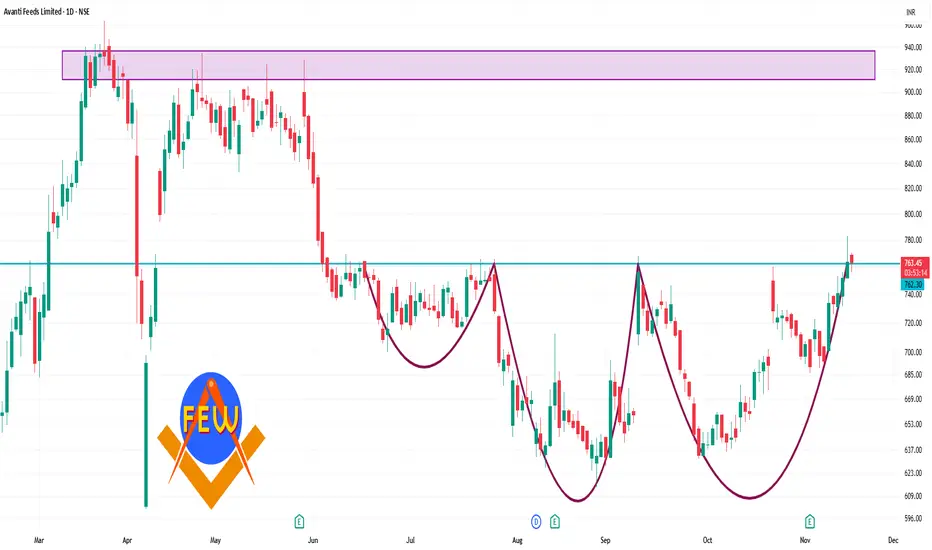
Pivot (Daily): ~ ₹ 746.47
Resistance levels:
R1 ~ ₹ 761.48
R2 ~ ₹ 770.92
R3 ~ ₹ 785.93
Support levels:
S1 ~ ₹ 737.03
S2 ~ ₹ 722.02
S3 ~ ₹ 712.58
✅ Interpretation & Use
If price holds above ~₹ 746.47 and shows strength, the next meaningful resistance zone is ~ ₹ 761-771.
If price drops below the pivot, then supports around ~ ₹ 737, and further down ~ ₹ 722 or ~ ₹ 712 become relevant.
The momentum indicators (RSI ~67.6, MACD positive) suggest bullish bias but note: when RSI gets high → risk of pull-back increases.
Pubblicazioni correlate
Declinazione di responsabilità
Le informazioni e le pubblicazioni non sono intese come, e non costituiscono, consulenza o raccomandazioni finanziarie, di investimento, di trading o di altro tipo fornite o approvate da TradingView. Per ulteriori informazioni, consultare i Termini di utilizzo.