🔄 Quick Recap since the last update (21.03.2025):
BankNifty rallied to a high of 52,063.95 on 25th March, piercing through the earlier mentioned Weekly Supply Zone by 84 points. But the bullish momentum was short-lived. Following Trump’s tariff announcement, BankNifty plunged sharply, dropping over 2,800 points to hit a low of 49,156.95 on 7th April.
🌍 Global sentiment has been shaken, but signs of recovery are emerging. Dow Futures have rebounded 4,000 points (10%), currently trading around 40,700 — a hopeful sign, but volatility remains elevated.
📅 On Wednesday (09.04.2025):
BankNifty opened with a gap-down, hit high of 50,496.90, and made a low at 49,910.85 before settling at 50,240.15, down 271 points for the day.
🔹 Trend Analysis:
Weekly Trend (50 SMA): Sideways
Daily Trend (50 SMA): Sideways
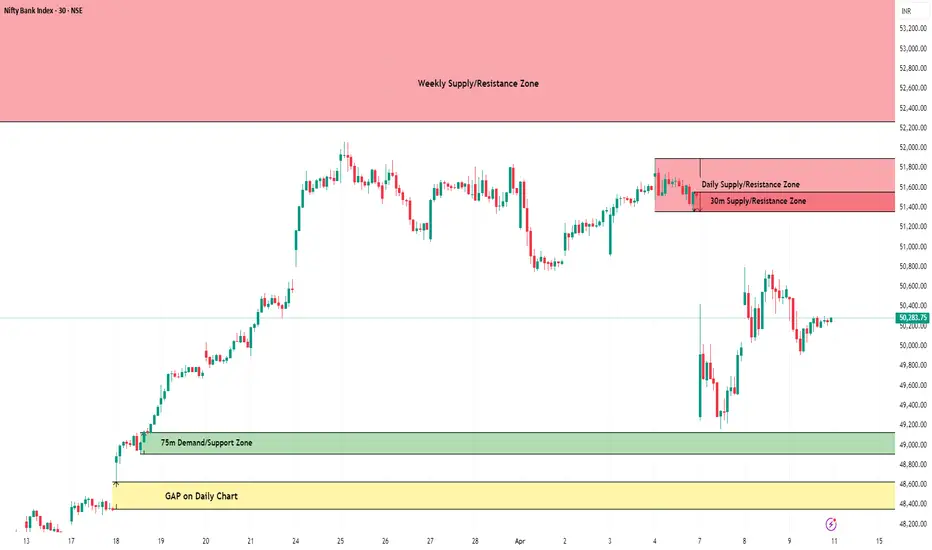
📉 Demand/Support Zones
Near Demand/Support (75m): 49,215.95 – 49,698.05
Gap Support (Daily Chart): 48,354.15 – 48,629.45
Far Support: 47,700 – 47,850 (multiple time tested on Daily Chart)
Major Support: 46,077.85 (Low of 4th June 2024)
Far Demand/Support (Daily): 44,633.85 – 45,750.40
📈 Supply/Resistance Zones
Near Supply (30m): 51,360.40 – 51,559.20 (Inside Daily Supply)
Near Supply (Daily): 51,360.40 – 51,893.60
Far Supply (Weekly): 52,264.55 – 53,775.10
🔍 Outlook:
With both trends turning sideways, BankNifty remains in a consolidation phase. Bulls are currently trapped under a strong resistance zone starting from 51,360, while downside support begins near 49,200.
Considering the volatile global setup, we may see a range-bound move with sharp intraday swings. The index must cross 51,900 decisively for any further upside. Until then, sell-on-rise near supply and buy-on-dip at demand continues to be the approach. Stay cautious. Trade levels, not emotions.
📢 Disclaimer: This analysis is intended for educational purposes only. It is not investment advice. Please consult your financial advisor before making any trading decisions.
BankNifty rallied to a high of 52,063.95 on 25th March, piercing through the earlier mentioned Weekly Supply Zone by 84 points. But the bullish momentum was short-lived. Following Trump’s tariff announcement, BankNifty plunged sharply, dropping over 2,800 points to hit a low of 49,156.95 on 7th April.
🌍 Global sentiment has been shaken, but signs of recovery are emerging. Dow Futures have rebounded 4,000 points (10%), currently trading around 40,700 — a hopeful sign, but volatility remains elevated.
📅 On Wednesday (09.04.2025):
BankNifty opened with a gap-down, hit high of 50,496.90, and made a low at 49,910.85 before settling at 50,240.15, down 271 points for the day.
🔹 Trend Analysis:
Weekly Trend (50 SMA): Sideways
Daily Trend (50 SMA): Sideways
📉 Demand/Support Zones
Near Demand/Support (75m): 49,215.95 – 49,698.05
Gap Support (Daily Chart): 48,354.15 – 48,629.45
Far Support: 47,700 – 47,850 (multiple time tested on Daily Chart)
Major Support: 46,077.85 (Low of 4th June 2024)
Far Demand/Support (Daily): 44,633.85 – 45,750.40
📈 Supply/Resistance Zones
Near Supply (30m): 51,360.40 – 51,559.20 (Inside Daily Supply)
Near Supply (Daily): 51,360.40 – 51,893.60
Far Supply (Weekly): 52,264.55 – 53,775.10
🔍 Outlook:
With both trends turning sideways, BankNifty remains in a consolidation phase. Bulls are currently trapped under a strong resistance zone starting from 51,360, while downside support begins near 49,200.
Considering the volatile global setup, we may see a range-bound move with sharp intraday swings. The index must cross 51,900 decisively for any further upside. Until then, sell-on-rise near supply and buy-on-dip at demand continues to be the approach. Stay cautious. Trade levels, not emotions.
📢 Disclaimer: This analysis is intended for educational purposes only. It is not investment advice. Please consult your financial advisor before making any trading decisions.
Pubblicazioni correlate
Declinazione di responsabilità
Le informazioni ed i contenuti pubblicati non costituiscono in alcun modo una sollecitazione ad investire o ad operare nei mercati finanziari. Non sono inoltre fornite o supportate da TradingView. Maggiori dettagli nelle Condizioni d'uso.
Pubblicazioni correlate
Declinazione di responsabilità
Le informazioni ed i contenuti pubblicati non costituiscono in alcun modo una sollecitazione ad investire o ad operare nei mercati finanziari. Non sono inoltre fornite o supportate da TradingView. Maggiori dettagli nelle Condizioni d'uso.