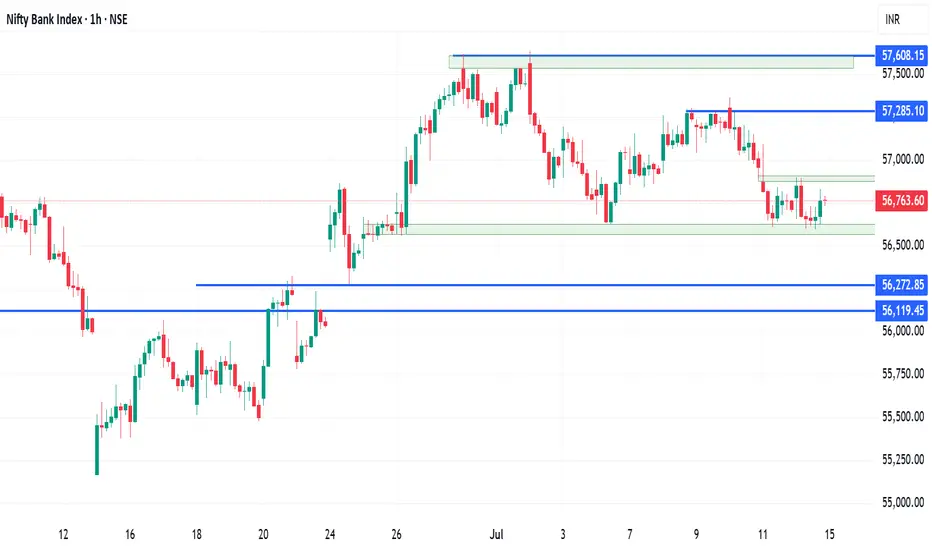
Banknifty has been trading in a range for a long time and is now trading around the support levels of 56600.
The RSI indicator on the daily charts is showing some bearish divergence and today the market has taken a halt after 2 days of fall.
If the market starts travelling on the lower side there are chances of testing the lower support level of 56120.
The market has been trading in a range of 56600 to 57600. And the support is tested many a times.
Bullish trades can be initiated for intraday play only once the market starts sustaining above today's high of 56900.
Moving averages are also forming a resistance gate around the resistance level. Watch for the breakout and enter only on the retest of the levels.
Major support levels :- 56600, 56270, 56120
Resistance levels :- 56900, 57285
Wait for the price action and trade according to the price action.
Pubblicazioni correlate
Declinazione di responsabilità
Le informazioni ed i contenuti pubblicati non costituiscono in alcun modo una sollecitazione ad investire o ad operare nei mercati finanziari. Non sono inoltre fornite o supportate da TradingView. Maggiori dettagli nelle Condizioni d'uso.
Pubblicazioni correlate
Declinazione di responsabilità
Le informazioni ed i contenuti pubblicati non costituiscono in alcun modo una sollecitazione ad investire o ad operare nei mercati finanziari. Non sono inoltre fornite o supportate da TradingView. Maggiori dettagli nelle Condizioni d'uso.