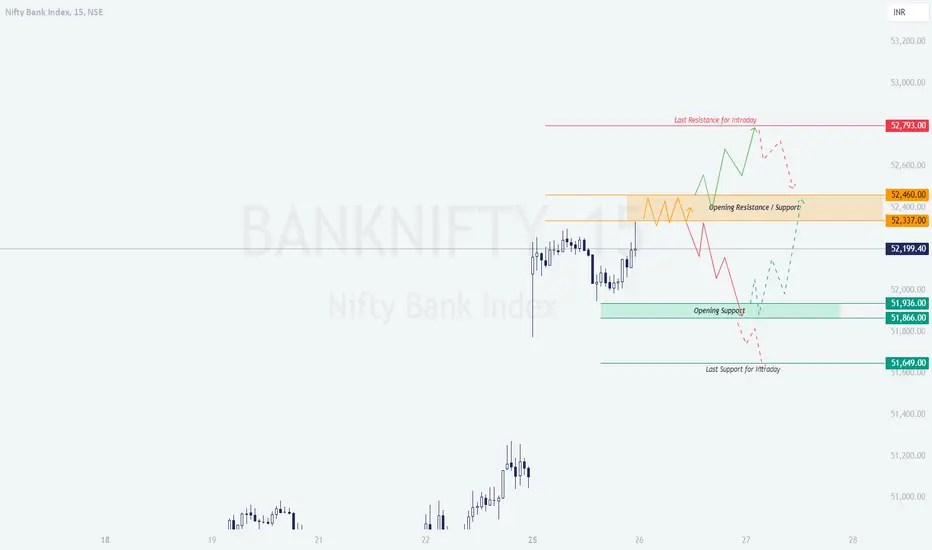
Bank Nifty Trading Plan for 26th November 2024
Intro:
In the previous trading session, Bank Nifty showed a strong upward movement but faced resistance near the 52,200 - 52250 level, forming a consolidation pattern. The chart indicates key levels for the next trading day. Yellow trendlines represent a sideways movement, green trendlines represent a bullish trend, and red trendlines indicate a bearish trend. Based on the chart, here’s a detailed trading plan for 26th November 2024, covering all potential opening scenarios.
Gap Up Opening (200+ Points Above Previous Close):
- [] If Bank Nifty opens above 52,460, the index will enter a key resistance zone (52,460–52,793). Watch for a breakout above 52,793. If it sustains above this level, look for bullish opportunities toward the next target at 53,200. [] If resistance at 52,460–52,793 holds and Bank Nifty shows signs of rejection, a pullback to 52,337 or even 52,199 is possible. Be cautious about reversals in this zone.
- Avoid aggressive longs if the price struggles near 52,460 and fails to break out decisively.
Flat Opening (Within ±50 Points):- [] Monitor price action at 52,337–52,460. This zone will act as the immediate resistance. If Bank Nifty consolidates or shows rejection here, expect a move toward the opening support at 51,936–51,866. [] For bullish opportunities, wait for a breakout above 52,460 with strong volume confirmation. Targets remain 52,793 and 53,200.
- If the index breaks below 52,199, the bearish scenario will dominate, and we may see levels around 51,866 or even the last intraday support at 51,649.
Gap Down Opening (200+ Points Below Previous Close):- [] A gap down below 52,199 will bring the focus to the 51,936–51,866 support zone. Watch for reversal patterns or strong buying cues in this area for a possible upward bounce. [] If the price breaks below 51,866, the index could slide further to test 51,649. A failure to hold 51,649 may trigger a deeper bearish move toward 51,500 or lower.
- Any bullish attempts will require the index to reclaim 52,199 with conviction before targeting 52,337 or higher.
- [] Always calculate risk-reward before entering a trade. Avoid taking trades with a risk-reward ratio below 1:2. [] Keep position size small, especially if trading volatile options or on uncertain days. [] Use stop-loss orders for every trade and stick to them. For intraday trading, avoid carrying losses into the next day. [] Avoid chasing trades after a significant move; wait for pullbacks or clear confirmation.
- Monitor implied volatility (IV) while trading options. High IV means premium decay can occur rapidly if momentum stalls.
The 52,460 level remains the critical zone to watch for bullish momentum. A break and sustain above it could take Bank Nifty to 52,793 or higher. Conversely, failure to hold above 52,199 may lead to testing of lower supports at 51,936 and 51,649. Be cautious and wait for clear confirmation before executing trades. Sideways consolidation may occur if Bank Nifty remains stuck in the range of 52,199–52,460.
Disclaimer:
This analysis is for educational purposes only. I am not a SEBI-registered analyst. All views and levels mentioned here are based on personal technical observations. Please consult your financial advisor and perform your own research before trading or investing.
Declinazione di responsabilità
Le informazioni ed i contenuti pubblicati non costituiscono in alcun modo una sollecitazione ad investire o ad operare nei mercati finanziari. Non sono inoltre fornite o supportate da TradingView. Maggiori dettagli nelle Condizioni d'uso.
Declinazione di responsabilità
Le informazioni ed i contenuti pubblicati non costituiscono in alcun modo una sollecitazione ad investire o ad operare nei mercati finanziari. Non sono inoltre fornite o supportate da TradingView. Maggiori dettagli nelle Condizioni d'uso.
