📊 Key Technical Indicators
Relative Strength Index (RSI): 47.96 – Neutral, indicating neither overbought nor oversold conditions.
MACD: 6.55 – Strong bearish, suggesting downward momentum.
Average Directional Index (ADX): 17.09 – Neutral, indicating a weak trend.
Super Trend: ₹1,870.13 – Mild bullish, suggesting a slight upward trend.
Williams %R: -67.16 – Neutral, indicating no extreme overbought or oversold conditions.
Commodity Channel Index (CCI): -1.48 – Neutral, suggesting no strong trend.
📈 Moving Averages Analysis
Exponential Moving Averages (EMA):
5-period: ₹1,924.98 – Strong bearish.
15-period: ₹1,924.34 – Strong bearish.
50-period: ₹1,913.43 – Strong bearish.
100-period: ₹1,884.82 – Mild bullish.
Simple Moving Averages (SMA):
5-period: ₹1,927.04 – Mild bullish.
15-period: ₹1,925.39 – Mild bullish.
50-period: ₹1,909.92 – Mild bullish.
200-period: ₹1,792.48 – Mild bullish.
The alignment of moving averages indicates a generally bullish sentiment in the short term.
🔄 Trend and Volume Insights
Trend: The stock is exhibiting a mild bullish trend, supported by the Super Trend indicator and the alignment of moving averages.
Volume: An increase in trading volume could confirm the strength of the current trend.
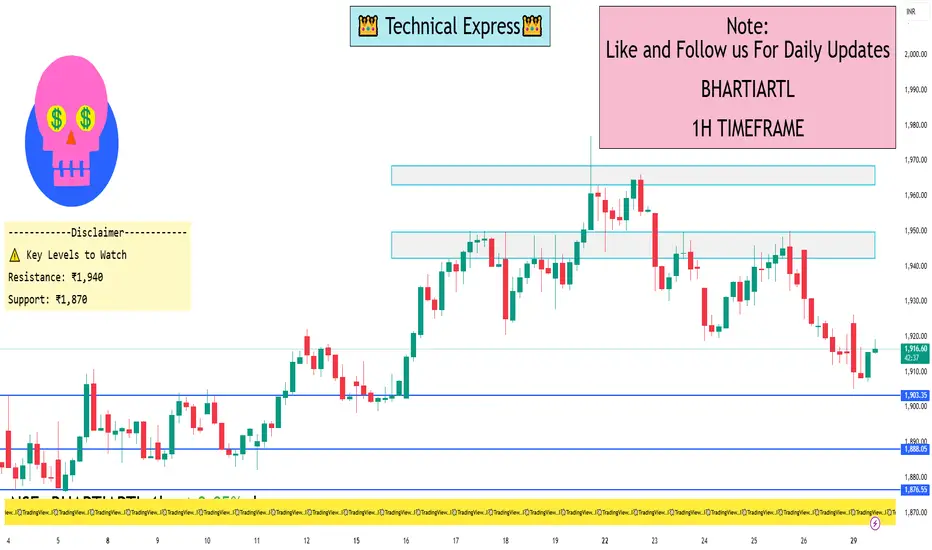
⚠️ Key Levels to Watch
Resistance: ₹1,940 – a potential barrier if the stock continues its upward movement.
Support: ₹1,870 – a level to watch for potential price rebounds.
✅ Summary
Bharti Airtel Ltd. is currently in a mild bullish phase on the 1-hour timeframe, with supportive indicators and moving averages. However, the ADX suggests weak trend strength, indicating potential consolidation. Traders should monitor key levels and volume changes for confirmation of trend continuation.
Relative Strength Index (RSI): 47.96 – Neutral, indicating neither overbought nor oversold conditions.
MACD: 6.55 – Strong bearish, suggesting downward momentum.
Average Directional Index (ADX): 17.09 – Neutral, indicating a weak trend.
Super Trend: ₹1,870.13 – Mild bullish, suggesting a slight upward trend.
Williams %R: -67.16 – Neutral, indicating no extreme overbought or oversold conditions.
Commodity Channel Index (CCI): -1.48 – Neutral, suggesting no strong trend.
📈 Moving Averages Analysis
Exponential Moving Averages (EMA):
5-period: ₹1,924.98 – Strong bearish.
15-period: ₹1,924.34 – Strong bearish.
50-period: ₹1,913.43 – Strong bearish.
100-period: ₹1,884.82 – Mild bullish.
Simple Moving Averages (SMA):
5-period: ₹1,927.04 – Mild bullish.
15-period: ₹1,925.39 – Mild bullish.
50-period: ₹1,909.92 – Mild bullish.
200-period: ₹1,792.48 – Mild bullish.
The alignment of moving averages indicates a generally bullish sentiment in the short term.
🔄 Trend and Volume Insights
Trend: The stock is exhibiting a mild bullish trend, supported by the Super Trend indicator and the alignment of moving averages.
Volume: An increase in trading volume could confirm the strength of the current trend.
⚠️ Key Levels to Watch
Resistance: ₹1,940 – a potential barrier if the stock continues its upward movement.
Support: ₹1,870 – a level to watch for potential price rebounds.
✅ Summary
Bharti Airtel Ltd. is currently in a mild bullish phase on the 1-hour timeframe, with supportive indicators and moving averages. However, the ADX suggests weak trend strength, indicating potential consolidation. Traders should monitor key levels and volume changes for confirmation of trend continuation.
I built a Buy & Sell Signal Indicator with 85% accuracy.
📈 Get access via DM or
WhatsApp: wa.link/d997q0
Contact - +91 76782 40962
| Email: techncialexpress@gmail.com
| Script Coder | Trader | Investor | From India
📈 Get access via DM or
WhatsApp: wa.link/d997q0
Contact - +91 76782 40962
| Email: techncialexpress@gmail.com
| Script Coder | Trader | Investor | From India
Pubblicazioni correlate
Declinazione di responsabilità
Le informazioni e le pubblicazioni non sono intese come, e non costituiscono, consulenza o raccomandazioni finanziarie, di investimento, di trading o di altro tipo fornite o approvate da TradingView. Per ulteriori informazioni, consultare i Termini di utilizzo.