BHEL Stock Analysis
Analysis Highlights:
The stock is in a corrective phase but shows potential for a strong rebound from key support zones.
Short-term resistance at ₹255–₹260. Breakout above this could lead to a rally.
Action Plan: Accumulate in the buy zone for swing trading with controlled risk and solid upside potential.
Deeper and Educational Insights
Key Takeaways for Learning:
Always identify buy zones based on technical indicators like Fibonacci and chart patterns.
Use stop-loss orders to limit downside risk and protect capital.
Monitor resistance levels for partial exits and re-entry opportunities.
Conclusion:
This setup is a textbook example of combining Elliott Wave Theory with Fibonacci retracement. Traders can use this to plan entries, exits, and manage risks effectively. It’s a bullish scenario with clear targets and defined risk limits.
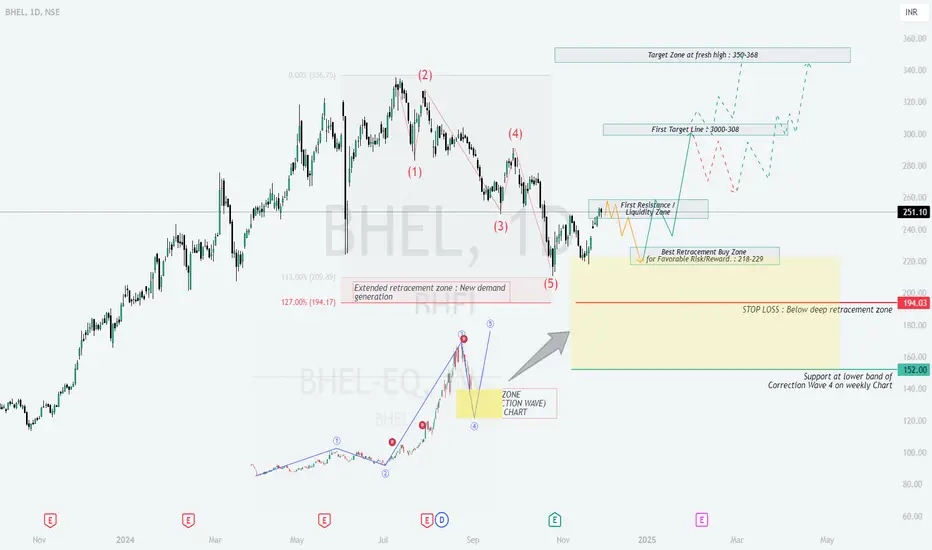
- []Entry Zone: ₹218–₹229 (Ideal buying range).
[]Targets:
First Target: ₹300–₹308.
Final Target: ₹350–₹368. - Stop Loss: ₹194 (Below the extended retracement zone).
Analysis Highlights:
The stock is in a corrective phase but shows potential for a strong rebound from key support zones.
Short-term resistance at ₹255–₹260. Breakout above this could lead to a rally.
Action Plan: Accumulate in the buy zone for swing trading with controlled risk and solid upside potential.
Deeper and Educational Insights
- Elliott Wave Theory Application:
The stock is completing corrective Wave 4-wave pattern. This is followed by a impulsive Wave 3, typically retracing a portion of the prior rally.
The retracement aligns with Fibonacci levels, highlighting ₹218–₹229 as a high-probability buy zone. - Key Levels to Watch:
Support Zones:
₹218–₹229: This is the primary retracement buy zone for a favorable risk/reward ratio.
₹152: The final support at the lower band of the correction zone on the weekly chart.
Resistance and Target Zones:
₹255–₹260: First resistance and liquidity zone. Expect price to pause or consolidate here.
₹300–₹308: First target zone, where partial profit booking is advisable.
₹350–₹368: Final target zone, marking a fresh high. - Risk Management:
Stop Loss: Place below ₹194 to limit downside risk. This aligns with the deep retracement zone and protects capital in case of extended corrections. - Entry Strategy:
Use staggered buying within ₹218–₹229. This method helps reduce risk exposure in case of volatility. - Market Psychology:
The current corrective phase represents profit-taking and demand generation. Once buyers regain momentum, the stock is likely to test higher resistance zones. - Why This Setup Works:
The retracement zone reflects institutional demand, and historical price action suggests strong support levels in this area.
The alignment with Fibonacci levels and Elliott Wave theory increases the probability of a successful trade.
Key Takeaways for Learning:
Always identify buy zones based on technical indicators like Fibonacci and chart patterns.
Use stop-loss orders to limit downside risk and protect capital.
Monitor resistance levels for partial exits and re-entry opportunities.
Conclusion:
This setup is a textbook example of combining Elliott Wave Theory with Fibonacci retracement. Traders can use this to plan entries, exits, and manage risks effectively. It’s a bullish scenario with clear targets and defined risk limits.
Declinazione di responsabilità
Le informazioni e le pubblicazioni non sono intese come, e non costituiscono, consulenza o raccomandazioni finanziarie, di investimento, di trading o di altro tipo fornite o approvate da TradingView. Per ulteriori informazioni, consultare i Termini di utilizzo.
Declinazione di responsabilità
Le informazioni e le pubblicazioni non sono intese come, e non costituiscono, consulenza o raccomandazioni finanziarie, di investimento, di trading o di altro tipo fornite o approvate da TradingView. Per ulteriori informazioni, consultare i Termini di utilizzo.