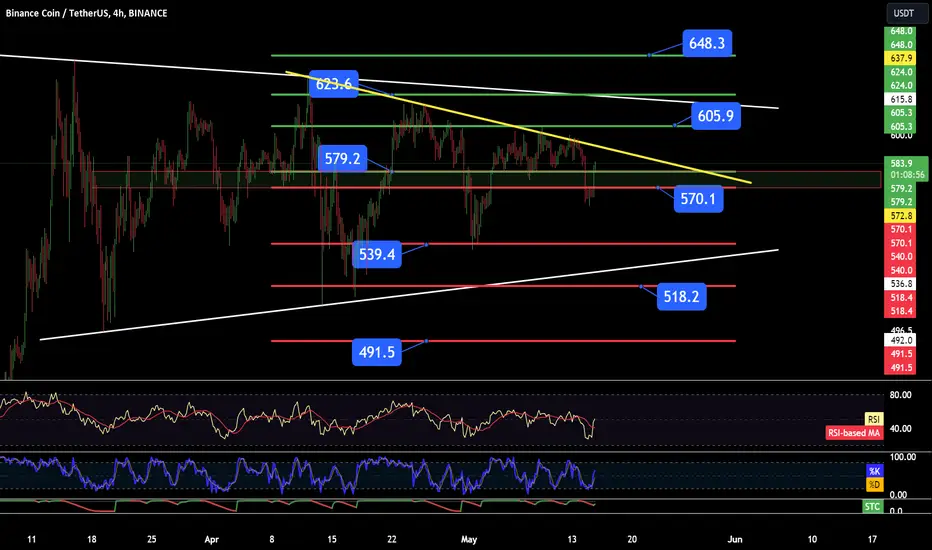
Hello everyone, let's look at the 4H BNB to USDT chart, in this situation we can see how the price is moving in a sideways trend channel, staying below the local downtrend line.
Let's start by setting goals for the near future that we can include:
T1 = USD 579.2 at which the price struggles
T2 = $605.9
T3 = $623.6
AND
T4 = $648.3
Now let's move on to the stop-loss in case of further market declines:
SL1 = $570.1
SL2 = $539.4
SL3 = $518.2
AND
SL4 = $491.50
Let's start by setting goals for the near future that we can include:
T1 = USD 579.2 at which the price struggles
T2 = $605.9
T3 = $623.6
AND
T4 = $648.3
Now let's move on to the stop-loss in case of further market declines:
SL1 = $570.1
SL2 = $539.4
SL3 = $518.2
AND
SL4 = $491.50
Declinazione di responsabilità
Le informazioni e le pubblicazioni non sono intese come, e non costituiscono, consulenza o raccomandazioni finanziarie, di investimento, di trading o di altro tipo fornite o approvate da TradingView. Per ulteriori informazioni, consultare i Termini di utilizzo.
Declinazione di responsabilità
Le informazioni e le pubblicazioni non sono intese come, e non costituiscono, consulenza o raccomandazioni finanziarie, di investimento, di trading o di altro tipo fornite o approvate da TradingView. Per ulteriori informazioni, consultare i Termini di utilizzo.