Technical Analysis and Outlook:
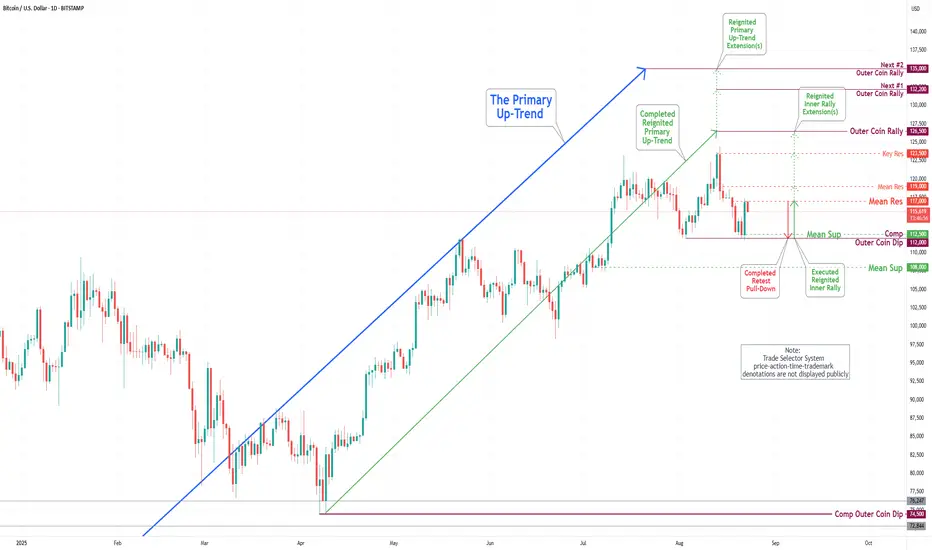
During the current trading session, the Bitcoin market has experienced a noteworthy pullback to the completed Outer Coin Dip at 112000, and as a result, has demonstrated considerable resilience, reaching the Mean Resistance (the inverse of Mean Support) at 116600 as detailed in the Daily Chart Analysis for the week of August 15. The prevailing analysis suggests that the cryptocurrency may revisit the Mean Support at 116500, as well as the completed Outer Coin Dip at 112000, before resuming its bullish trend.
During the current trading session, the Bitcoin market has experienced a noteworthy pullback to the completed Outer Coin Dip at 112000, and as a result, has demonstrated considerable resilience, reaching the Mean Resistance (the inverse of Mean Support) at 116600 as detailed in the Daily Chart Analysis for the week of August 15. The prevailing analysis suggests that the cryptocurrency may revisit the Mean Support at 116500, as well as the completed Outer Coin Dip at 112000, before resuming its bullish trend.
Pubblicazioni correlate
Declinazione di responsabilità
Le informazioni ed i contenuti pubblicati non costituiscono in alcun modo una sollecitazione ad investire o ad operare nei mercati finanziari. Non sono inoltre fornite o supportate da TradingView. Maggiori dettagli nelle Condizioni d'uso.
Pubblicazioni correlate
Declinazione di responsabilità
Le informazioni ed i contenuti pubblicati non costituiscono in alcun modo una sollecitazione ad investire o ad operare nei mercati finanziari. Non sono inoltre fornite o supportate da TradingView. Maggiori dettagli nelle Condizioni d'uso.