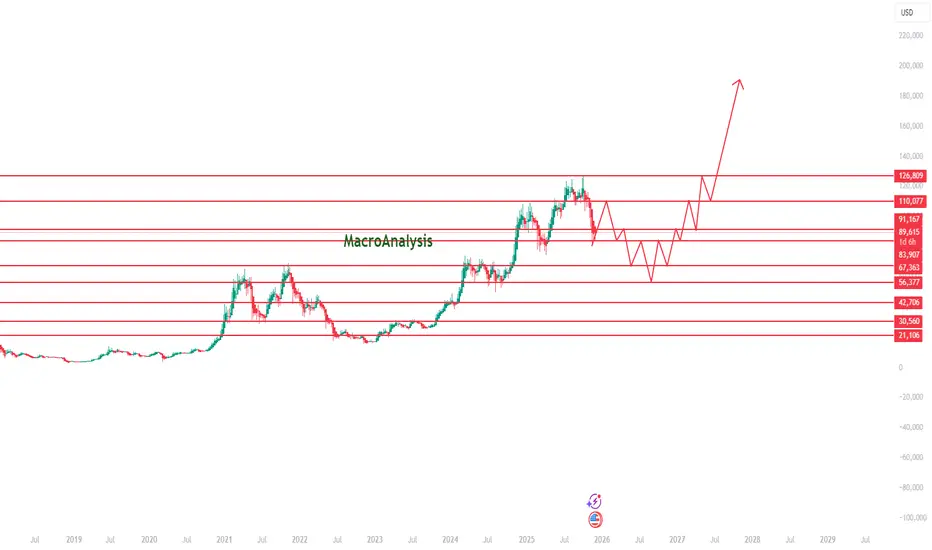
This chart presents a long-term BTC roadmap based on major weekly and monthly support/resistance zones, reflecting how BTC typically behaves during mid-cycle phases. Price has recently reacted to the 110K macro resistance, triggering a corrective leg that fits the broader rhythm of previous BTC cycles.
The projected path highlights a realistic multi-stage structure:
• Mid-Cycle Corrective Phase
BTC is forming lower highs and lower lows after the rejection from 110K, with a likely retest of key demand zones between 83K → 67K. Deeper liquidity sweeps into the 56K region remain possible before establishing a macro higher low.
• Accumulation Zone
Inside this lower region, BTC historically creates sideways, choppy movement—sweeping liquidity both directions as market participants reposition. This mirrors prior mid-cycle accumulation phases and sets the foundation for the next macro advance.
• Recovery Phase & Re-Accumulation
Once accumulation stabilizes, structure favors a recovery back toward 91K → 110K, driven by regained momentum and market strength. A successful breakout from this zone signals the beginning of the next expansion wave.
• Macro Expansion Phase
Clearing 110K opens the door toward 126K–140K, the next major macro resistance region and potential cycle extension target.
This idea isn’t a prediction—it’s a structural map, focused on how BTC historically behaves around cycle midpoints: parabolic advance → correction → accumulation → breakout → expansion. The chart emphasizes market memory, key levels, and BTC’s typical volatility during expansion phases.
Macro Levels to Watch:
• 110,077 – major resistance, recent rejection zone
• 91,167 / 89,688 – mid-level pivot controlling short-term direction
• 83,907 – key support that preserves bullish structure
• 67,363 – strong historical demand and liquidity magnet
• 126,809 – next major resistance above ATH
Declinazione di responsabilità
Le informazioni e le pubblicazioni non sono intese come, e non costituiscono, consulenza o raccomandazioni finanziarie, di investimento, di trading o di altro tipo fornite o approvate da TradingView. Per ulteriori informazioni, consultare i Termini di utilizzo.
Declinazione di responsabilità
Le informazioni e le pubblicazioni non sono intese come, e non costituiscono, consulenza o raccomandazioni finanziarie, di investimento, di trading o di altro tipo fornite o approvate da TradingView. Per ulteriori informazioni, consultare i Termini di utilizzo.