The market continues to follow a macro-pattern similar to the previous bull cycles that unfolded in Q4 of 2013, 2017, 2020, and 2021. I discussed this structure in detail in my August 18 update:

Specifically: a summer rally, several weeks of September correction and consolidation, followed by the beginning of a new upside leg in early October.
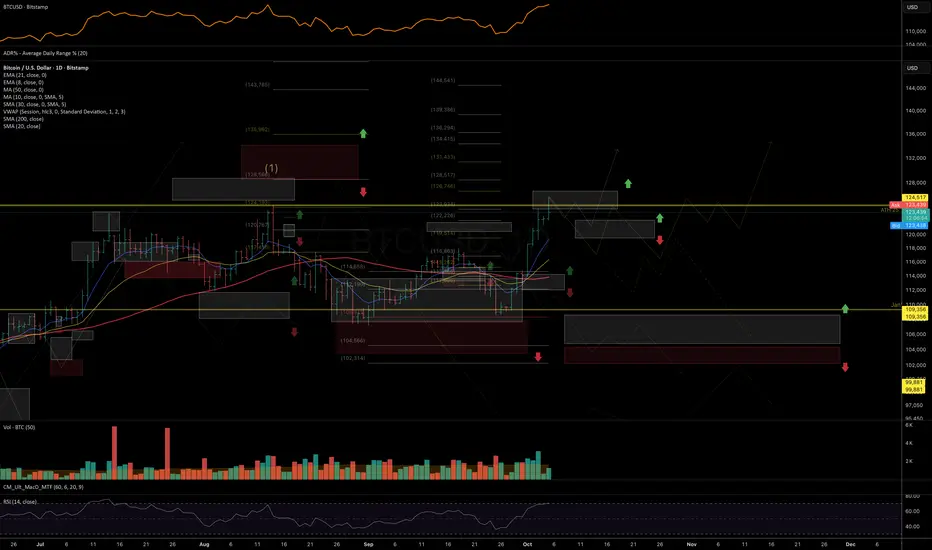
Updated BTC chart:

Another key development is the stablecoin market capitalization approaching a major technical zone. A confirmed breakout above it could signal a strong liquidity rotation into crypto assets — potentially marking the start of a new wave of growth across the crypto space, similar to the dynamics seen in 2023 and 2024.
Inverse correlation of BTC and stablecoin market cap:

Perhaps the most compelling factor is Bitcoin’s relationship with gold. Despite massive institutional adoption through ETFs, the BTC/GOLD ratio has remained stagnant since early 2021. This suggests that Bitcoin remains significantly undervalued relative to gold, leaving substantial room for appreciation as the digital asset continues its mainstream integration.
BTC/GOLD chart:

These factors — combined with the fact that most altcoins have already broken above their local resistance zones mentioned in the previous review — point to a potential recovery of upside momentum across the crypto market and higher targets into Q4.
As long as prices hold above their local and mid-term support zones, I expect continuation of the rally toward the next resistance levels. Breaking these support zones, will push odds in favor of more prolonged consolidation. But as long as BTC is not closing bellow its 50DMA for more than two weeks, macro bull cycles remains intact.
Below are the key technical levels for the main assets this week:
 BTCUSD
Chart:
Short-term support: 122–119.5K
Mid-term support: 117–115K
Resistance: 131–135K
 ETHUSD
Chart:
Support: 4400–4375
Resistance: 4870–5070
 BNBUSD
Chart:
Support: 1142–1089
Resistance: 1225–1275

 XRPUSDT
Chart:
Support: 2.92–2.88
Resistance: 3.20–3.35
 HYPEHUSD
Chart:
Support: 48.5–47.35–46
Resistance: 55.5–60
 SOLUSDT
Chart:
Short-term support: 223–219
Mid-term support: 212–207
Resistance: 247–260
Thank you for reading - wishing you a great Sunday and a strong start to the new trading week.
Specifically: a summer rally, several weeks of September correction and consolidation, followed by the beginning of a new upside leg in early October.
Updated BTC chart:
Another key development is the stablecoin market capitalization approaching a major technical zone. A confirmed breakout above it could signal a strong liquidity rotation into crypto assets — potentially marking the start of a new wave of growth across the crypto space, similar to the dynamics seen in 2023 and 2024.
Inverse correlation of BTC and stablecoin market cap:
Perhaps the most compelling factor is Bitcoin’s relationship with gold. Despite massive institutional adoption through ETFs, the BTC/GOLD ratio has remained stagnant since early 2021. This suggests that Bitcoin remains significantly undervalued relative to gold, leaving substantial room for appreciation as the digital asset continues its mainstream integration.
BTC/GOLD chart:
These factors — combined with the fact that most altcoins have already broken above their local resistance zones mentioned in the previous review — point to a potential recovery of upside momentum across the crypto market and higher targets into Q4.
As long as prices hold above their local and mid-term support zones, I expect continuation of the rally toward the next resistance levels. Breaking these support zones, will push odds in favor of more prolonged consolidation. But as long as BTC is not closing bellow its 50DMA for more than two weeks, macro bull cycles remains intact.
Below are the key technical levels for the main assets this week:
Chart:
Short-term support: 122–119.5K
Mid-term support: 117–115K
Resistance: 131–135K
Chart:
Support: 4400–4375
Resistance: 4870–5070
Chart:
Support: 1142–1089
Resistance: 1225–1275
Chart:
Support: 2.92–2.88
Resistance: 3.20–3.35
Chart:
Support: 48.5–47.35–46
Resistance: 55.5–60
Chart:
Short-term support: 223–219
Mid-term support: 212–207
Resistance: 247–260
Thank you for reading - wishing you a great Sunday and a strong start to the new trading week.
📊 Daily FREE Market Insights | Crypto + US Stocks
⚡ Technical analysis, setups & commentary
🌍 t.me/MarketArtistryENG | 🇷🇺 t.me/marketartistry
⚡ Technical analysis, setups & commentary
🌍 t.me/MarketArtistryENG | 🇷🇺 t.me/marketartistry
Pubblicazioni correlate
Declinazione di responsabilità
Le informazioni e le pubblicazioni non sono intese come, e non costituiscono, consulenza o raccomandazioni finanziarie, di investimento, di trading o di altro tipo fornite o approvate da TradingView. Per ulteriori informazioni, consultare i Termini di utilizzo.