🚀 BTC/USD 5M - Short-Term Analysis: Bullish Displacement & FVG Fill the 5-minute chart for Bitcoin shows a significant shift in immediate order flow, characterized by a liquidity sweep followed by a strong displacement that left behind a clear price imbalance.
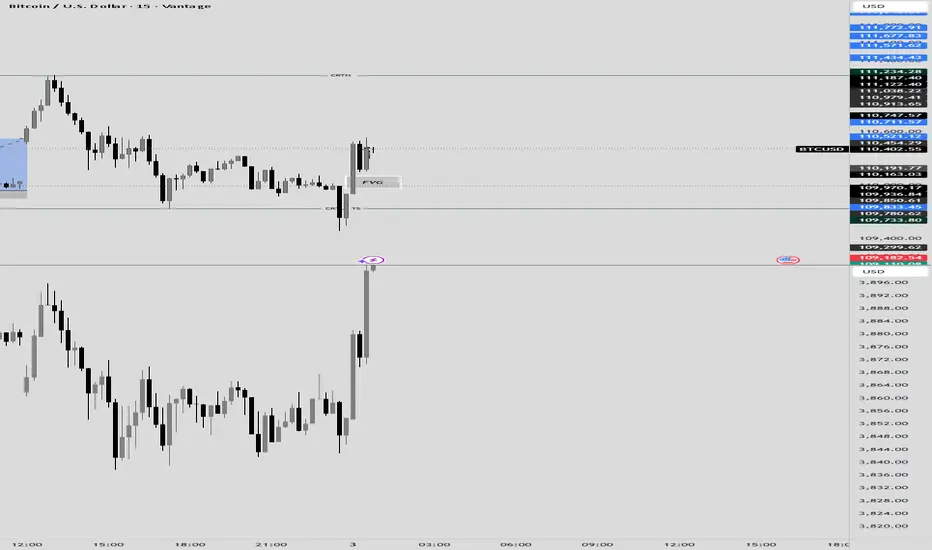
📊 Structure and Key LevelsCRTL + TS ($109,780.62 - $109,850.61): This zone marks a "Clear Run on the Low" (CRTL) or "True Stop-run" (TS). Price dipped below prior lows to trigger sell stops/liquidity, then immediately reversed higher. This is a classic sign of liquidity collection by institutional buyers.
FVG (Fair Value Gap/Imbalance): The strong green candles following the sweep created a significant Fair Value Gap between approximately $110,163.03 and $110,191.77. Price has recently retraced precisely into this gap.CRTH ($111,234.28): This level (a "Clear Run on the High") represents the major Buy-Side Liquidity (BSL) target that has been left un-tested and is the most likely destination for the next bullish move.
📈 Current Price Action and BiasThe chart shows a high-probability "Sweep $\rightarrow$ Displacement $\rightarrow$ Retrace to FVG" setup, which strongly favors continuation in the direction of the displacement (upward).
Stop Hunt Complete:
The market has successfully collected sell-side liquidity, providing the fuel for the move up.FVG Retest: Price has returned to the Fair Value Gap to effectively "fill" the imbalance created by the aggressive buying. This zone acts as a high-probability demand zone or entry point for bulls.
Bullish Confirmation: As long as price holds above the low of the liquidity sweep ($109,780.62), the immediate bias is bullish.
🎯 Trade Expectation
Entry: Look for confirmation (strong bullish candles or lower-timeframe shift) within or just below the FVG area.Target 1 (Liquidity): The primary target is the CRTH at $111,234.28 to clear the buy-side liquidity resting above those highs.Invalidation: A decisive close below the CRTL + TS zone (below $109,780.62) would invalidate the bullish structure and suggest a deeper drop toward the lower liquidity/support at $109,000.
Declinazione di responsabilità
Le informazioni ed i contenuti pubblicati non costituiscono in alcun modo una sollecitazione ad investire o ad operare nei mercati finanziari. Non sono inoltre fornite o supportate da TradingView. Maggiori dettagli nelle Condizioni d'uso.
Declinazione di responsabilità
Le informazioni ed i contenuti pubblicati non costituiscono in alcun modo una sollecitazione ad investire o ad operare nei mercati finanziari. Non sono inoltre fornite o supportate da TradingView. Maggiori dettagli nelle Condizioni d'uso.