📊 Weekly Technical Levels
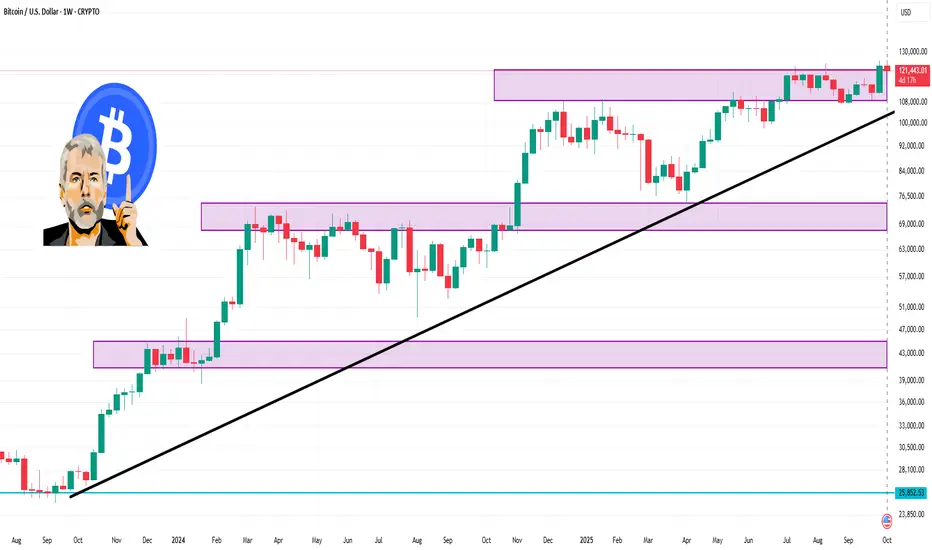
Resistance Levels:
$124,652.59
$127,266.08
$129,248.44
Support Levels:
$120,056.73
$118,074.38
$115,460.88
These levels are based on Barchart's technical analysis and are derived from the most recent data available.
📈 Technical Indicators
Relative Strength Index (RSI): The RSI is currently at 61.95%, indicating that Bitcoin is neither overbought nor oversold.
Stochastic Oscillator: Both the %K and %D lines are in the 80% range, suggesting that Bitcoin is in an overbought condition, which could precede a pullback.
Average True Range (ATR): The 9-day ATR is 3,316.77, indicating a daily price movement of approximately 2.73%.
Directional Movement Index (DMI): The +DI is at 35.72, and the -DI is at 10.17, suggesting a strong bullish trend.
🔮 Market Outlook
Analysts project that Bitcoin may reach up to $126,865 within the next week, with a potential target of $129,753 over the next four weeks.
⚠️ Risk Considerations
While the long-term outlook appears bullish, it's essential to monitor key support levels. A drop below $120,000 could signal a short-term correction. Additionally, the stochastic oscillator indicates an overbought condition, which may lead to a pullback.
Pubblicazioni correlate
Declinazione di responsabilità
Le informazioni e le pubblicazioni non sono intese come, e non costituiscono, consulenza o raccomandazioni finanziarie, di investimento, di trading o di altro tipo fornite o approvate da TradingView. Per ulteriori informazioni, consultare i Termini di utilizzo.