Bitcoin (BTC/USDT) – Full Technical Breakdown - Timeframe: 1D
Market Structure & SMC (Smart Money Concepts)
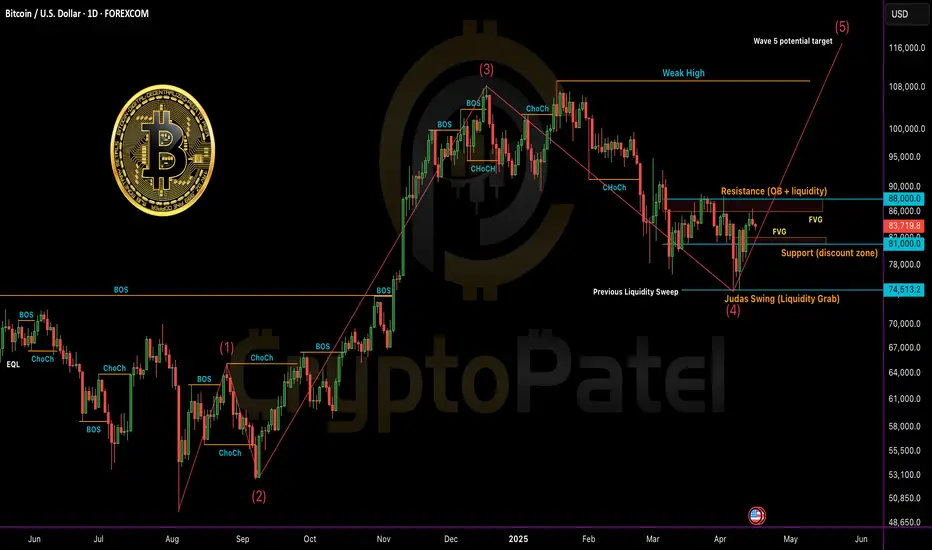
✅ CHoCH (Change of Character) confirmed from $105K top → current lower high around 88K zone.
📉 Break of Structure (BOS) to the downside occurred at $91K.
🟠 Bearish Order Block (OB): $86K–88K (price currently reacting here).
Liquidity Levels:
Sell-side: Swept at $76K
Buy-side: Sitting above88K
Fair Value Gap (FVG): Unfilled zone between $81K– 82K may act as magnet for price.
ICT Model Alignment
Judas Swing: Sharp liquidity grab below $76K → followed by rebound — classic manipulation before real move.
PD Array Setup:
Resistance:88K (bearish OB + buy-side liquidity)
Support: $81K (discount zone + FVG)
Elliott Wave Outlook
Wave 1: July–Sept 2024
Wave 3: Nov–Feb rally to $105K (extended wave)
Wave 4: Correction to $76K likely complete
Wave 5 Target: Potential $115K+ if structure holds
Fractal Observation
🔹 Current price structure is mimicking Nov 2023–Jan 2024 pattern
🔹 If history rhymes: consolidation → breakout → retest → parabolic rally
Key Levels to Watch
🔼 Bullish Confirmation: Daily close above88K → targeting  92K–$100K
🔽 Bearish Rejection: Drop below $81K → next support at $74K–$76K
Strategy Summary
🔹 Short-Term Bias: Cautiously Bullish
🔹 Entry Zone: Retest near82K (FVG + OB)
🔹 SL: Below $79.5K
🔹 TP Zones:88K → 92K →  98K
98K
📈 R:R = Minimum 1:5 (High confluence)
Keep your eyes on HTF closures and manage risk. Liquidity traps are in play.
Market Structure & SMC (Smart Money Concepts)
✅ CHoCH (Change of Character) confirmed from $105K top → current lower high around
📉 Break of Structure (BOS) to the downside occurred at $91K.
🟠 Bearish Order Block (OB): $86K–
Liquidity Levels:
Sell-side: Swept at $76K
Buy-side: Sitting above
Fair Value Gap (FVG): Unfilled zone between $81K–
ICT Model Alignment
Judas Swing: Sharp liquidity grab below $76K → followed by rebound — classic manipulation before real move.
PD Array Setup:
Resistance:
Support: $81K (discount zone + FVG)
Elliott Wave Outlook
Wave 1: July–Sept 2024
Wave 3: Nov–Feb rally to $105K (extended wave)
Wave 4: Correction to $76K likely complete
Wave 5 Target: Potential $115K+ if structure holds
Fractal Observation
🔹 Current price structure is mimicking Nov 2023–Jan 2024 pattern
🔹 If history rhymes: consolidation → breakout → retest → parabolic rally
Key Levels to Watch
🔼 Bullish Confirmation: Daily close above
🔽 Bearish Rejection: Drop below $81K → next support at $74K–$76K
Strategy Summary
🔹 Short-Term Bias: Cautiously Bullish
🔹 Entry Zone: Retest near
🔹 SL: Below $79.5K
🔹 TP Zones:
📈 R:R = Minimum 1:5 (High confluence)
Keep your eyes on HTF closures and manage risk. Liquidity traps are in play.
Twitter: twitter.com/CryptoPatel
Telegram: t.me/OfficialCryptoPatel
Instagram: instagram.com/cryptopatel?utm_medium=copy_link
Telegram: t.me/OfficialCryptoPatel
Instagram: instagram.com/cryptopatel?utm_medium=copy_link
Declinazione di responsabilità
Le informazioni ed i contenuti pubblicati non costituiscono in alcun modo una sollecitazione ad investire o ad operare nei mercati finanziari. Non sono inoltre fornite o supportate da TradingView. Maggiori dettagli nelle Condizioni d'uso.